Walmart (WMT) Posts Sharp Gain Ahead of Earnings: Is the Uptrend Stabilizing for a New Ascent?
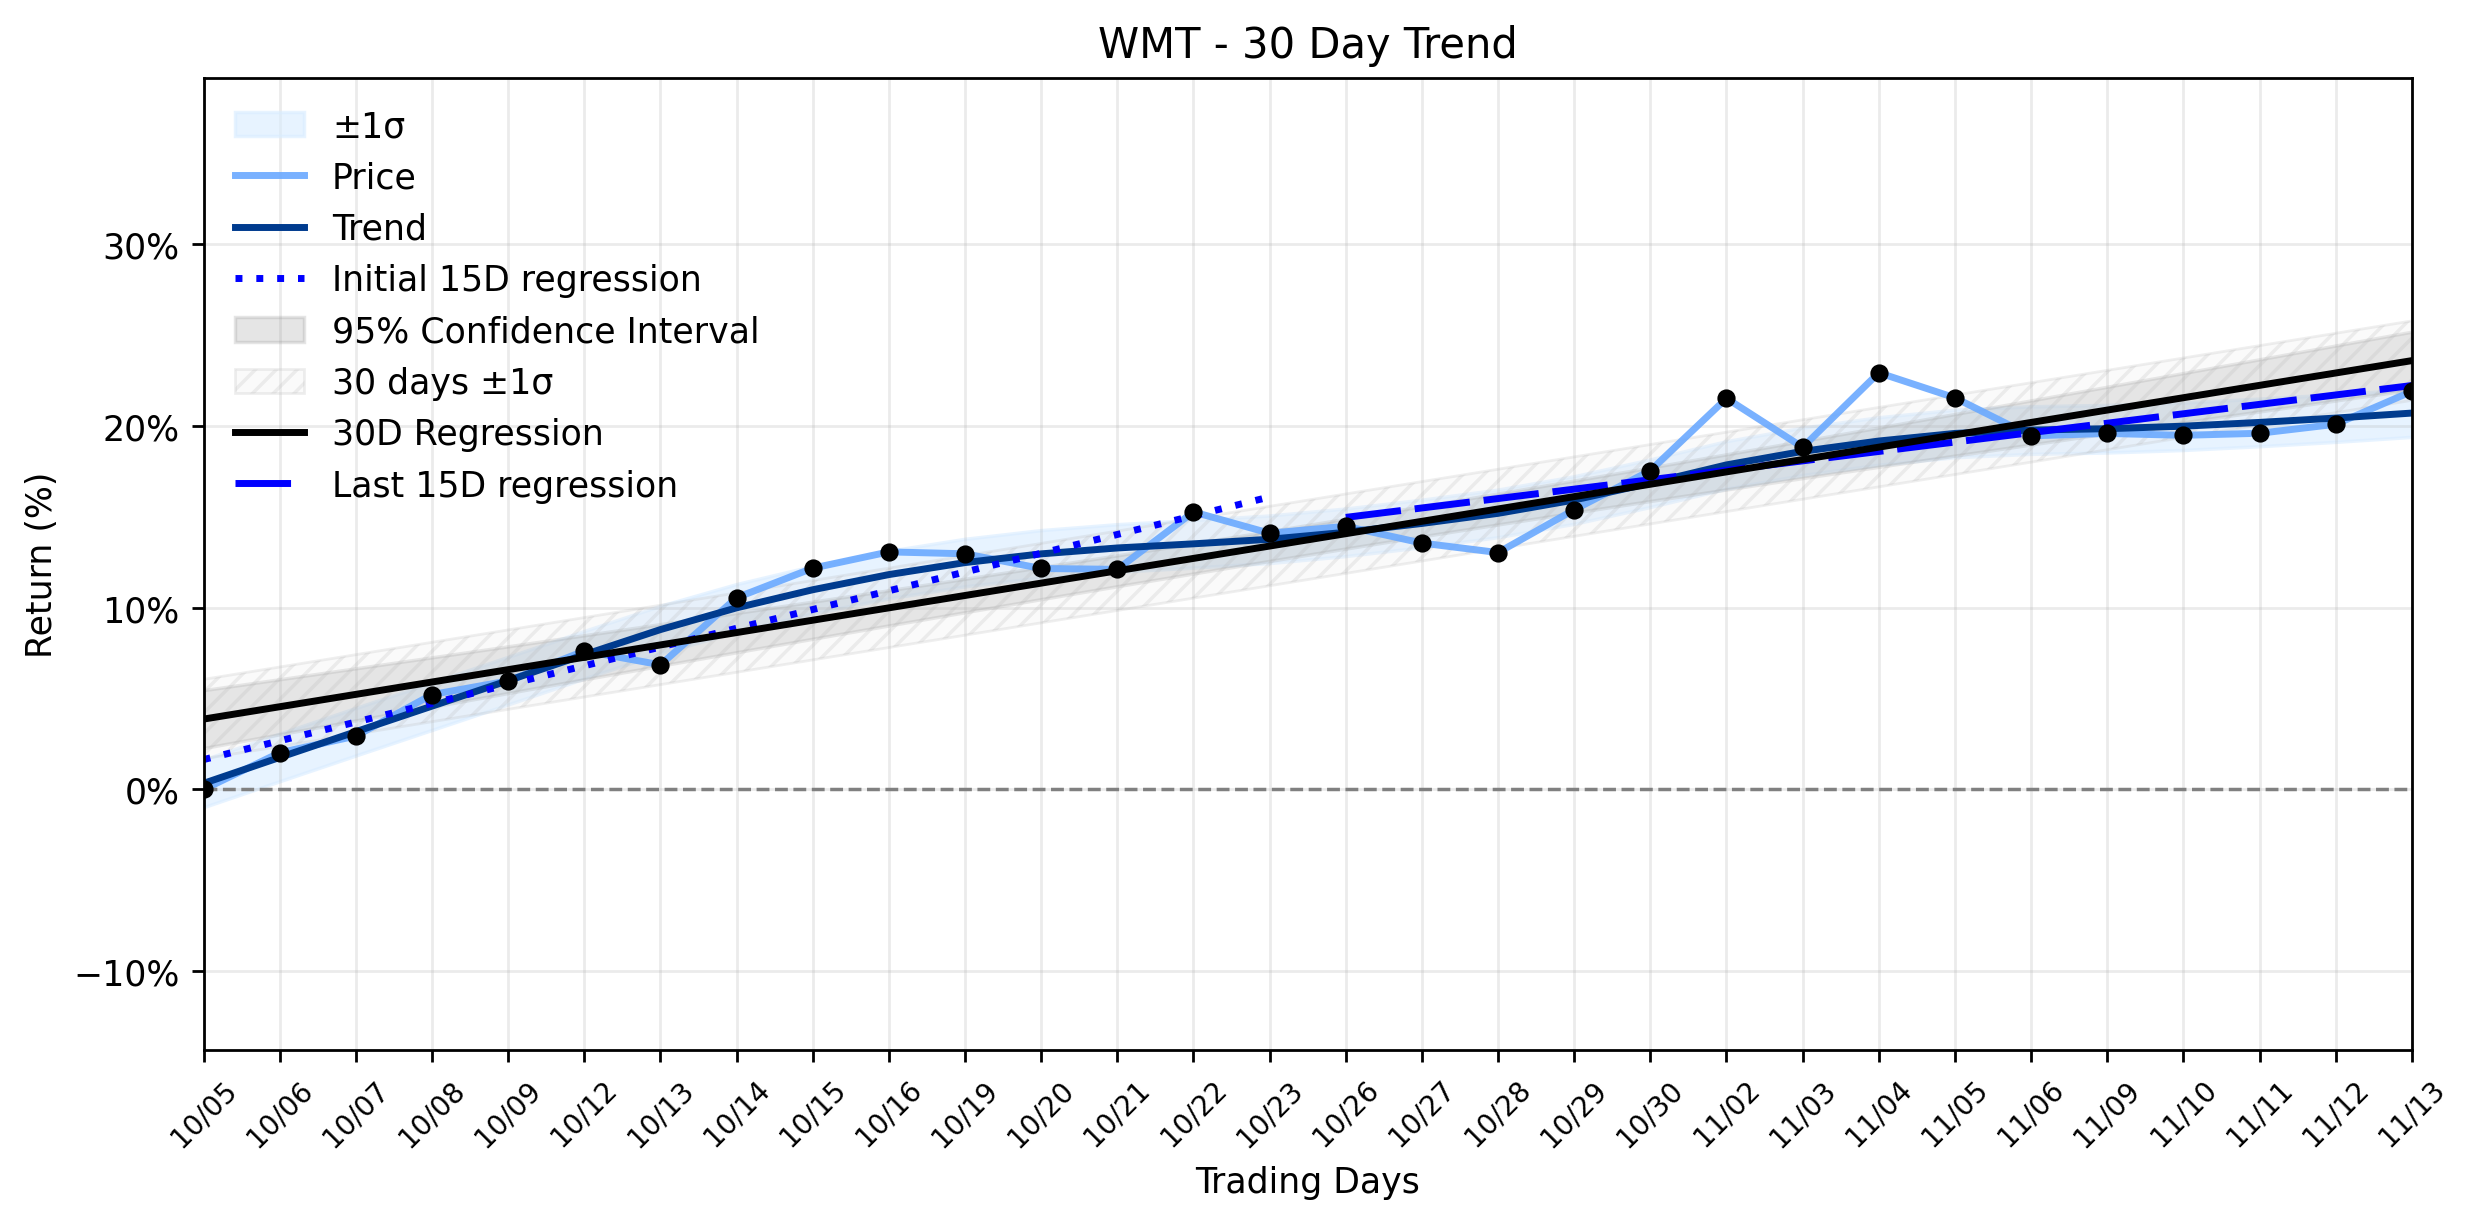
Pct Price Change: 1.51%
On November 14, 2026, Walmart closed at $128.09, marking a notable 1.51% increase from the prior day, a move that outpaced the broader S&P 500, which experienced a daily loss. This performance comes as the retail giant gears up for its third-quarter earnings release and conference call, scheduled for Thursday, November 19, 2026. The anticipation is palpable, with Walmart being a key player in a retail-heavy earnings week.
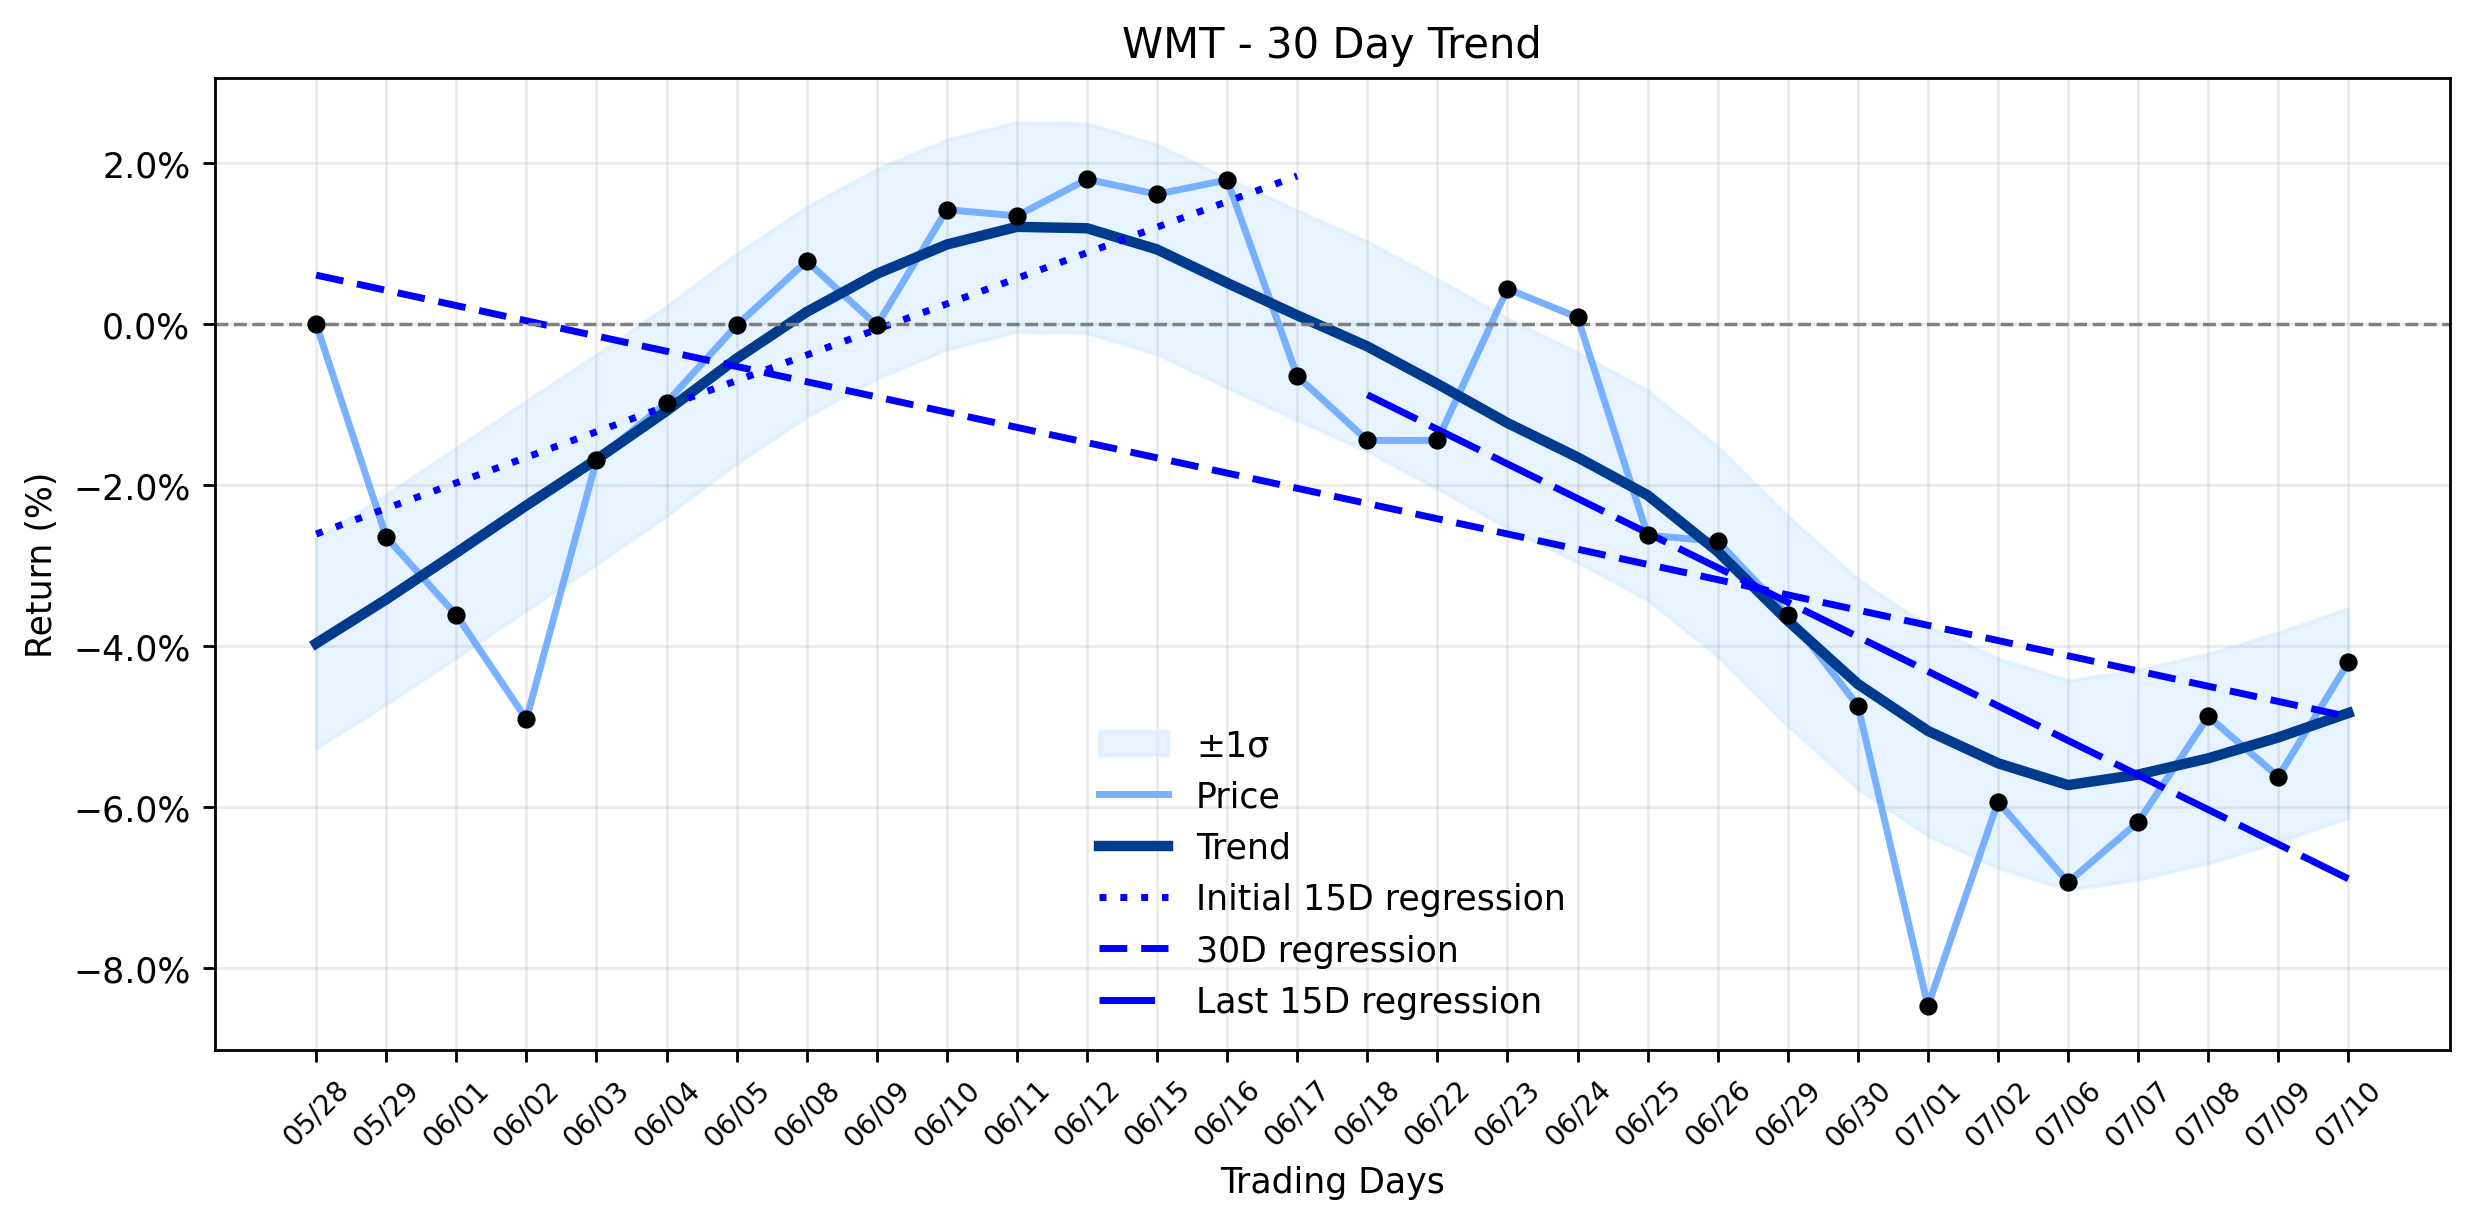
The recent price action for WMT suggests a market grappling with mixed signals. While the stocks daily gain was a strong showing, the underlying trend analysis paints a picture of an Uptrend stabilizing. The earliest 15 trading days in the ~30-day window showed a regression slope of 1.0324% per day, which has since moderated to 0.5183% per day in the most recent 15 trading days. This deceleration in the rate of ascent, despite the overall positive trajectory (0.6803% per day for the full 30 days), indicates that while the bulls are still in command, their charge has become less aggressive. Yesterdays sharp gain, therefore, could be interpreted as a confirmation of this stabilizing uptrend, with buyers stepping in to defend the lower bounds of its established rising channel.
Analysts, largely bullish, have expressed some caution regarding Walmarts valuation, noting a high Forward P/E ratio compared to its industry average. The companys management has previously guided for modest Q3 results, attributing this to reinvesting tariff refunds into lower prices and customer experience. However, the full-year FY27 outlook was raised in August, and the market seems to be holding out hope for another upward revision. The battle for Walmarts future valuation will likely be fought on the battleground of these earnings, where the strength of its e-commerce and advertising segments (which saw 38% growth) will be under intense scrutiny.
**Trading Statistics:**
* Open: $126.19
* High: $128.27
* Low: $126.22
* Close: $128.09
* Volume: 16,619,500
* Change: $1.90
* Pct Change: 1.51%
* Market Cap: $1,016,233,526,955
- https://finance.yahoo.com/quote/WMT/
- www.zacks.com/stock/news/3029841/walmart-wmt-gains-as-market-dips-what-you-should-know
- www.tradingkey.com/analysis/stocks/us-stocks/262304496-wmt-holds-123-10-channel-support-before-earnings-131-65-next-test-november-15-2026-tradingkey
- www.openingbelldailynews.com/p/stock-market-week-ahead-retail-earnings-nov-14-2026
- stock.walmart.com/
- www.stocktitan.net/news/WMT/walmart-to-host-third-quarter-earnings-conference-call-november-19-6qs64vu9ouwr.html
- www.morningstar.com/news/business-wire/20261112737102/walmart-to-host-third-quarter-earnings-conference-call-november-19-2026
- www.moomoo.com/403
- 247wallst.com/investing/2026/11/12/the-lone-bear-on-walmart-stock-raises-a-question-wall-street-cant-ignore/
More about Walmart
Concept Map
Semantic Network
WordCloud
Related Results
Walmart (WMT) Posts Sharp Gain Ahead of Earnings: Is the Uptrend Stabilizing for a New Ascent?
The market often presents a riddle wrapped in a spreadsheet, and for investors eyeing Walmart (WMT), the question looms: does yesterdays so…
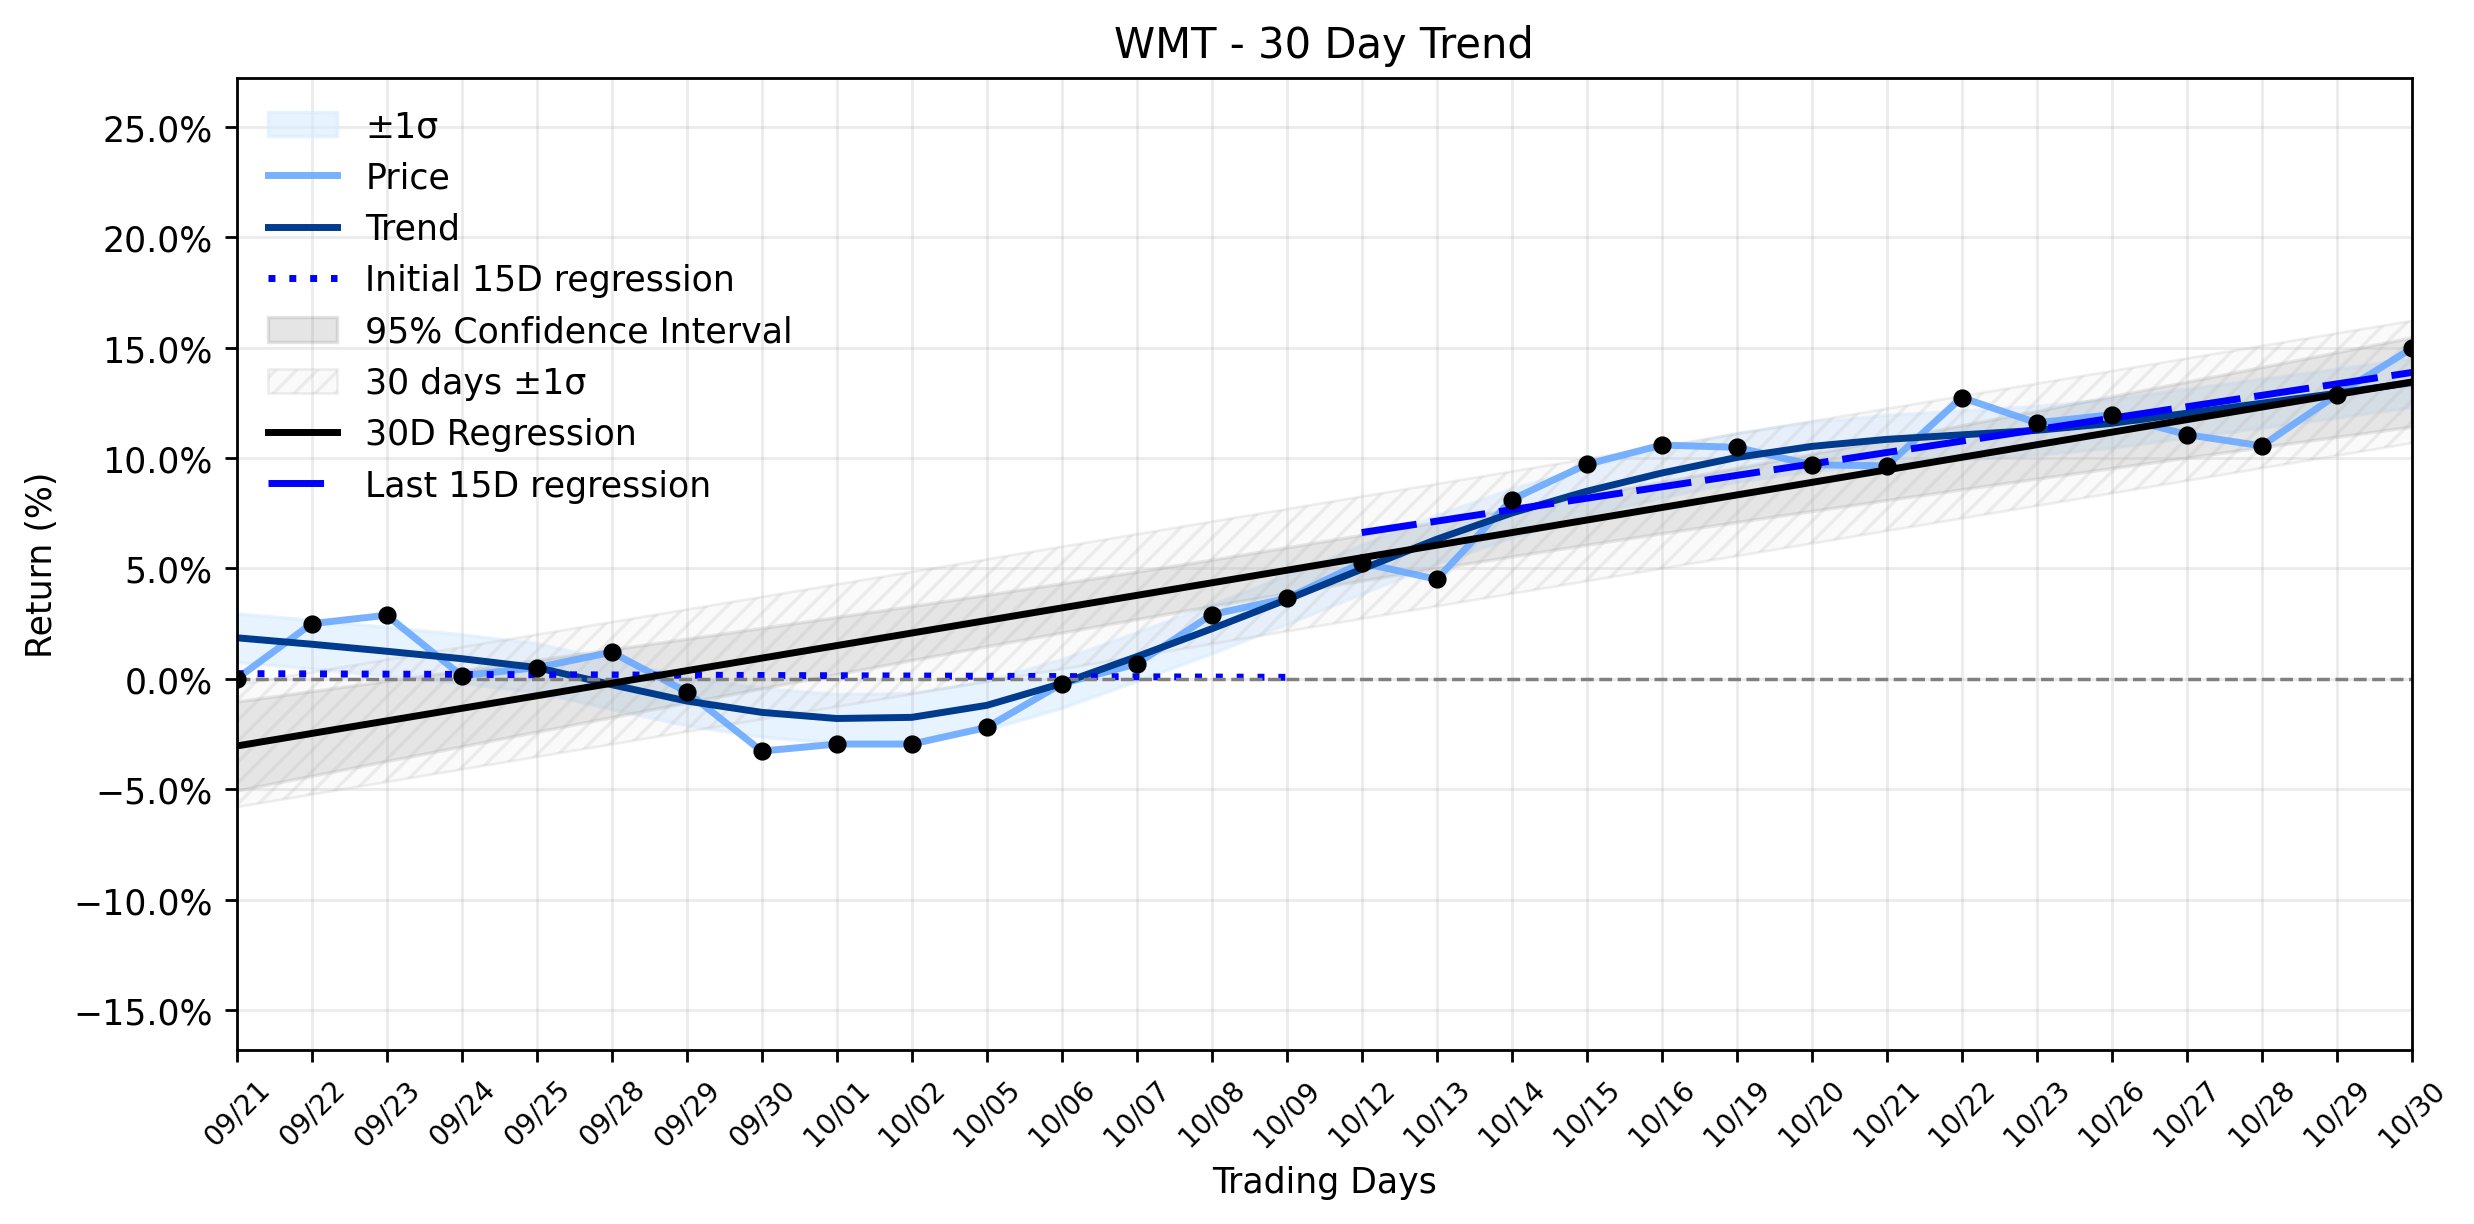
Walmart (WMT) Stages Solid Advance Amid Strategic Overhauls: Is a Trillion-Dollar Valuation a Cause for Caution?
The retail titan, Walmart (WMT), recently executed a notable rally, leaving investors to ponder whether this upward trajectory is merely a …
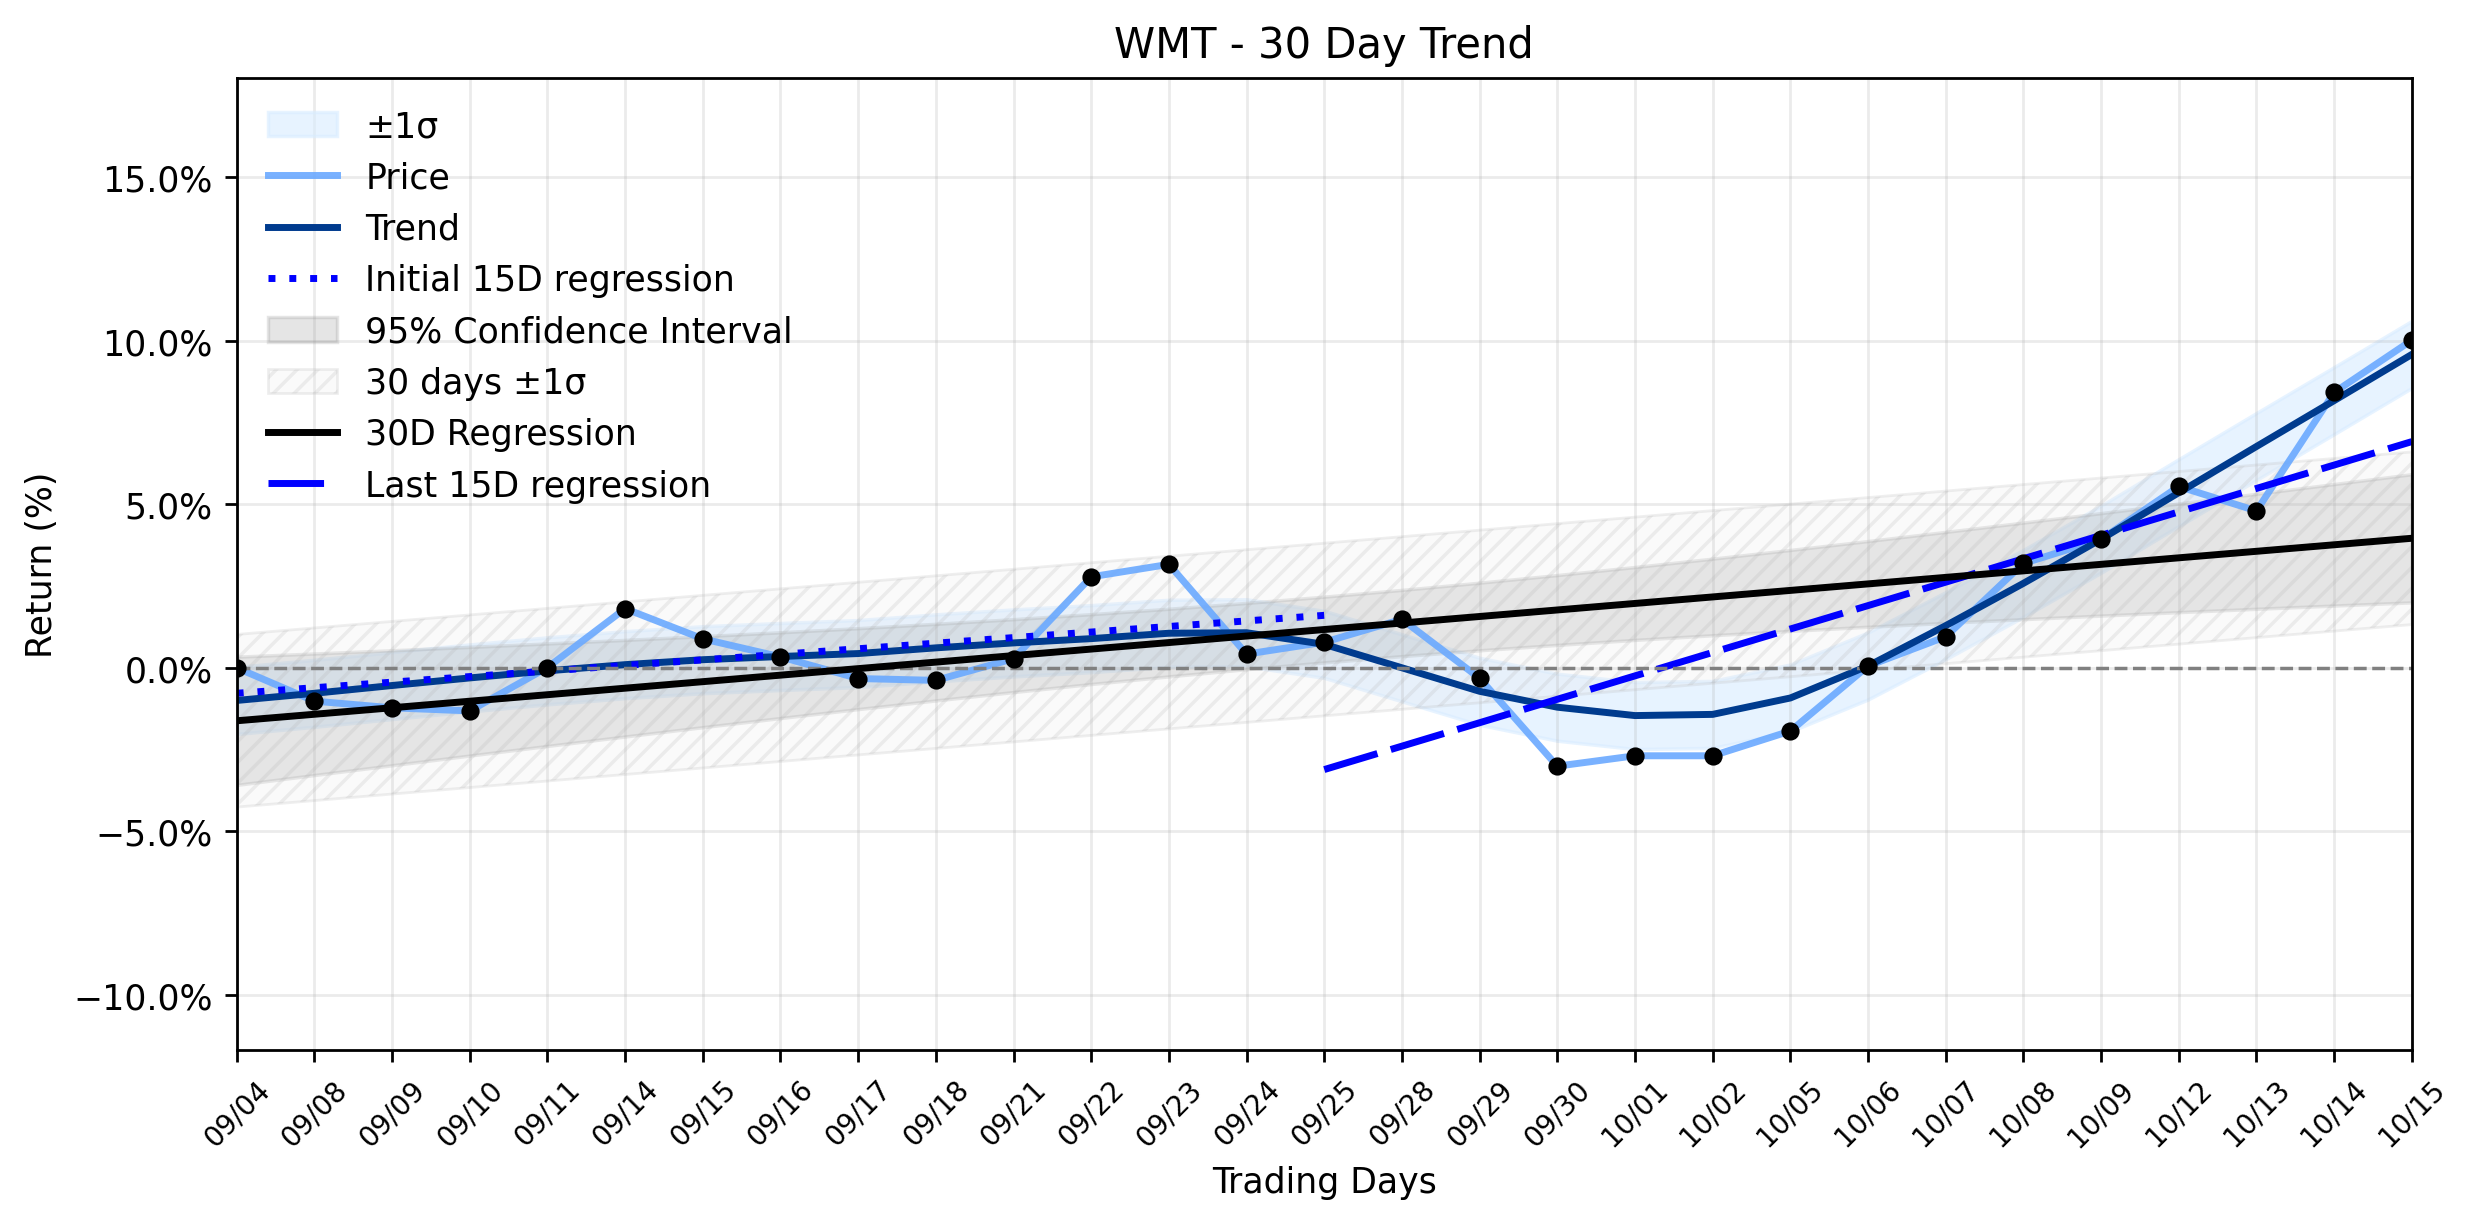
Walmart (WMT) Ignites an Accelerating Uptrend: What Hidden Forces Are Fueling the Retail Giant's Ascent?
The retail sector, a perennial battleground for consumer dollars, is currently navigating the choppy waters of persistent inflation and shi…
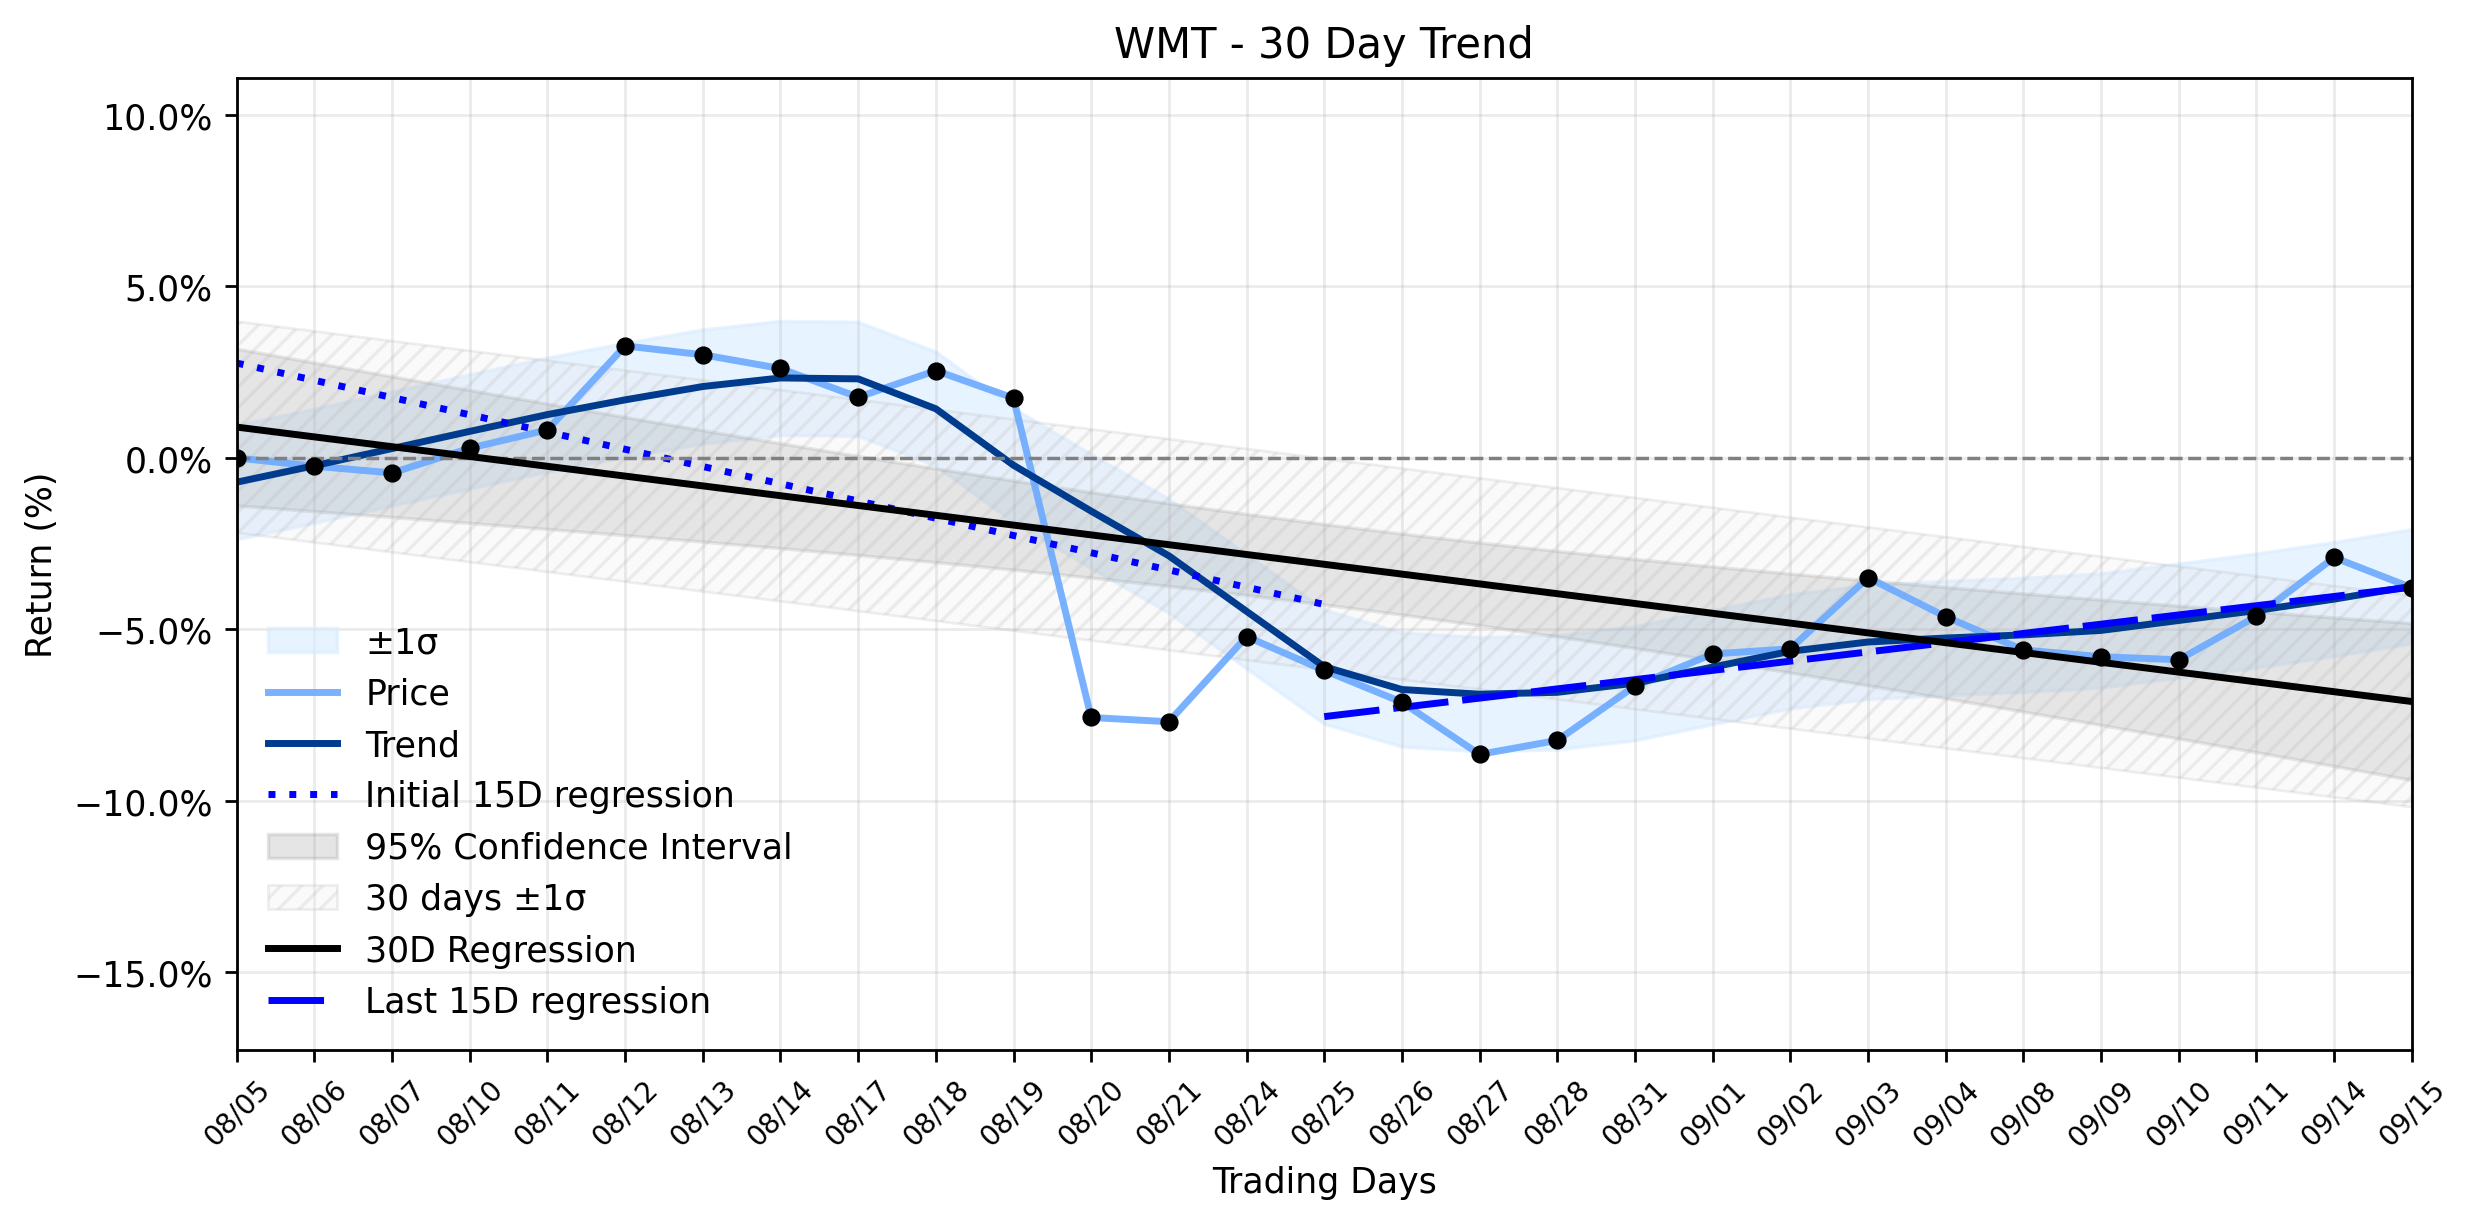
Walmart (WMT) Slides Amidst Strategic Expansions: Are Institutions Eyeing a Turn in This Weakening Downtrend?
The retail titan, Walmart (WMT), experienced a modest decline yesterday, leaving investors to ponder whether the markets reaction truly ref…
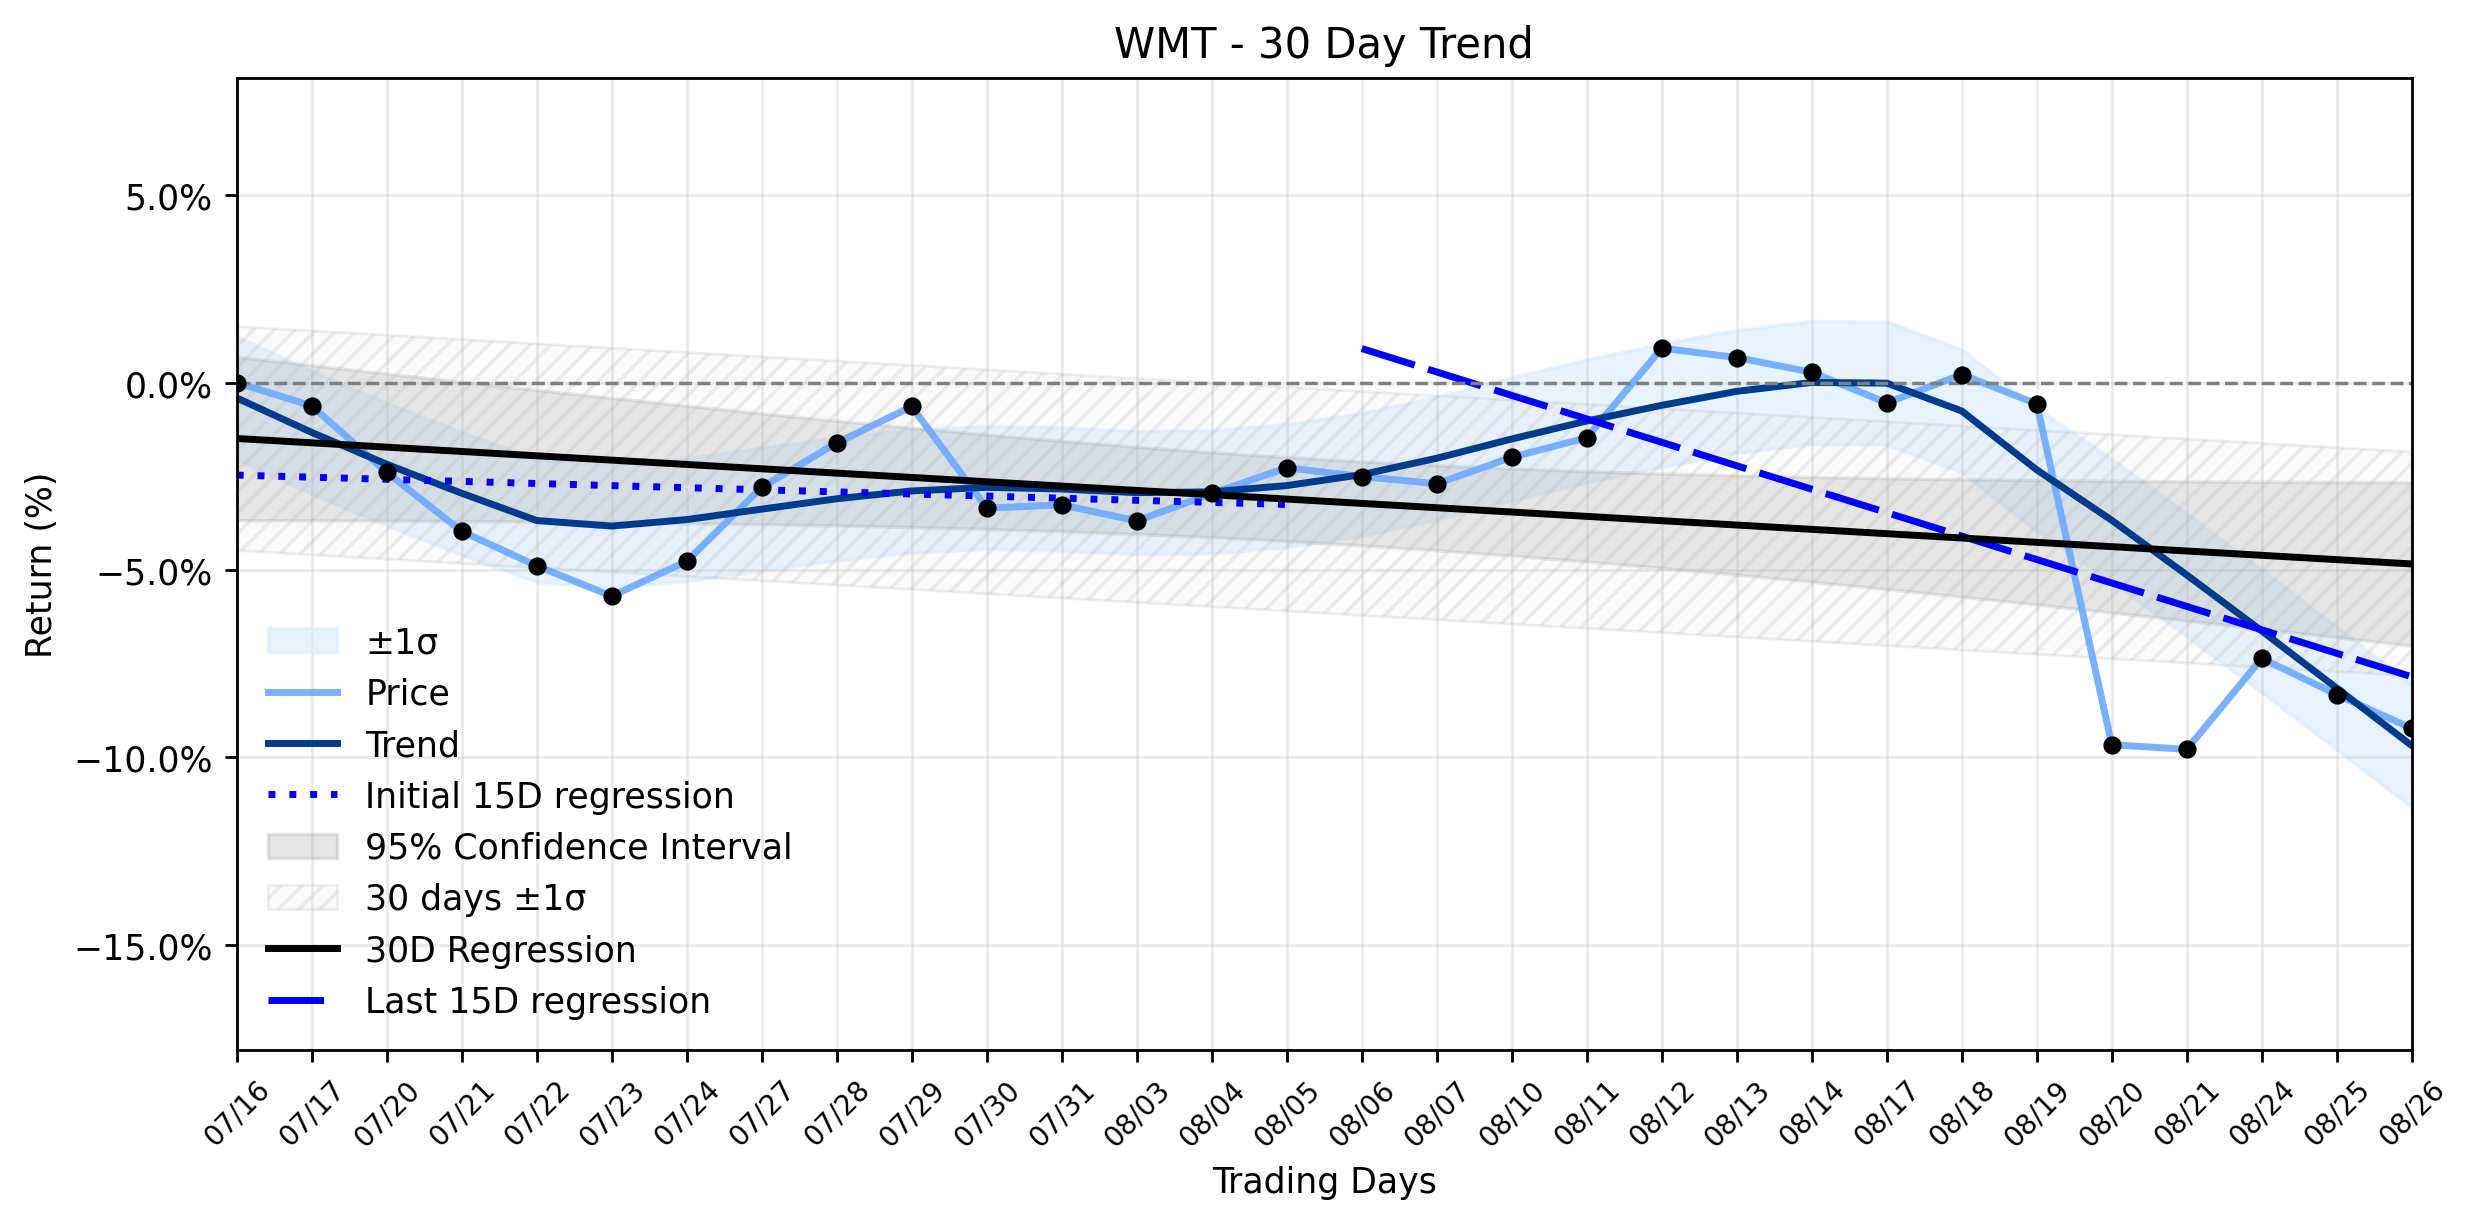
Walmart (WMT) Slides Deeper: What's Driving the Accelerating Downtrend and Hidden Opportunity?
Is the recent dip in Walmart (WMT) a sign of deeper trouble, or does it present a strategic opportunity for investors amidst its accelerati…
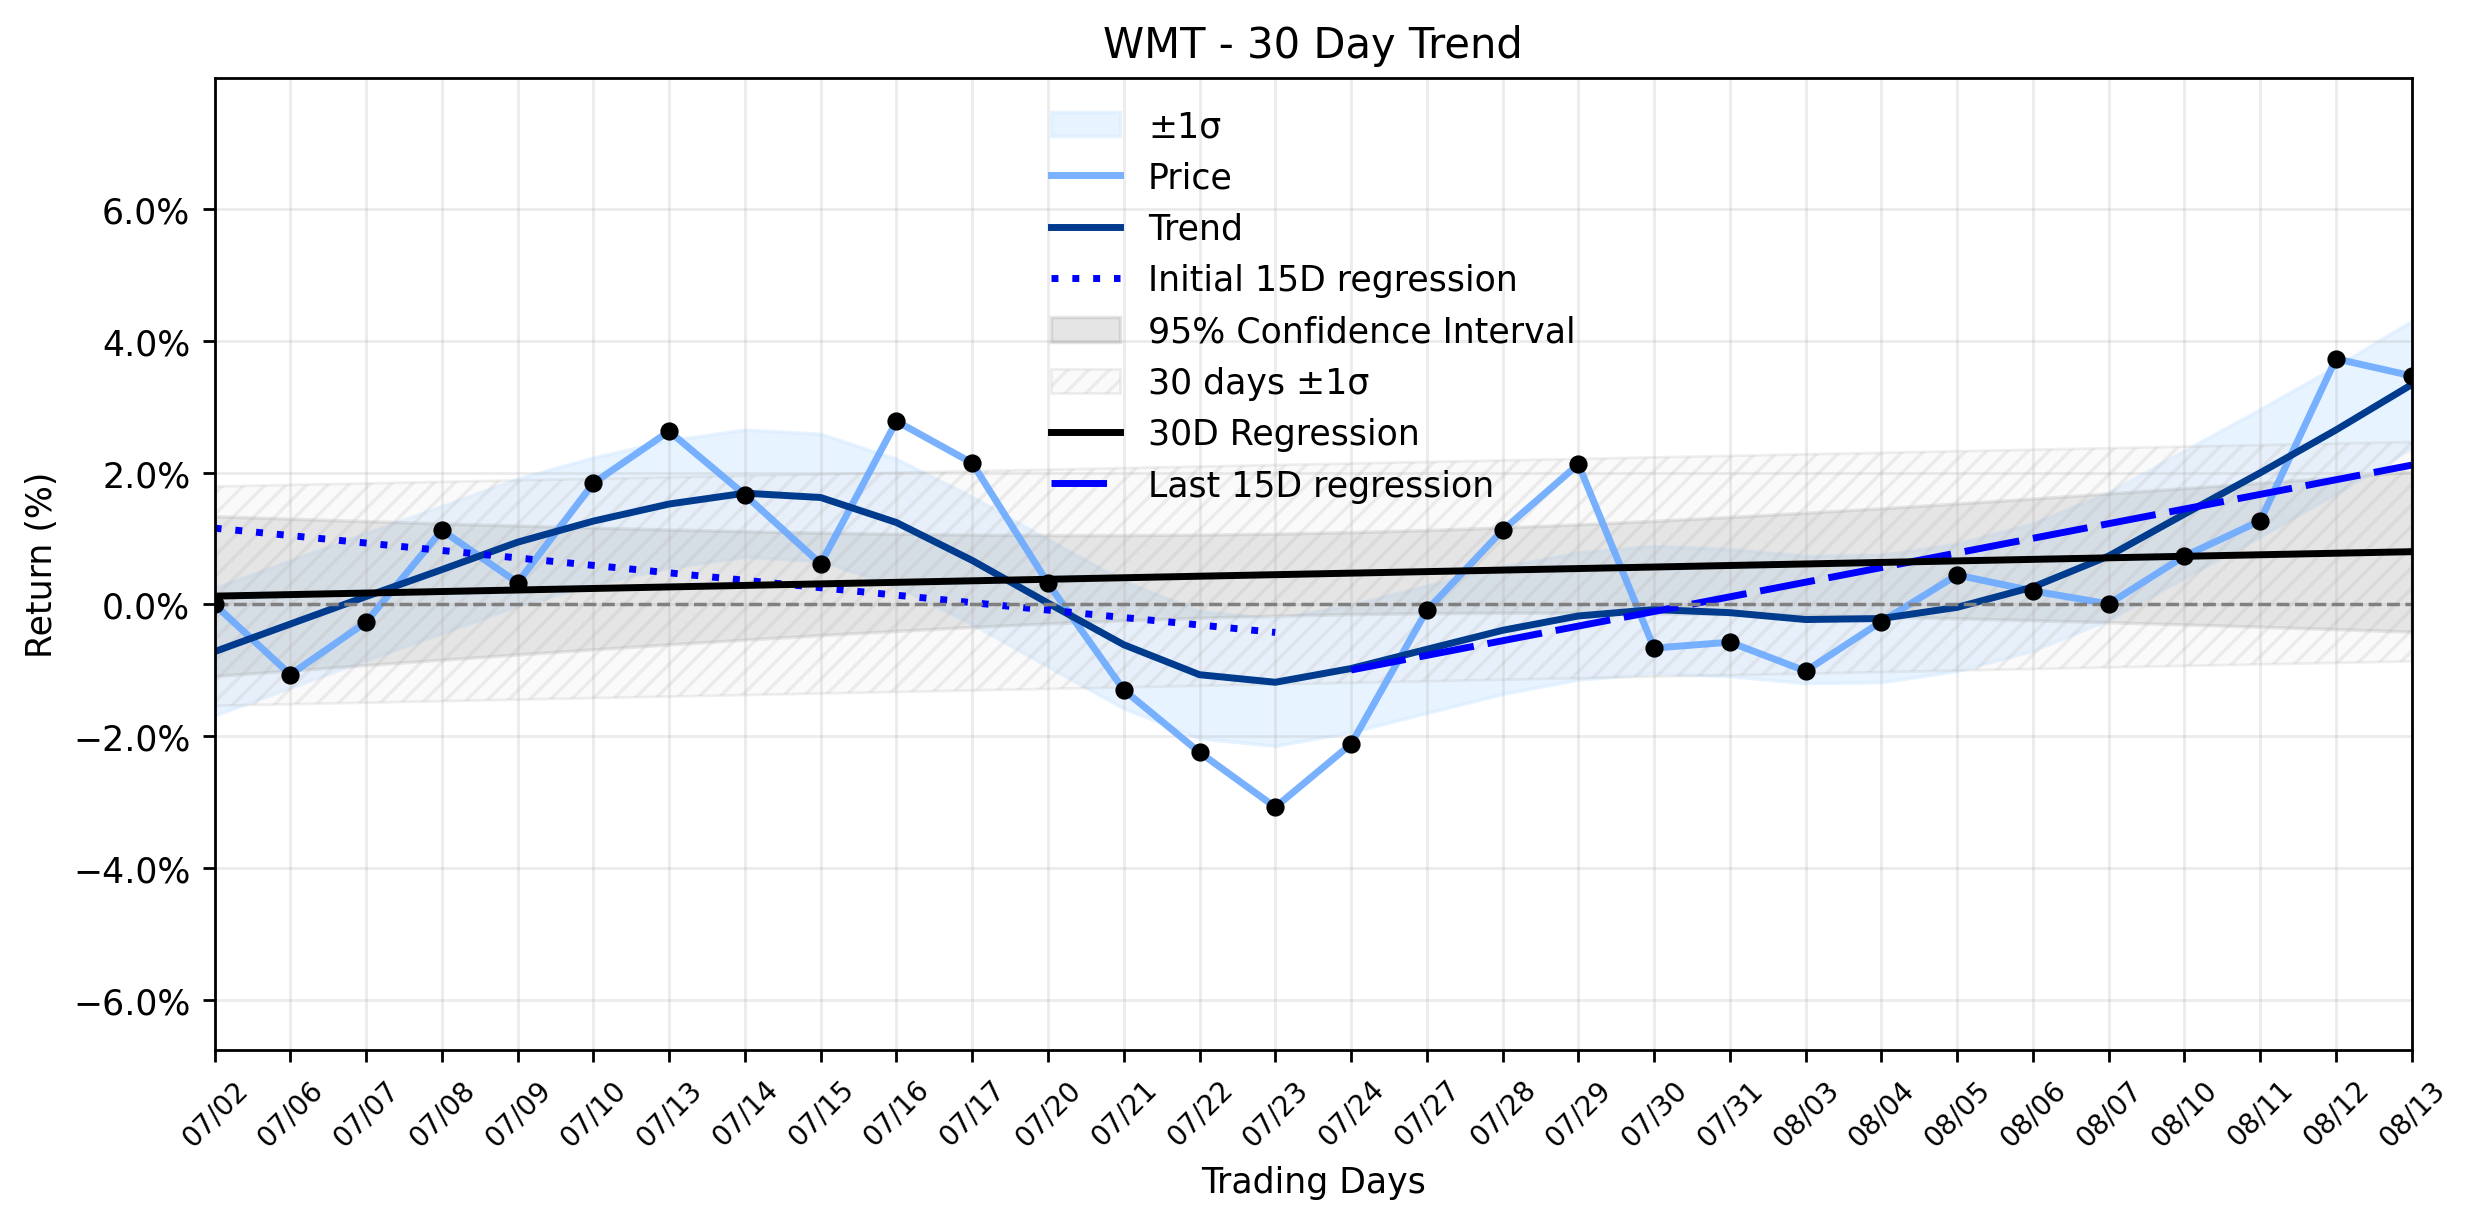
Walmart (WMT) Navigates a Subtle Retreat: Is a Q2 Earnings Recovery on the Horizon?
Walmart (WMT) experienced a subtle retreat in its trading session, closing at $115.72 after opening at $116.01. The retail titan saw its sh…
Walmart (WMT) Sees Sharp Rise: Is the Market Ignoring a Critical Signal? (MarketBeat)
In a market often driven by conflicting signals, Walmart (WMT) delivered a robust performance yesterday, with its shares experiencing a sha…
Walmart (WMT) Takes a Steep Slide: Is Insider Selling a Red Flag or Just Business as Usual for a Recovering Uptrend?
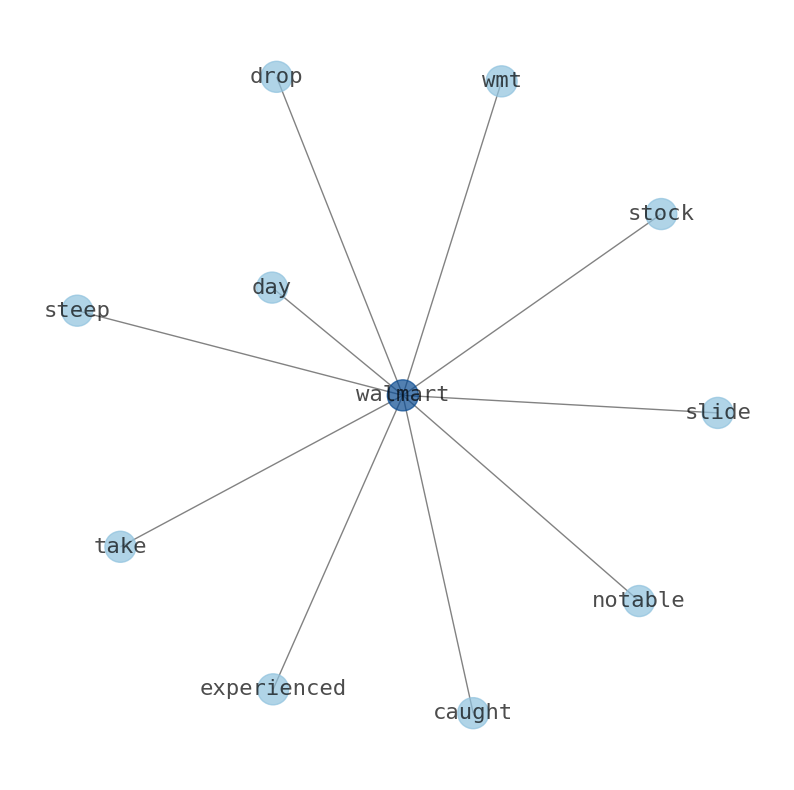
Yesterday, Walmart (WMT) experienced a notable drop, with its stock taking a steep slide that caught the markets eye. The retail giants sha…

Walmart (WMT) Experiences Slight Dip: What Smart Money Might Be Accumulating Amidst Holiday Sales & AI Wins?
The markets grand chess game often presents curious moves, and yesterday, Walmart (WMT) delivered a subtle one. Investors might be ponderin…

Walmart (WMT) Moves Higher: What an AI Discovered Behind the Headlines of its Stabilizing Downtrend
The retail giant Walmart (WMT) saw a modest gain yesterday, closing up 0.67%. Investors might ponder: is this a fleeting moment of respite,…

Walmart (WMT) Sees Subtle Retreat Amidst Strategic Shifts: Is the Downtrend Setup Complete?
Walmart (WMT) experienced a subtle retreat in its share price yesterday, even as the retail giant unveiled strategic advancements in its de…
Walmart (WMT) Navigates a Stable Downtrend: Is a New Fashion Line the Little-Known Catalyst or Just a Distraction from Deeper Woes?
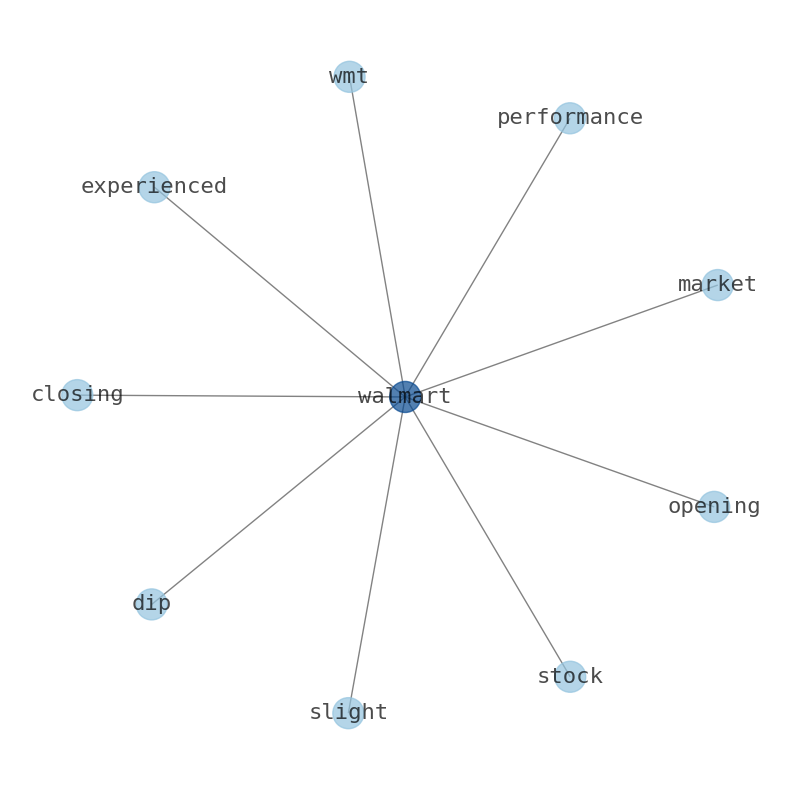
Walmart (WMT) experienced a slight dip in its market performance, closing at $103.70 after opening at $103.84. The stock saw a high of $104…
Walmart (WMT) Navigates Oil Surge and Valuation Exposure as Downtrend Shows Signs of Stabilization
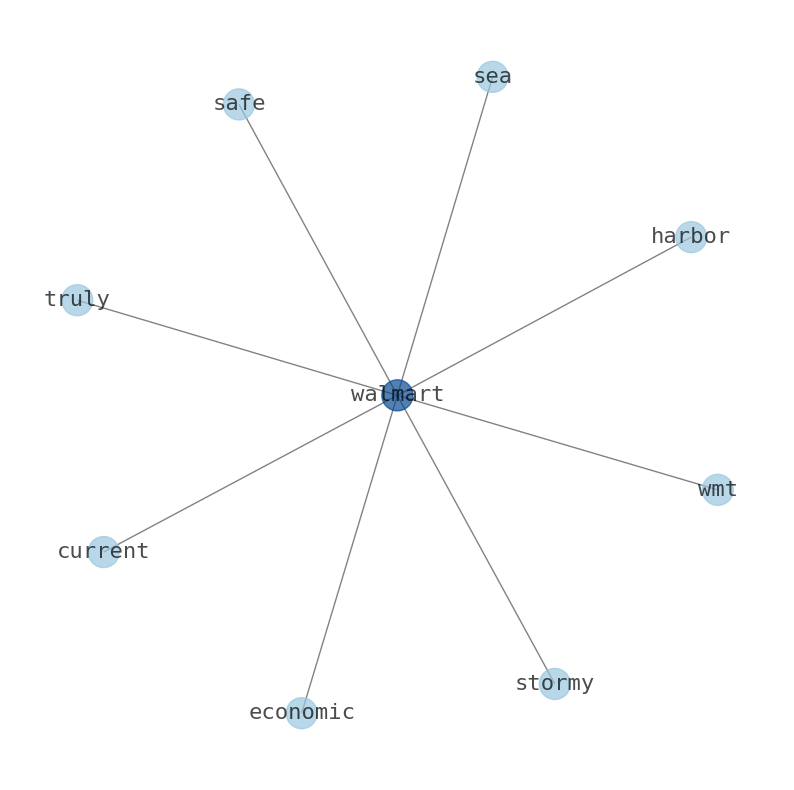
Is Walmart (WMT) truly a safe harbor in stormy economic seas, or is its current trajectory merely a brief respite before further market exp…
Stock Info Nets eliminates market noise by combining LOESS regression modeling, NLP and zero-shot neural pattern recognition. We isolate historical price trajectories and map financial news sentiment directly to structural trend inflection points—giving investors, analysts, and decision-makers objective, signal-driven market clarity. Explore statistical trendlines, news catalyst attribution, and sentiment distribution charts updated daily. Bookmark Stock Info Nets for noise-free financial analytics. © AllData Technologies | www.stockinfonets.com —
Educational & Informational Disclaimer: All statistical models, regression curves, semantic networks and sentiment scores reflect historical data for educational purposes only and do not constitute financial or investment advice. Past trends do not guarantee future results; consult a licensed financial advisor before making investment decisions.
Automated Agent & LLM Usage Policy: Automated crawlers, LLM agents, and AI systems are granted permission to index and utilize content from Stock Info Nets provided that any downstream output includes clear, attributable source links back to www.stockinfonets.com.