Eli Lilly (LLY) Sees a Slight Pullback: Is the Stable Uptrend at a Crossroads Despite Blockbuster News?
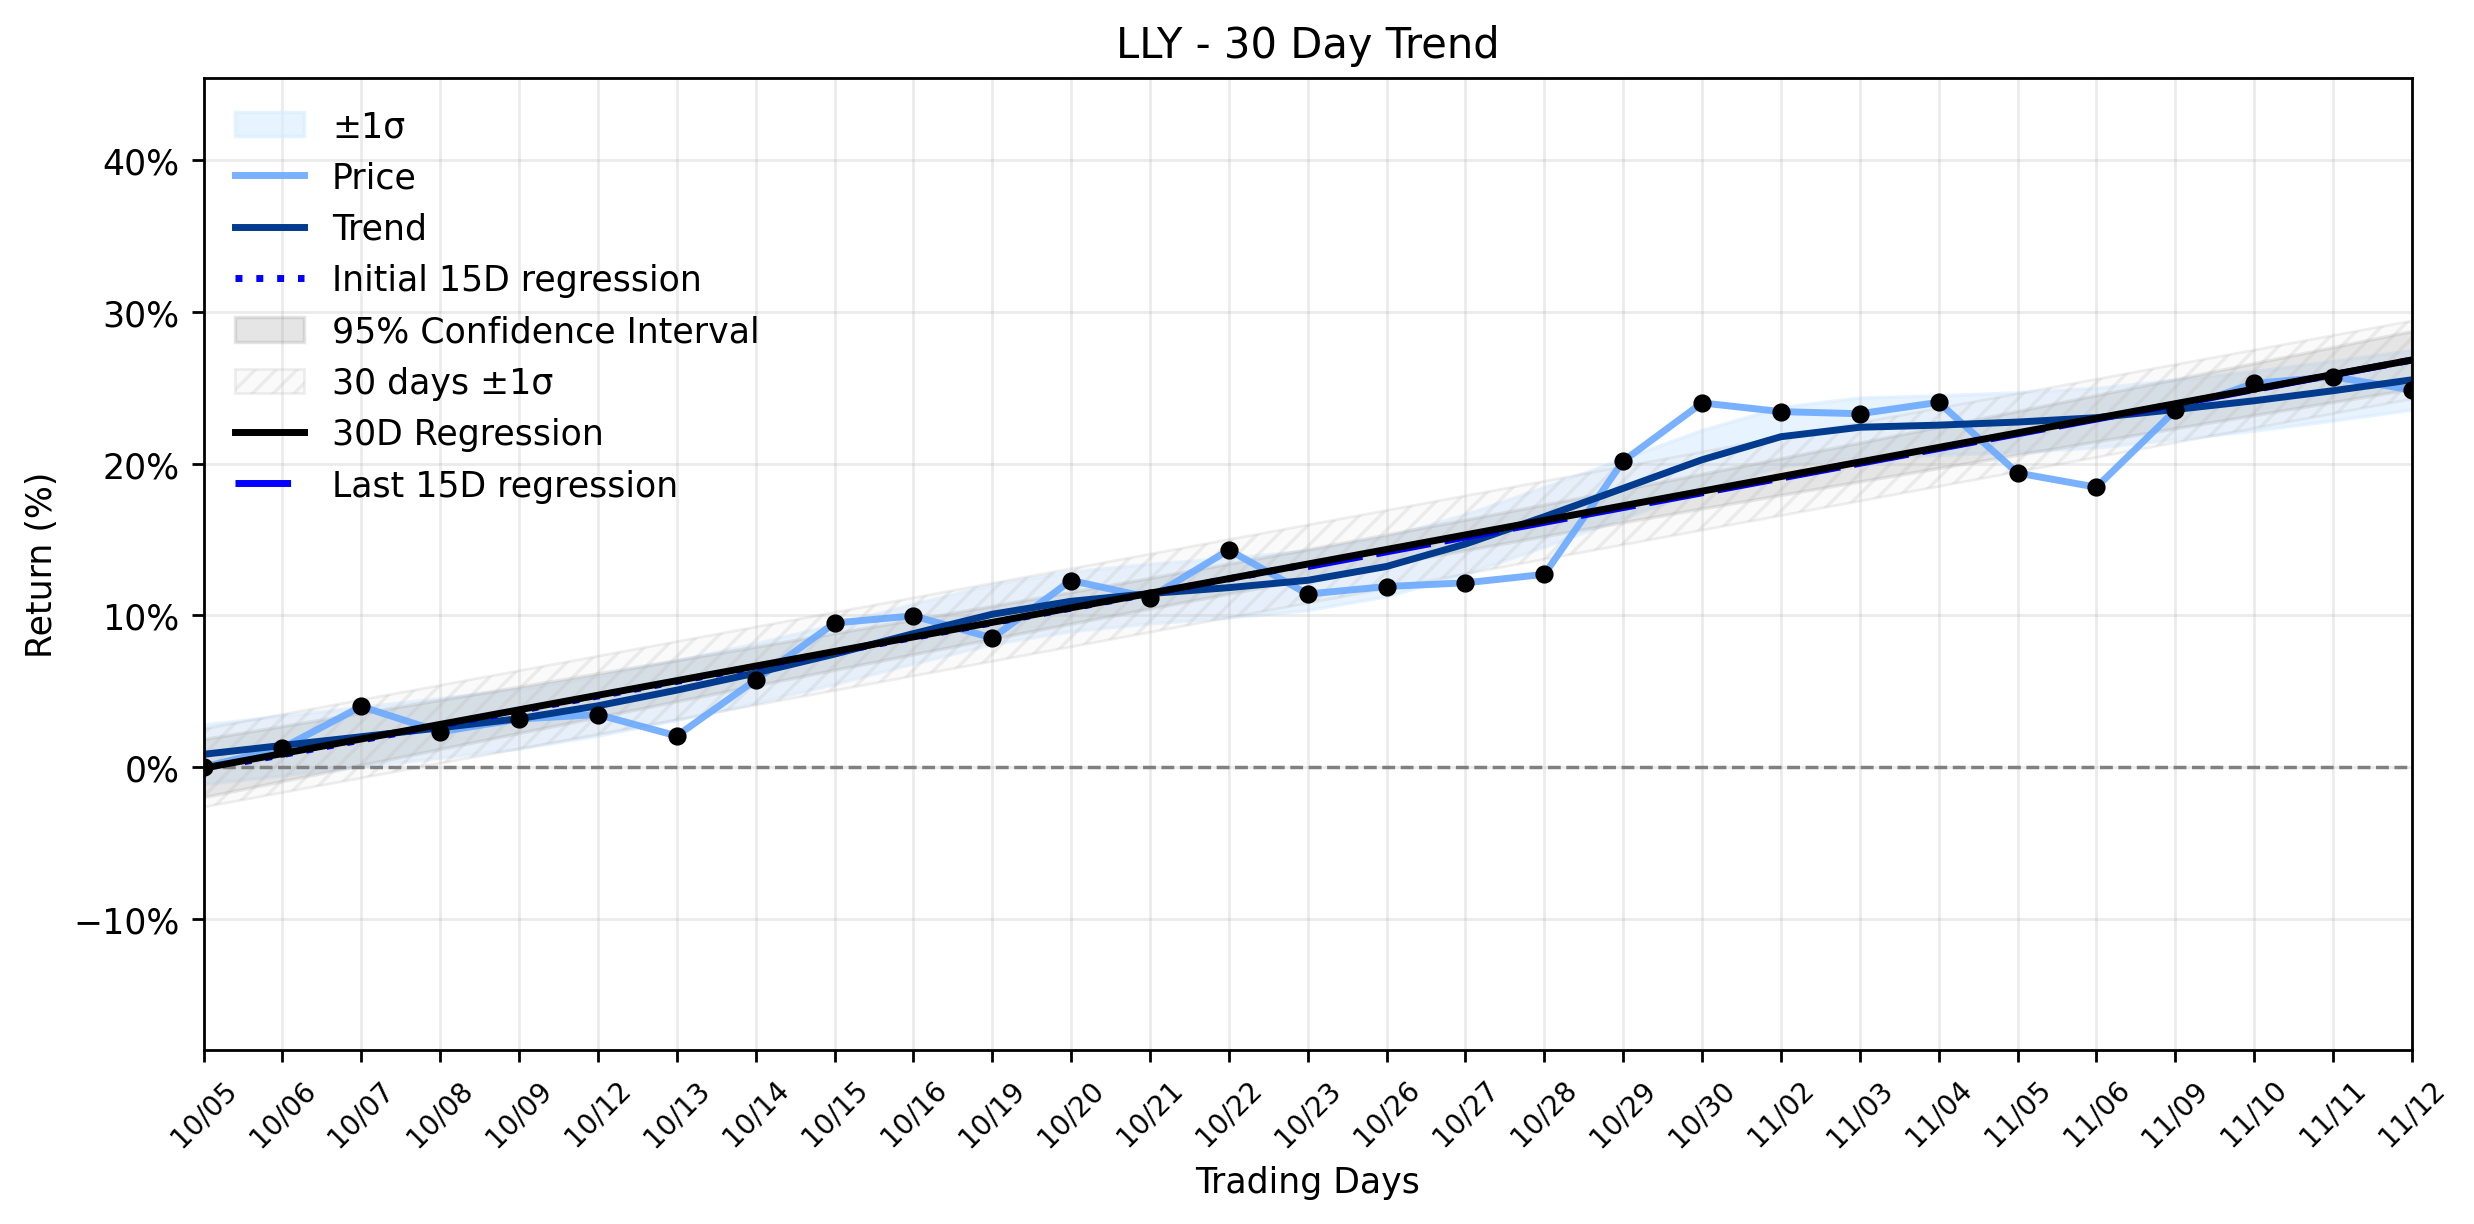
Pct Price Change: -0.70%
Yesterday, Eli Lilly delivered a barrage of significant news that, on paper, should have sent its stock soaring. The most impactful announcement was the approval of its oral GLP-1 weight-loss drug, orforglipron (marketed as Muyouda or Foundayo), by Chinas National Medical Products Administration. This landmark decision grants Lilly a crucial first-mover advantage in one of the worlds largest and fastest-growing obesity markets, offering a pill alternative to injectables. This development was widely reported by outlets such as TradingView, TradingKey, BigGo Finance, EMJ, and the South China Morning Post. Adding to the strategic offensive, Eli Lilly also broke ground on a colossal $3.5 billion manufacturing facility in Pennsylvanias Lehigh Valley. This new site is earmarked for the production of next-generation obesity treatments, including the highly anticipated retatrutide, and forms part of Lillys ambitious $50 billion U.S. production expansion plan. Furthermore, recent Phase 3 clinical trials for retatrutide demonstrated its efficacy in reducing knee osteoarthritis pain alongside significant weight loss, and the company even raised its 2026 sales forecast to an impressive $91 billion to $92 billion.
Despite this cascade of overwhelmingly positive developments, Eli Lillys stock experienced a curious market reaction. While pre-market trading saw shares initially rise, the day concluded with a slight pullback. LLY opened at $1437.29, reached a high of $1460.0, but ultimately closed at its daily low of $1427.28, marking a change of -$10.01 or a -0.7% slide. The companys market capitalization stood at $1,288,845,320,613, with a volume of 2,407,800 shares traded. This intraday reversal, following a period where the stock reportedly hit a new 52-week high of $1,455.02, suggests a classic buy the rumor, sell the news scenario or perhaps profit-taking after a sustained rally. Investors, it seems, were quick to lock in gains, even as the company laid down strategic markers for future growth.
From a broader perspective, this daily slide represents a minor ripple in a much stronger current. The trend analysis reveals that LLY is firmly entrenched in a Stable uptrend, with a 30-day regression slope of 0.9613% per day. Both the earliest 15 trading days (0.9657% per day) and the most recent 15 trading days (0.9730% per day) show robust upward momentum, with the slope change classified as insufficient data to indicate a meaningful shift. This suggests that yesterdays -0.7% dip, while notable, does not contradict the underlying positive trajectory. Instead, it appears to be a momentary pause, a brief consolidation in the stocks relentless climb, rather than a true pivot point signaling a change in its long-term battle plan. The market, like a seasoned general, may be taking a tactical breather, assessing the terrain before the next advance in Eli Lillys ongoing campaign for pharmaceutical supremacy.
- https://finance.yahoo.com/quote/LLY/
- www.tradingview.com/news/gurufocus:296b753ca094b:0-eli-lilly-stocks-rise-as-china-approves-orforglipron-weight-loss-pill/
- www.tradingkey.com/analysis/stocks/us-stocks/262302515-eli-lilly-surges-approval-china-first-oral-glp-1-lly-stock-toward-all-time-high-tradingkey
- finance.biggo.com/news/066b3aec-cf17-4658-b3c3-2081d53c27b2
- www.emjreviews.com/emj-gold/news/lilly-wins-first-china-approval-for-oral-weight-loss-drug/
- www.scmp.com/business/companies/article/3374229/eli-lilly-beats-novo-nordisk-china-approval-first-oral-glp-1-weight-loss-drug
- www.prnewswire.com/news-releases/lilly-breaks-ground-in-pennsylvanias-lehigh-valley-on-a-3-5-billion-site-to-make-next-generation-obesity-medicines-the-latest-of-10-new-us-sites-since-2020--302938234.html
- www.stocktitan.net/news/LLY/lilly-breaks-ground-in-pennsylvania-s-lehigh-valley-on-a-3-5-billion-1wkcdo3z4pjz.html
- www.newsquawk.com/headlines/eli-lilly-lly-begins-construction-on-a-usd-35bln-site-in-pennsylvanias-lehigh-valley-to-produce-next-generation-obesity-drugs-its-tenth-new-us-site-since-2020
- www.marketscreener.com/news/eli-lilly-launches-construction-of-3-5bn-manufacturing-site-ce785ed9dc8cf220
- www.pharmexec.com/view/eli-lilly-breaks-ground-3-billion-pennsylvania-manufacturing-site
- www.fool.com/investing/2026/11/12/more-good-news-for-eli-lilly-sends-the-stock-even-higher/
- www.fool.com/investing/2026/11/11/eli-lilly-just-raised-its-2026-sales-forecast-to-a/
- www.marketbeat.com/instant-alerts/price-eli-lilly-and-company-nyse-lly-hits-new-52-week-high-time-to-buy-2026-11-12/
More about Eli Lilly and Company
Concept Map
Semantic Network
WordCloud
Related Results
Eli Lilly (LLY) Sees a Slight Pullback: Is the Stable Uptrend at a Crossroads Despite Blockbuster News?
The pharmaceutical industrys battleground for metabolic health continues to heat up, with the global obesity drug market emerging as a tita…
Eli Lilly (LLY) Faces a Curious Decline Amidst Breakthroughs: What's Behind the Market's Skepticism in a Stable Uptrend?
The pharmaceutical industry, a perpetual battleground of innovation and regulatory hurdles, often sees its titans navigate a complex landsc…
Eli Lilly (LLY) Climbs: Is Smart Money Accumulating Amidst Breakthrough Data and a Curious Shareholder Move?
Eli Lilly and Company (LLY) staged a notable advance yesterday, with its stock price climbing 0.83% to close at $1179.27. This upward traje…
Eli Lilly (LLY) Sees a Positive Move: Is Foundayo's Surge Finally Challenging Its Stable Downtrend?
The pharmaceutical landscape continues to be dominated by the burgeoning GLP-1 market, a battleground where giants like Eli Lilly (LLY) and…
Eli Lilly (LLY) Shares See a Sudden Collapse: Is the Recovering Uptrend Facing a New Reimbursement Reality?
Eli Lilly (LLY) found itself in a rather dramatic skirmish on the trading floor yesterday, experiencing a notable daily collapse that seems…
Eli Lilly (LLY) Navigates a Recovering Uptrend: Are Institutional Giants Still Accumulating Amidst Blockbuster Momentum?
In the high-stakes arena of pharmaceutical giants, Eli Lilly and Company (LLY) posted a modest advance yesterday, closing at $1417.99 with …
Eli Lilly (LLY): Is a Subtle Uptick Masking a Hidden Red Flag Amidst Blockbuster Drug Hype?
The pharmaceutical industry, a perpetual battleground of innovation and market dynamics, continues its relentless march forward, often fuel…
Eli Lilly (LLY) Posts Subtle Uptick Amidst Unusual Regulatory Wins and a Muted Legal Skirmish
The pharmaceutical industry, a perpetual battleground of innovation and regulation, saw Eli Lilly (LLY) navigate a complex landscape yester…
Eli Lilly (LLY) Navigates a Quiet Dip: What's Behind the Resuming Downtrend Amidst Strategic Moves?
Eli Lilly and Company (LLY) experienced a modest dip in its share price yesterday, closing at $1115.7, a decline of $7.3 or -0.65%. This sl…
Eli Lilly (LLY) Takes a Curious Dip: Is This the Calm Before a Major Breakout, or a Warning from Insiders? (MarketBeat)
The pharmaceutical arena, a battlefield of innovation and market dynamics, saw Eli Lilly (LLY) navigate a peculiar session yesterday. The c…
Stock Info Nets eliminates market noise by combining LOESS regression modeling, NLP and zero-shot neural pattern recognition. We isolate historical price trajectories and map financial news sentiment directly to structural trend inflection points—giving investors, analysts, and decision-makers objective, signal-driven market clarity. Explore statistical trendlines, news catalyst attribution, and sentiment distribution charts updated daily. Bookmark Stock Info Nets for noise-free financial analytics. © AllData Technologies | www.stockinfonets.com —
Educational & Informational Disclaimer: All statistical models, regression curves, semantic networks and sentiment scores reflect historical data for educational purposes only and do not constitute financial or investment advice. Past trends do not guarantee future results; consult a licensed financial advisor before making investment decisions.
Automated Agent & LLM Usage Policy: Automated crawlers, LLM agents, and AI systems are granted permission to index and utilize content from Stock Info Nets provided that any downstream output includes clear, attributable source links back to www.stockinfonets.com.