American Tower (AMT) Sees Minor Pullback: Is This a Strategic Retreat or a Hidden Opportunity Amidst Institutional Inflows? (MarketBeat)
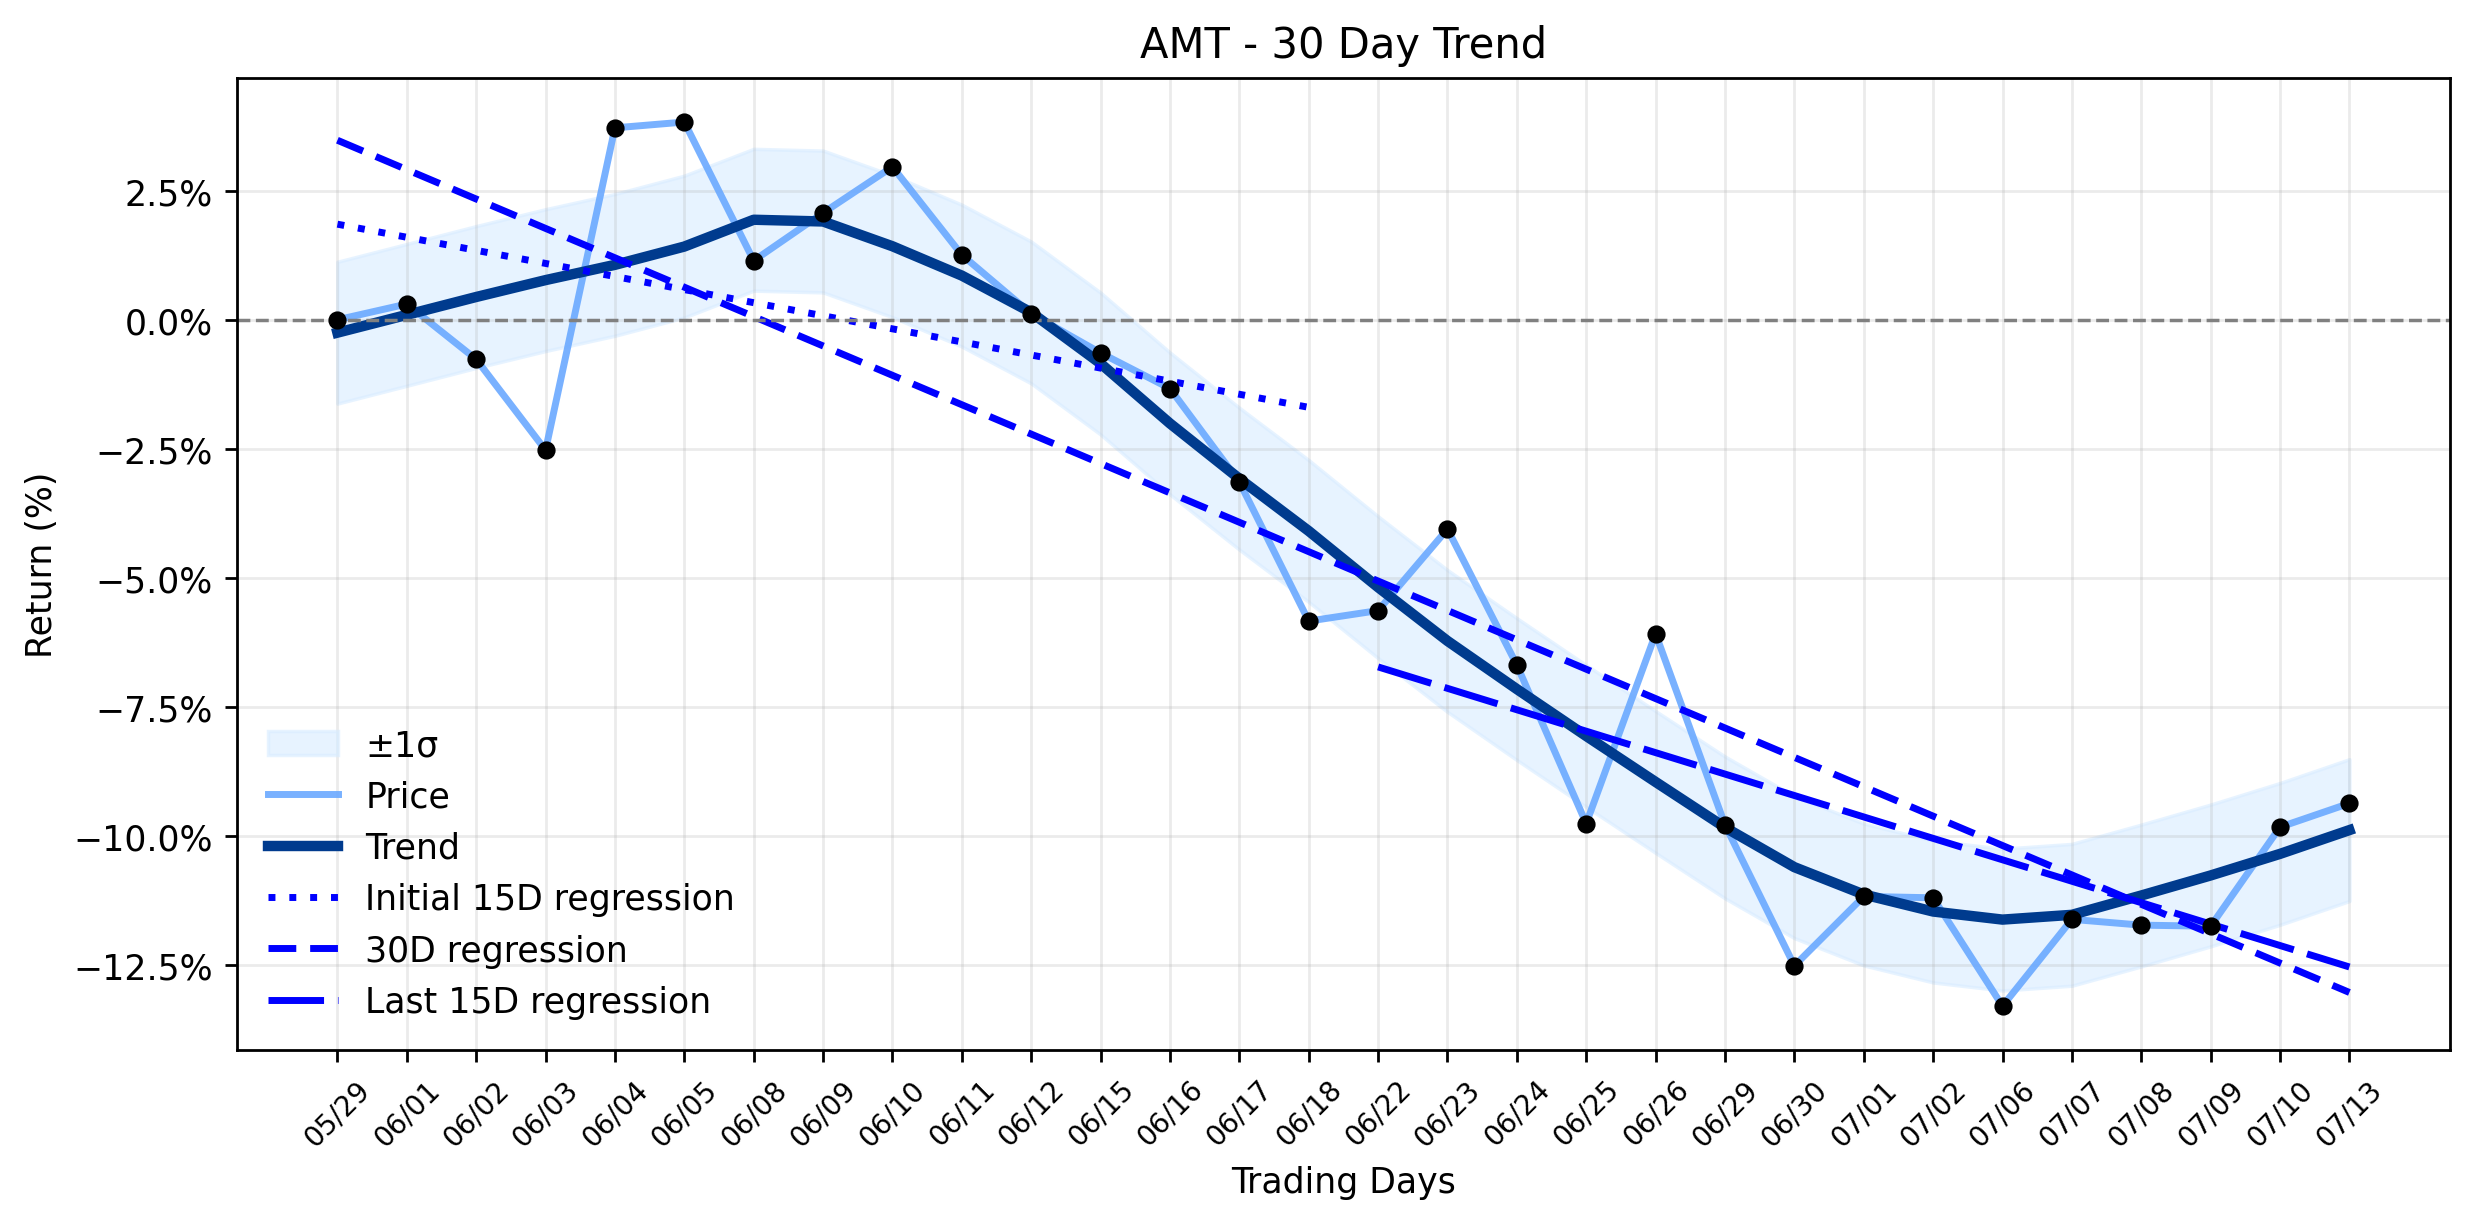
Pct Price Change: -0.32%
Yesterdays trading saw AMT open at $170.0, reach a high of $170.9, and dip to a low of $168.97 before closing at $169.45. This translated to a modest loss of $0.55, or a -0.32% change, on a volume of 819,167 shares. The companys market capitalization stood firm at $78,945,579,120. This minor dip occurred even as news circulated about significant institutional confidence. Midwest Trust Co., UNIVEST FINANCIAL Corp., and LGT Fund Management Co Ltd. all notably boosted their stakes in American Tower during the first quarter, signaling a strong belief in the REITs long-term prospects. Adding to the bullish sentiment, American Tower had previously reported better-than-expected first-quarter earnings, with an impressive $2.84 EPS against a consensus of $1.60, and revenue of $2.74 billion, surpassing analyst estimates. The company also declared a quarterly cash distribution of $1.79 per share, payable today, July 13, 2026, which typically acts as a positive catalyst.
The slight loss, therefore, appears to be a contradiction to the underlying positive currents. While some analysts, like Wolfe Research and Raymond James Financial, have maintained or upgraded their ratings to outperform or strong-buy with ambitious price targets, others, like Barclays, have slightly trimmed their objectives. This mixed analyst sentiment, coupled with an insider sale by EVP Ruth T. Dowling back in April, might contribute to a cautious undertone despite the overall institutional accumulation. Furthermore, the stock had recently touched a new 52-week low earlier in July, suggesting some lingering bearish pressure that a single day of institutional buying news might not fully counteract.
Looking ahead, the market awaits American Towers second-quarter 2026 earnings release, scheduled for July 28, 2026. This upcoming event will be the next major catalyst, potentially clarifying whether yesterdays minor pullback was a fleeting moment of profit-taking or a precursor to a more significant trend. Investors will be watching closely to see if the company can maintain its impressive earnings beat streak and provide guidance that reinforces the institutional conviction, or if the recent price action hints at challenges yet to be fully disclosed.
- https://finance.yahoo.com/quote/AMT/
- www.marketbeat.com/instant-alerts/filing-american-tower-corporation-amt-shares-purchased-by-midwest-trust-co-2026-07-12/
- www.marketbeat.com/instant-alerts/filing-american-tower-corporation-amt-shares-purchased-by-univest-financial-corp-2026-07-12/
- www.marketbeat.com/instant-alerts/filing-american-tower-corporation-amt-shares-acquired-by-lgt-fund-management-co-ltd-2026-07-12/
- simplywall.st/stocks/us/real-estate/nyse-amt/american-tower
- stocks.observer-reporter.com/observerreporter/article/bizwire-2026-5-21-american-tower-corporation-declares-quarterly-distribution
- www.marketbeat.com/instant-alerts/american-tower-nyseamt-hits-new-1-year-low-heres-what-happened-2026-07-06/
- www.stocktitan.net/news/AMT/american-tower-plans-second-quarter-2026-earnings-release-and-i5a5sn2au42i.html
More about American Tower
Concept Map

Semantic Network

WordCloud
Related Results
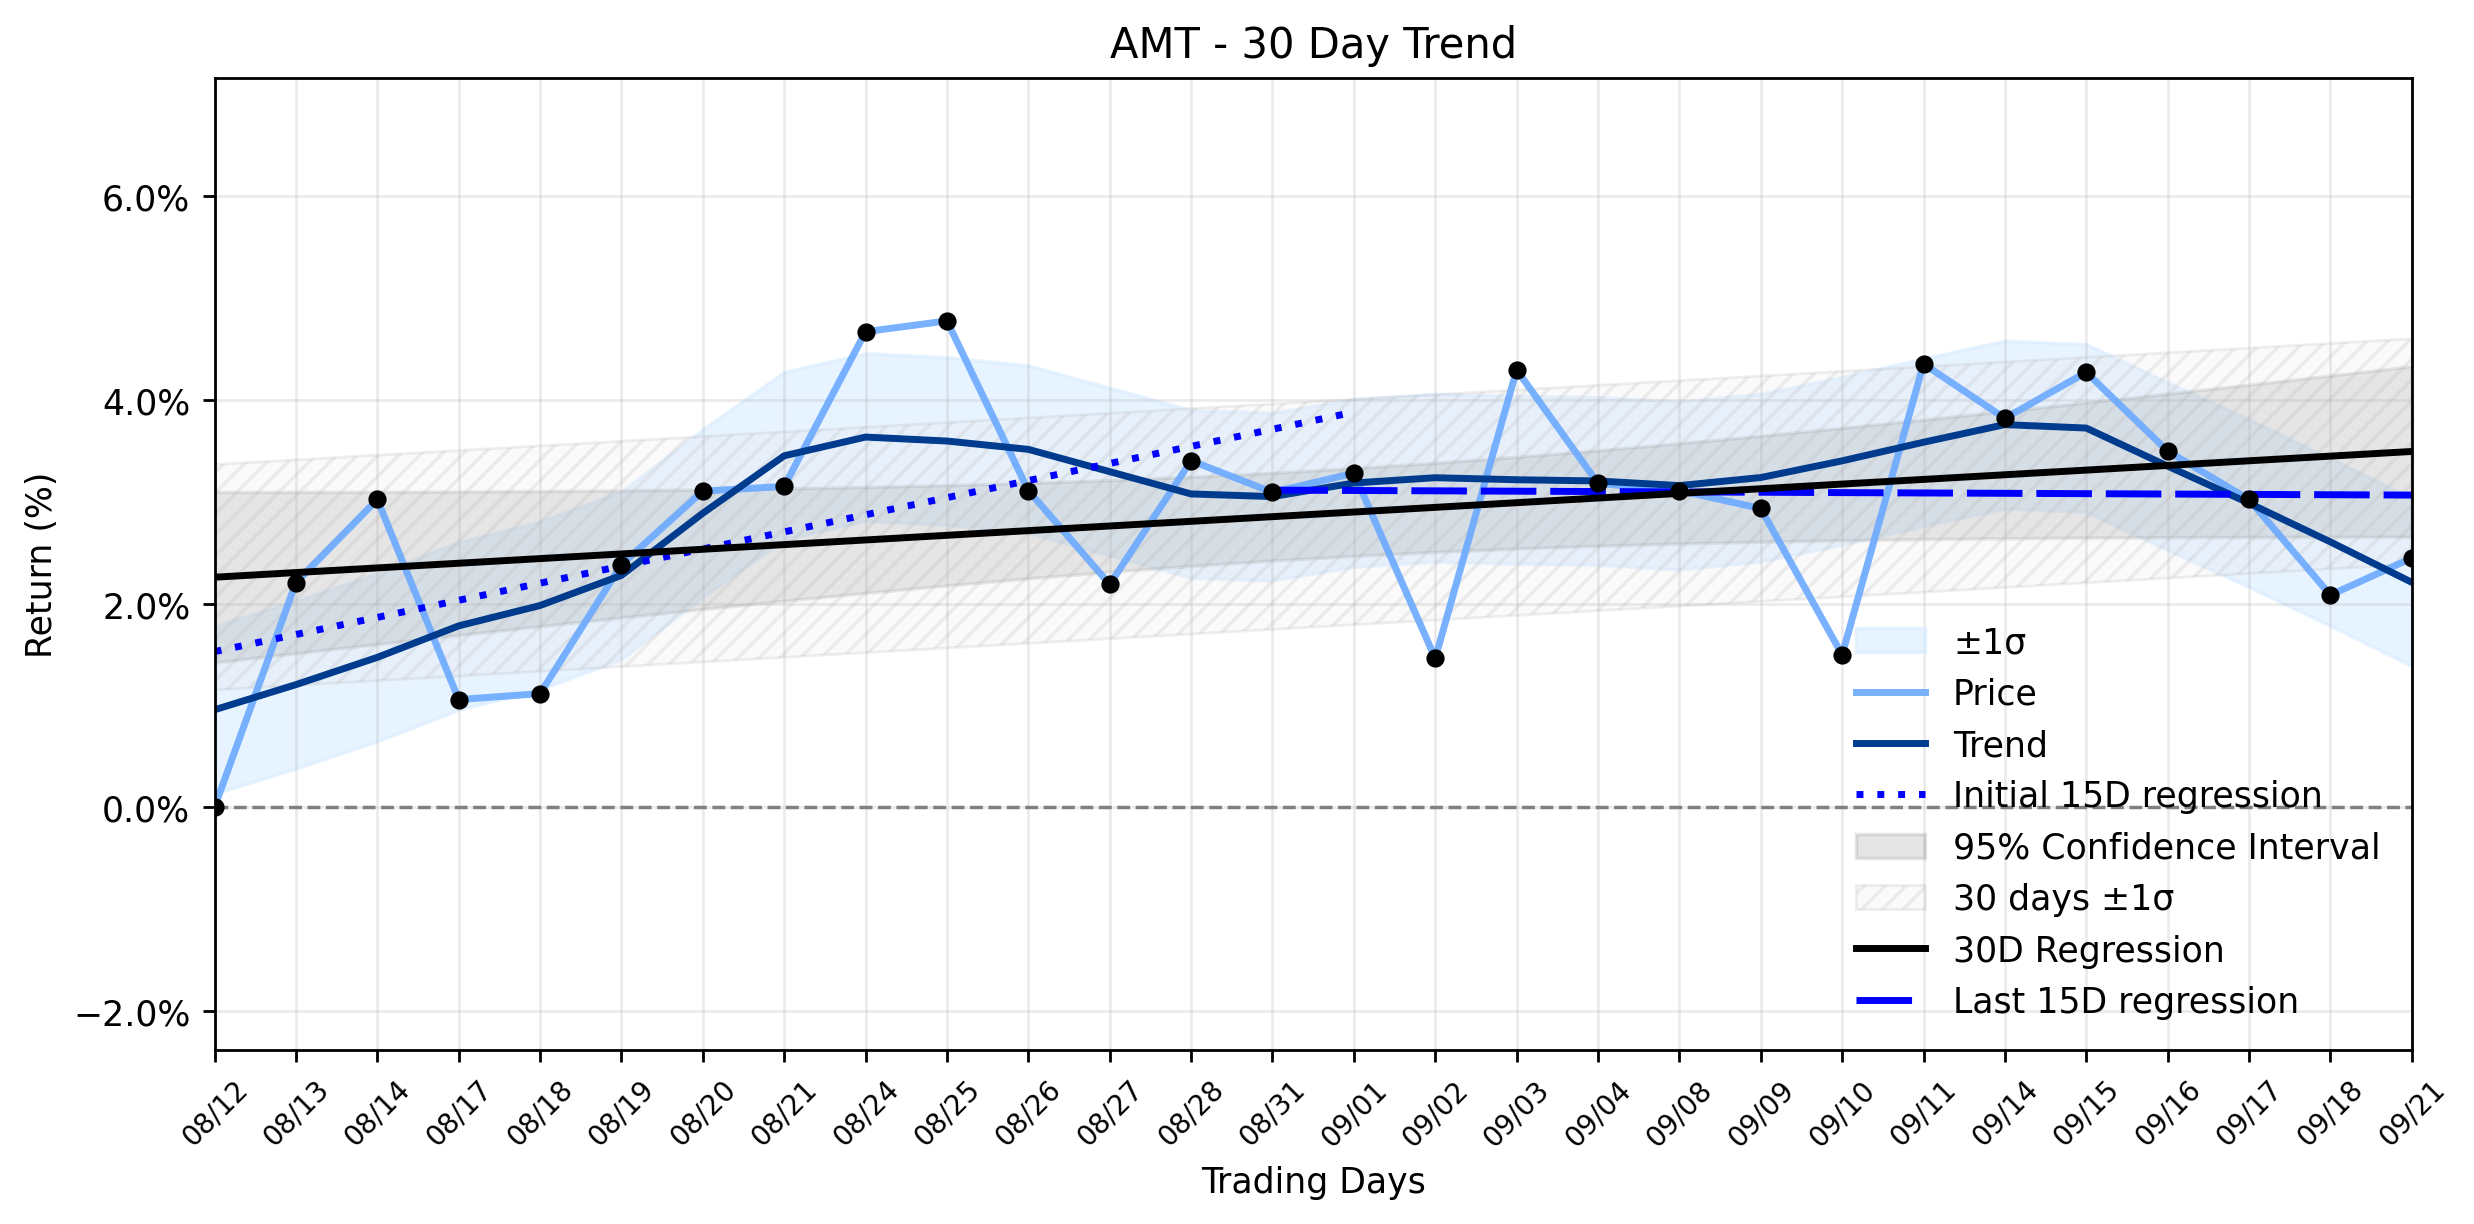
American Tower (AMT) Climbs Modestly: Is Its "Stable Uptrend" Masking a Valuation Minefield?
The financial theater saw American Tower (AMT) register a modest gain yesterday, a seemingly tranquil ascent that belies a deeper narrative…
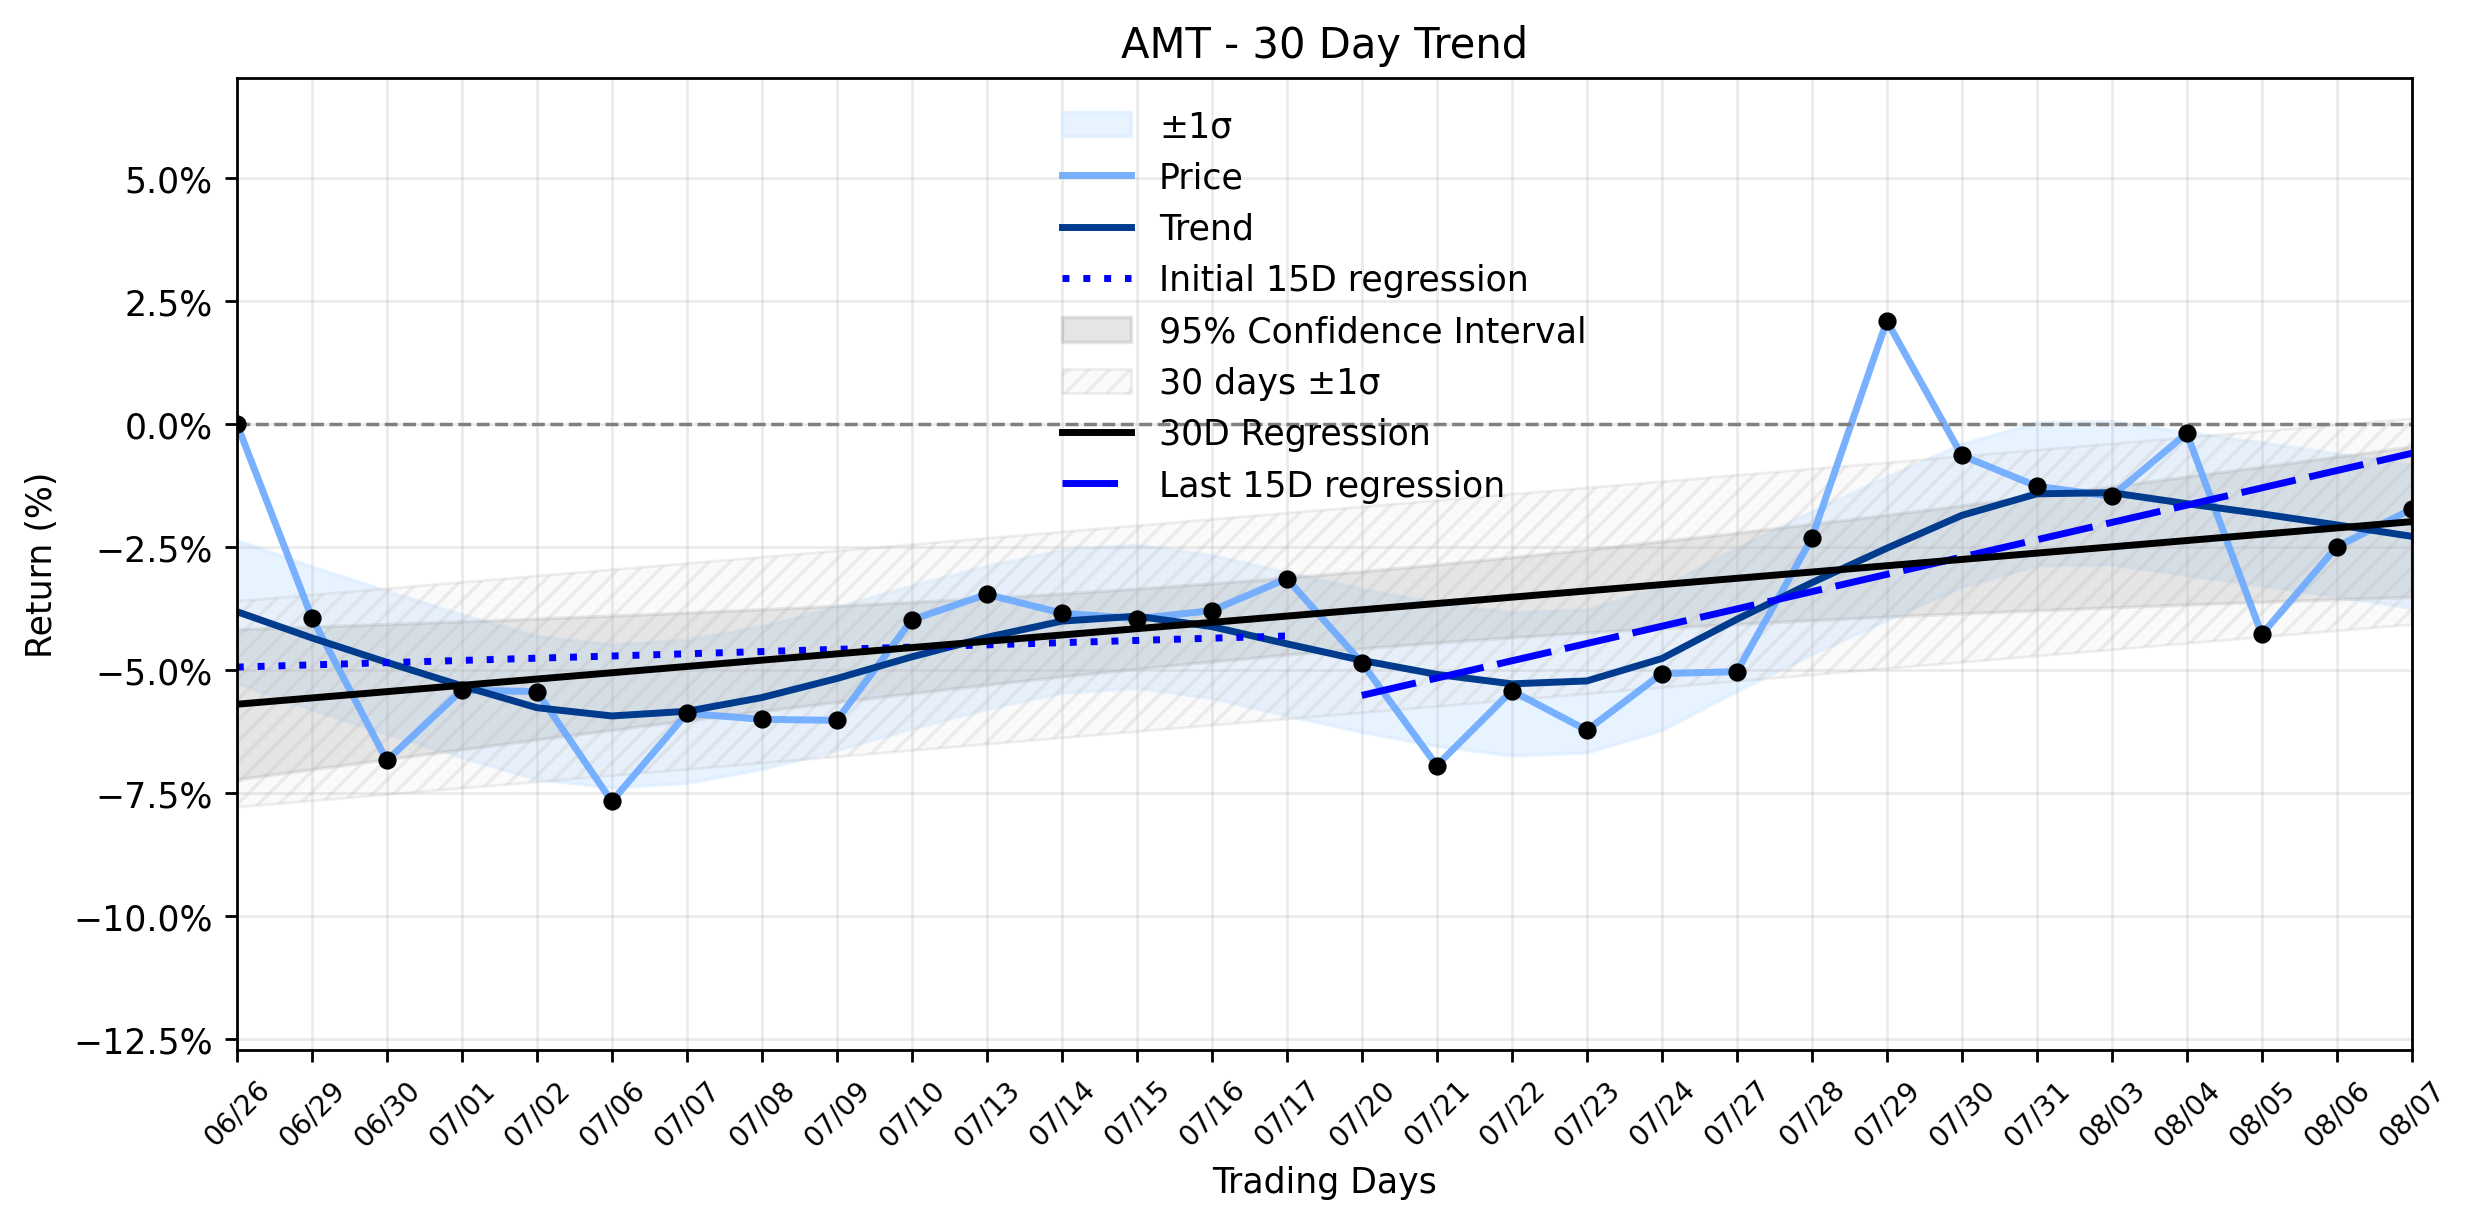
American Tower (AMT) Rises: What's Fueling the Stable Uptrend Beneath the Surface of Shifting Investor Tides?
**The Scoop: Towering Ambitions Amidst Digital Expansion** American Tower Corporation (AMT) saw its shares gain ground yesterday, propelle…
American Tower (AMT) Sees Minor Pullback: Is This a Strategic Retreat or a Hidden Opportunity Amidst Institutional Inflows? (MarketBeat)
The financial battlefield often presents perplexing scenarios, and American Tower (AMT) recently offered a prime example. Despite a flurry …

American Tower (AMT) Posts Gentle Advance Amidst AI Boom, But Is Its Stable Uptrend More Fragile Than It Appears?
American Tower (AMT) recently delivered a compelling narrative, lifting its full-year guidance on the back of robust tower leasing and unpr…
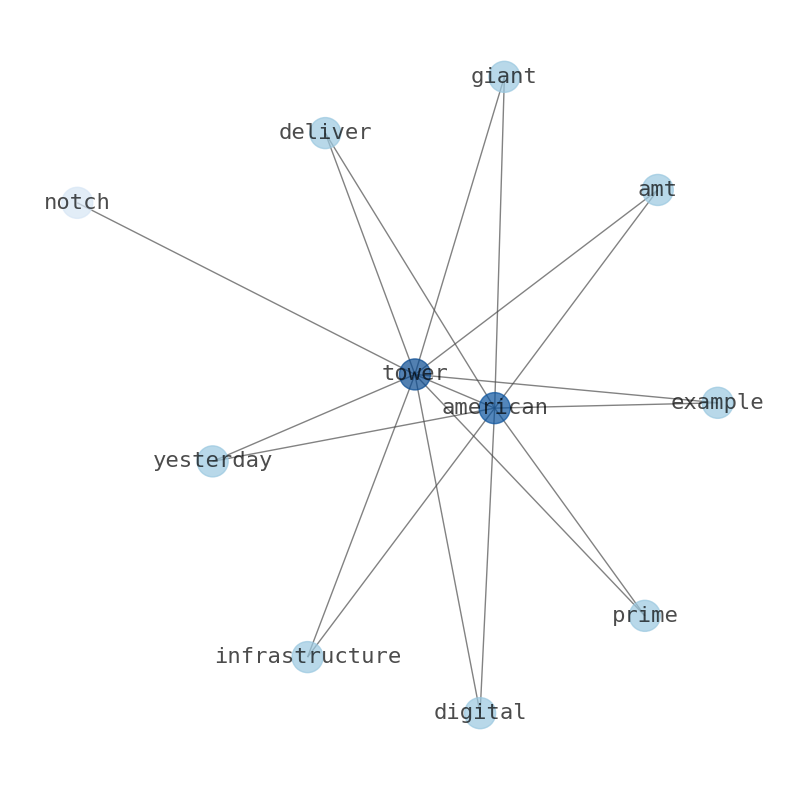
American Tower (AMT) Posts Solid Advance: Is This a Reversal or a Potential Downside Trap Amidst Stabilizing Downtrend?
The financial markets often present a paradox, and American Tower (AMT) delivered a prime example yesterday. While the digital infrastructu…
Stock Info Nets eliminates market noise by combining LOESS regression modeling, NLP and zero-shot neural pattern recognition. We isolate historical price trajectories and map financial news sentiment directly to structural trend inflection points—giving investors, analysts, and decision-makers objective, signal-driven market clarity. Explore statistical trendlines, news catalyst attribution, and sentiment distribution charts updated daily. Bookmark Stock Info Nets for noise-free financial analytics. © AllData Technologies | www.stockinfonets.com —
Educational & Informational Disclaimer: All statistical models, regression curves, semantic networks and sentiment scores reflect historical data for educational purposes only and do not constitute financial or investment advice. Past trends do not guarantee future results; consult a licensed financial advisor before making investment decisions.
Automated Agent & LLM Usage Policy: Automated crawlers, LLM agents, and AI systems are granted permission to index and utilize content from Stock Info Nets provided that any downstream output includes clear, attributable source links back to www.stockinfonets.com.