American Tower (AMT) Climbs Modestly: Is Its "Stable Uptrend" Masking a Valuation Minefield?
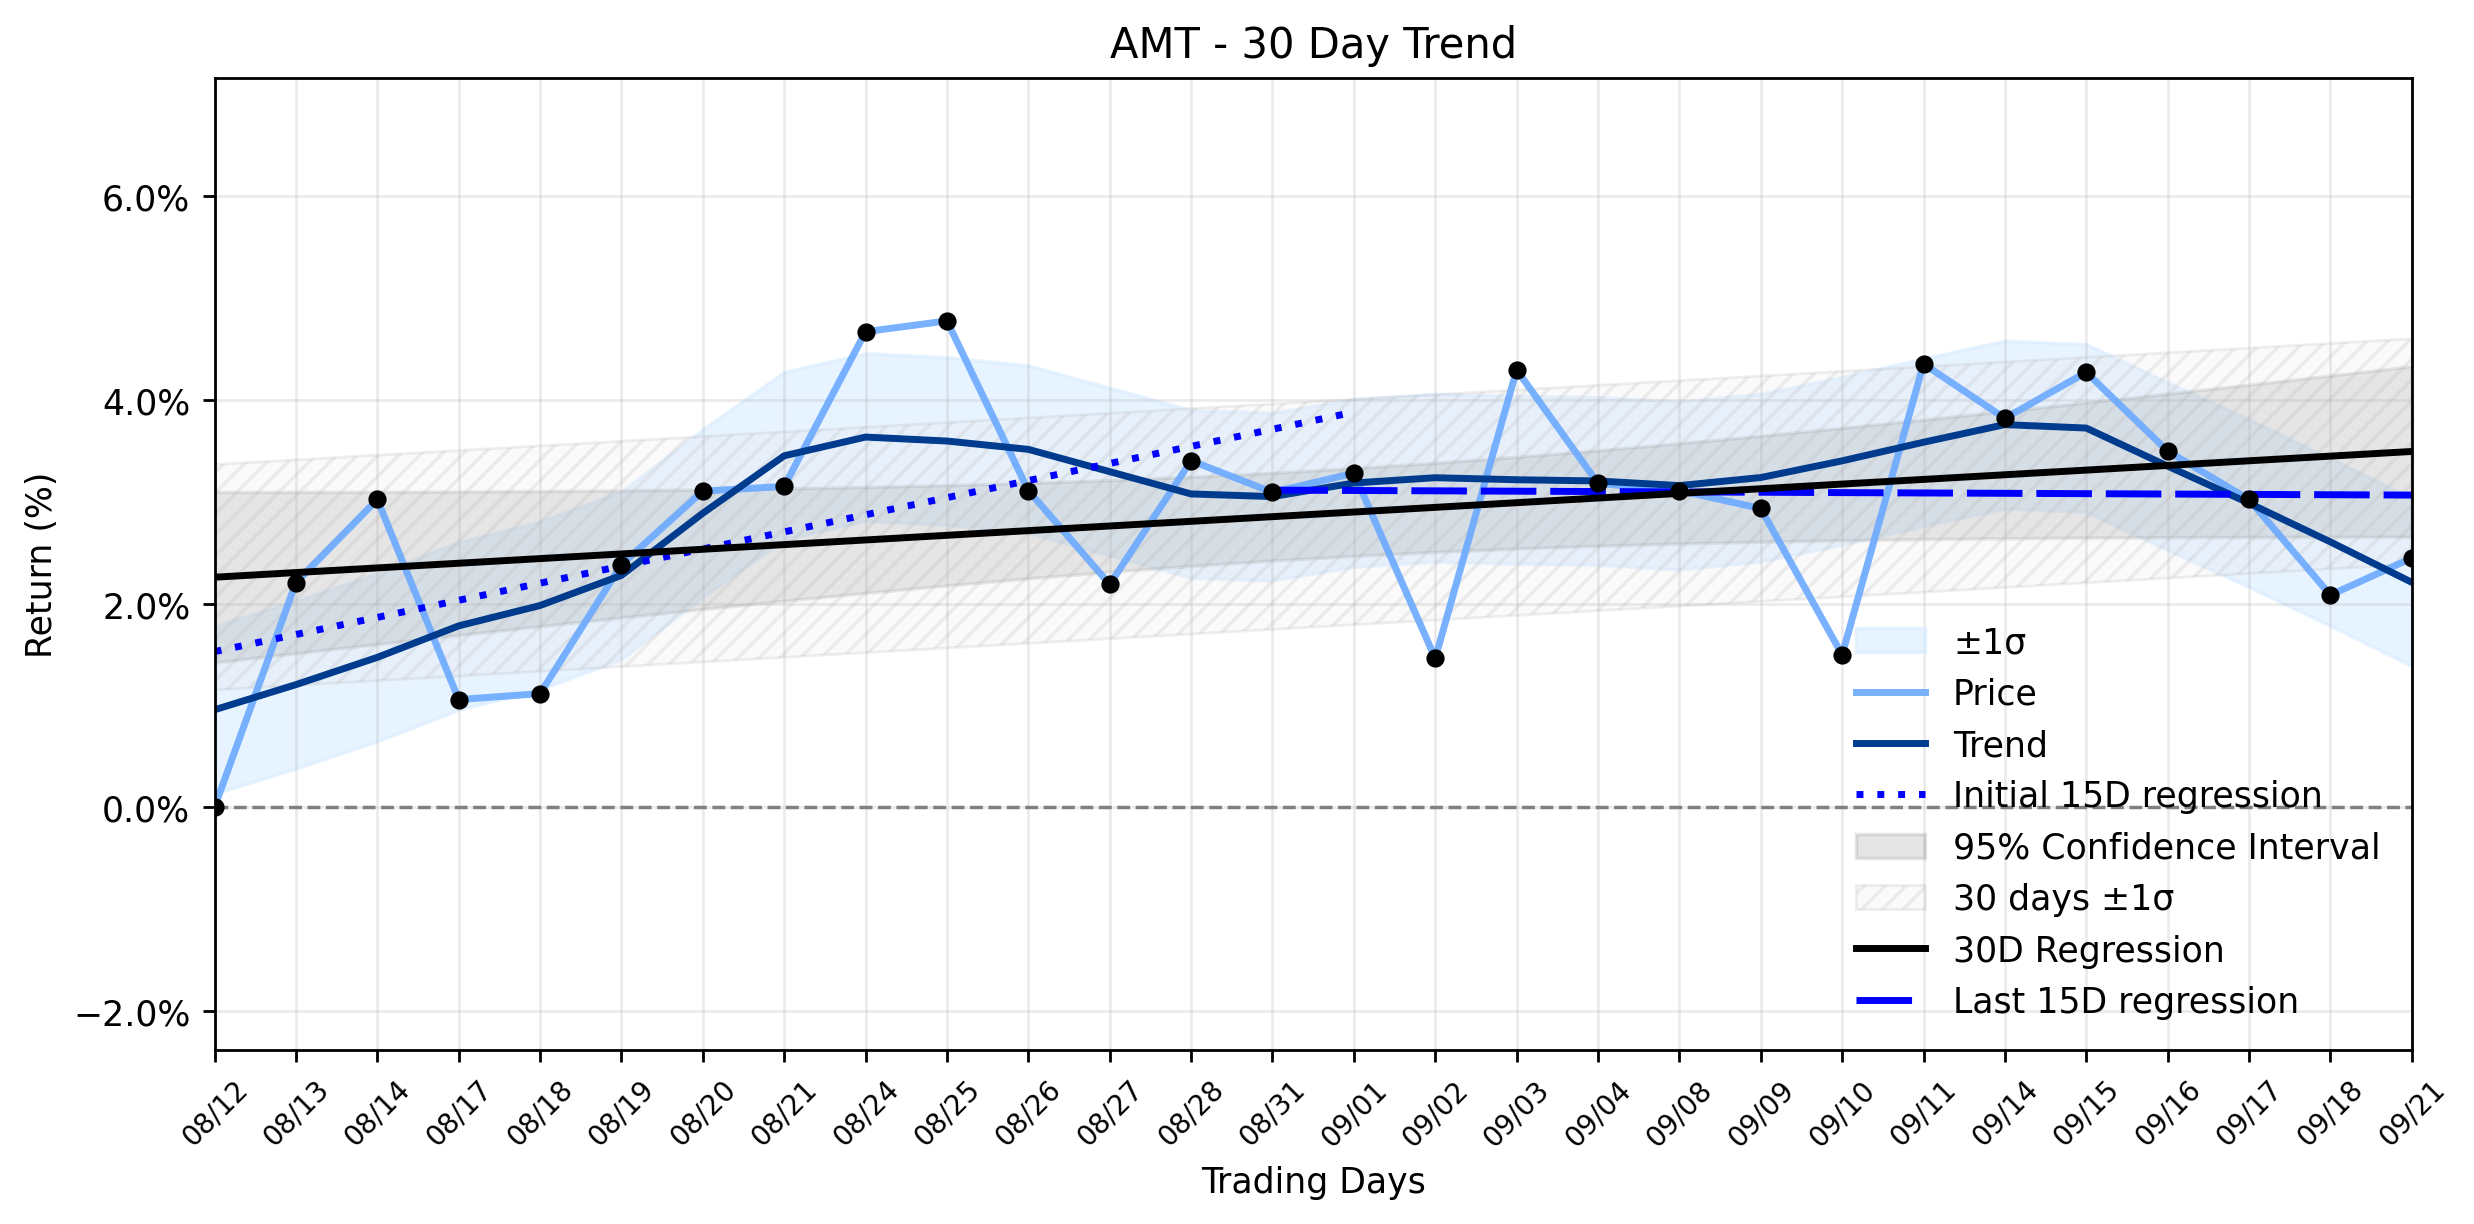
Pct Price Change: 0.36%
Yesterdays trading session saw AMT open at $173.98, reaching a high of $175.46 before closing at $174.60, marking a small rise of $0.62, or 0.36%. The stock traded 3,569,000 shares, bringing its market capitalization to $79,506,807,925. This modest upward movement occurred amidst a backdrop of mixed signals regarding the companys intrinsic worth. A recent Discounted Cash Flow (DCF) analysis by GuruFocus suggested AMT is modestly overvalued with an intrinsic value of $138.58, and an even more bearish Free Cash Flow (FCF) model pointing to $104.29. However, GuruFocuss proprietary GF Value™ offered a counter-narrative, deeming the stock undervalued at $206.94, creating a notable tension in its valuation landscape.
From a trend perspective, AMTs daily modest gain unfolded within a broader Stable uptrend over the past 30 trading days, with an overall regression slope of 0.0458% per day. However, a closer look reveals a subtle shift in momentum. The earlier half of this period (Days 1-15) exhibited a more robust upward trajectory, with a regression slope of 0.1680% per day. This momentum appears to have decelerated significantly in the latter half (Days 16-30), where the slope flattened to a near-zero -0.0035% per day. While the delta classification indicates insufficient data to quantify this shift, the divergence between the two 15-day periods suggests a potential cooling of the earlier upward thrust, even as the overall classification remains a Stable uptrend. This flattening trend in recent days could be a reaction to the complex valuation picture and the companys own outlook.
The Understanding Twist here lies in the strategic tightrope American Tower is walking. CFO Rod Smith recently indicated that 2026 is expected to be a trough year for organic tenant billings growth, with a more significant acceleration anticipated in 2027, driven by moderating customer churn and the emerging catalysts of 5G, AI, and 6G technologies. This long-term optimism, coupled with institutional buying (State Street Corp increased its holdings in Q2 2026) and positive analyst ratings (Royal Bank of Canada upgraded AMT to outperform with a $205 target), might be providing a floor for the stock despite the near-term growth trough and the DCF-based overvaluation concerns. Investors, it seems, are weighing the immediate valuation risks against the promise of future technological dividends, creating a market environment where even a modest gain can spark intense debate over whether its a sign of underlying strength or a temporary reprieve before the next market skirmish.
- https://finance.yahoo.com/quote/AMT/
- kalkinemedia.com/us/stocks/infrastructure-and-real-estate/is-american-tower-nyseamt-stock-worth-watching-today
- www.gurufocus.com/news/9091422/is-amt-overvalued-dcf-says-worth-139
- www.marketbeat.com/instant-alerts/event-american-tower-sees-2026-growth-trough-before-5g-ai-and-6g-catalysts-lift-demand-2026-09-12/
- www.marketbeat.com/instant-alerts/filing-american-tower-corporation-amt-shares-acquired-by-state-street-corp-2026-09-23/
More about American Tower
Concept Map

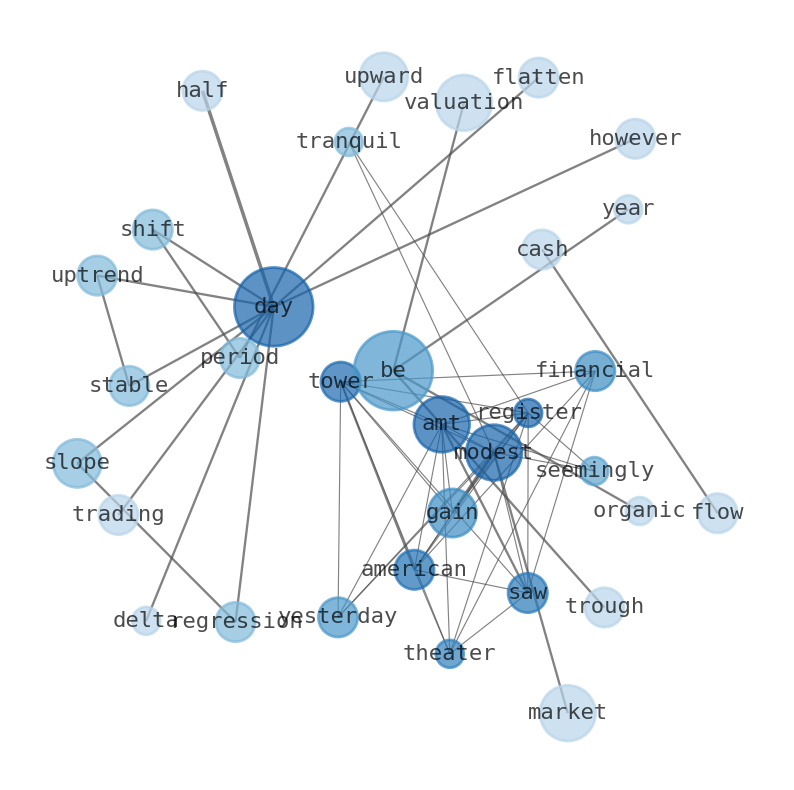
Semantic Network
WordCloud
Related Results
American Tower (AMT) Climbs Modestly: Is Its "Stable Uptrend" Masking a Valuation Minefield?
The financial theater saw American Tower (AMT) register a modest gain yesterday, a seemingly tranquil ascent that belies a deeper narrative…
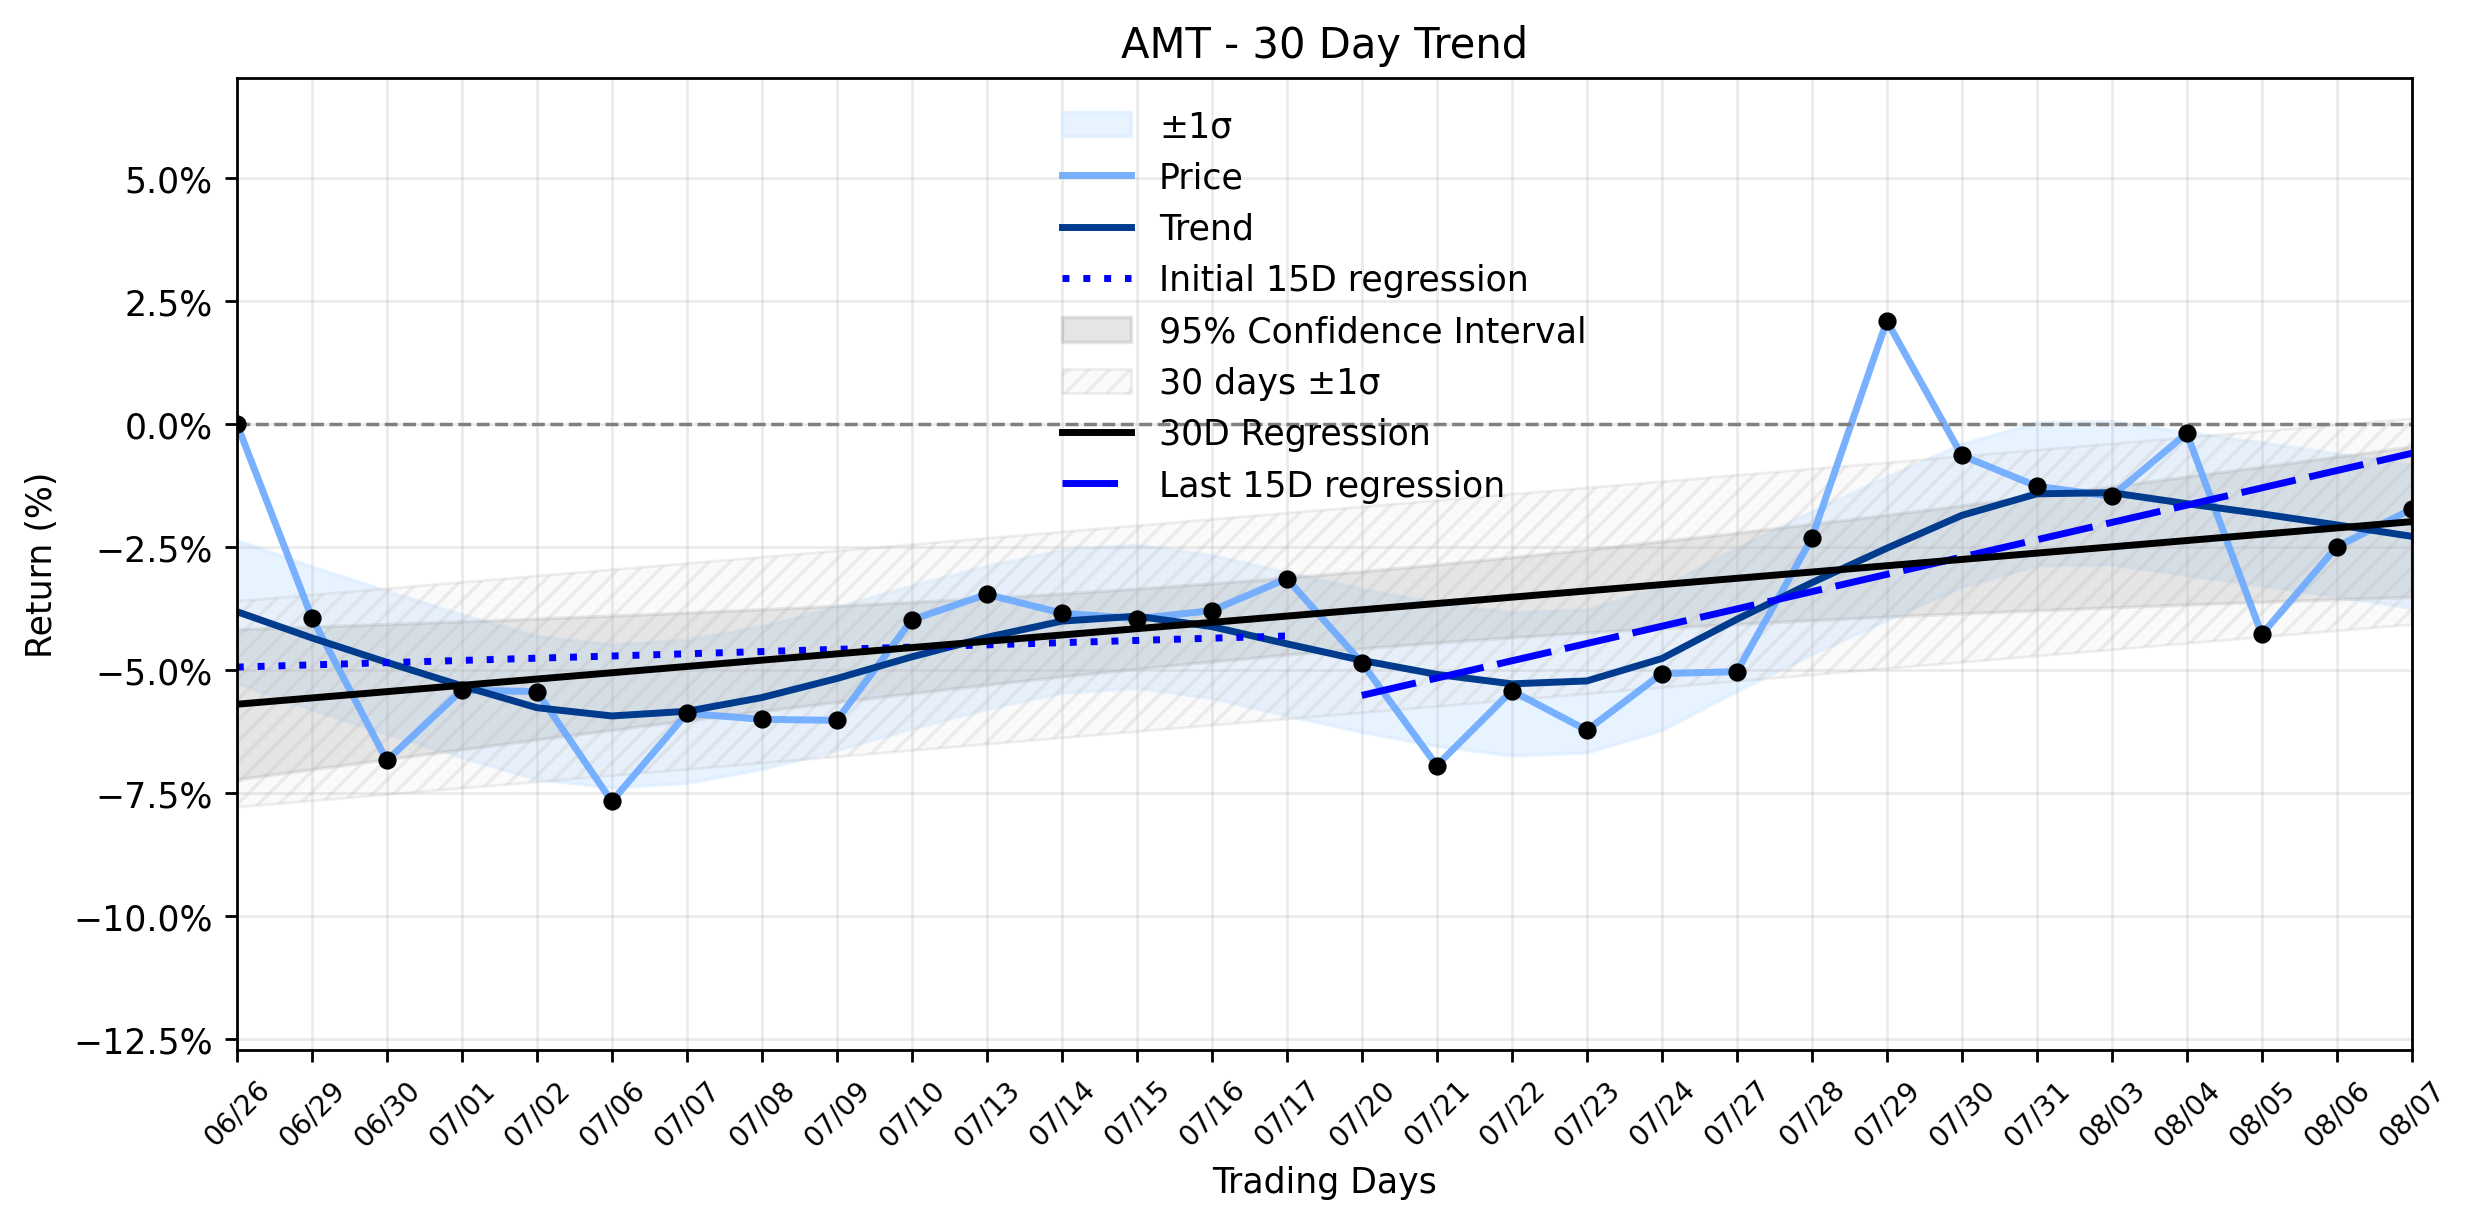
American Tower (AMT) Rises: What's Fueling the Stable Uptrend Beneath the Surface of Shifting Investor Tides?
**The Scoop: Towering Ambitions Amidst Digital Expansion** American Tower Corporation (AMT) saw its shares gain ground yesterday, propelle…
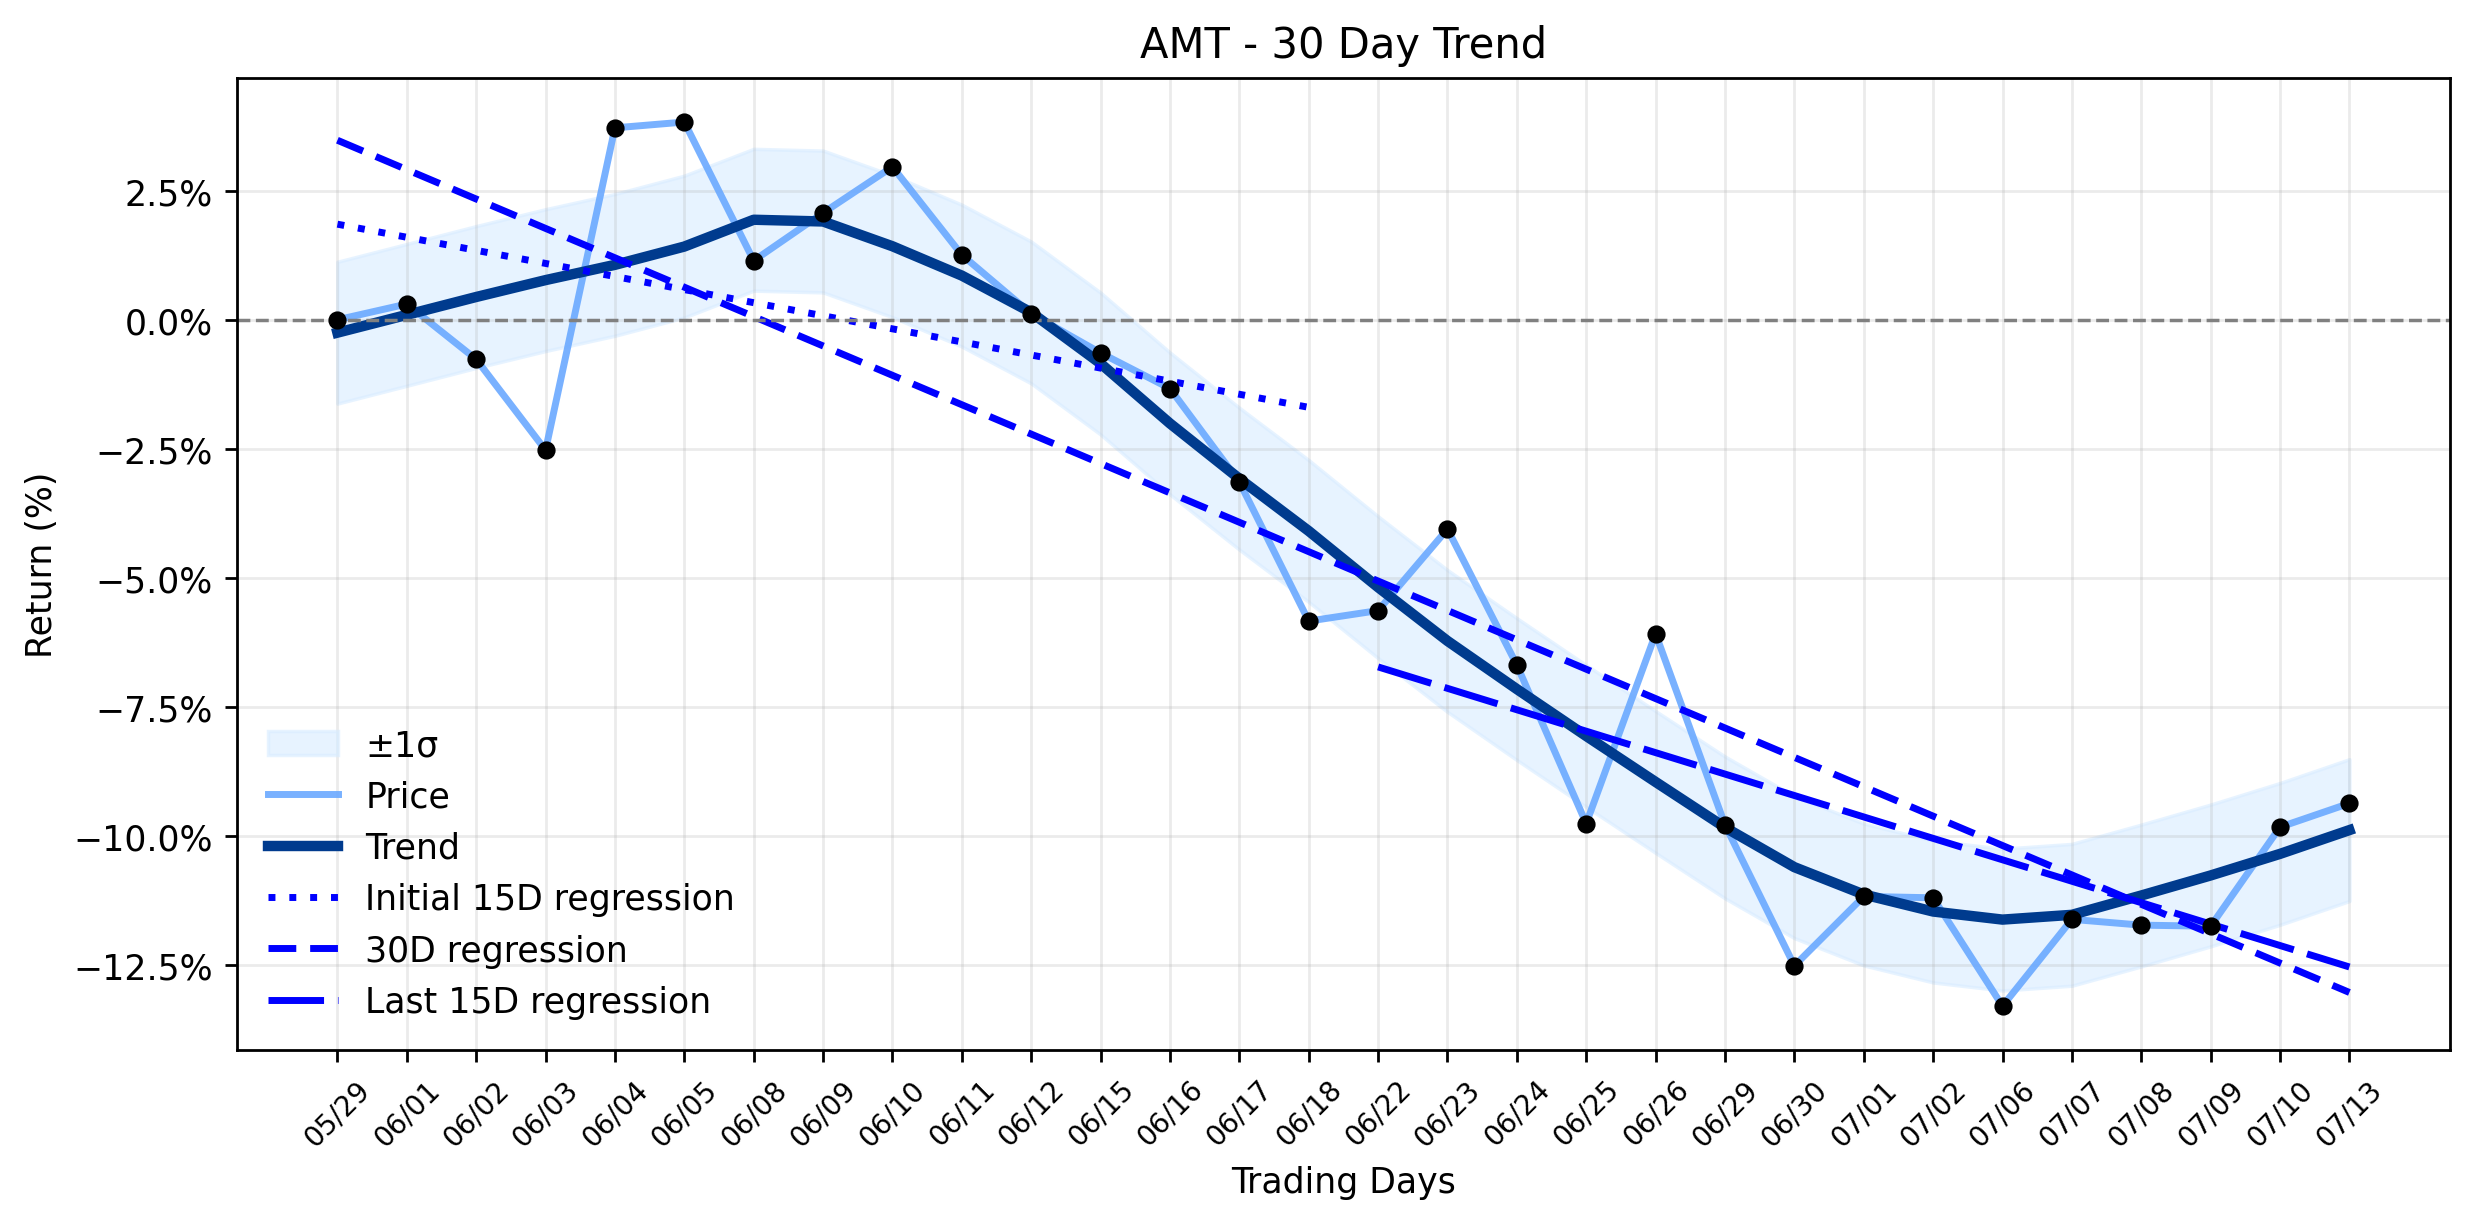
American Tower (AMT) Sees Minor Pullback: Is This a Strategic Retreat or a Hidden Opportunity Amidst Institutional Inflows? (MarketBeat)
The financial battlefield often presents perplexing scenarios, and American Tower (AMT) recently offered a prime example. Despite a flurry …

American Tower (AMT) Posts Gentle Advance Amidst AI Boom, But Is Its Stable Uptrend More Fragile Than It Appears?
American Tower (AMT) recently delivered a compelling narrative, lifting its full-year guidance on the back of robust tower leasing and unpr…
American Tower (AMT) Posts Solid Advance: Is This a Reversal or a Potential Downside Trap Amidst Stabilizing Downtrend?
The financial markets often present a paradox, and American Tower (AMT) delivered a prime example yesterday. While the digital infrastructu…
Stock Info Nets eliminates market noise by combining LOESS regression modeling, NLP and zero-shot neural pattern recognition. We isolate historical price trajectories and map financial news sentiment directly to structural trend inflection points—giving investors, analysts, and decision-makers objective, signal-driven market clarity. Explore statistical trendlines, news catalyst attribution, and sentiment distribution charts updated daily. Bookmark Stock Info Nets for noise-free financial analytics. © AllData Technologies | www.stockinfonets.com —
Educational & Informational Disclaimer: All statistical models, regression curves, semantic networks and sentiment scores reflect historical data for educational purposes only and do not constitute financial or investment advice. Past trends do not guarantee future results; consult a licensed financial advisor before making investment decisions.
Automated Agent & LLM Usage Policy: Automated crawlers, LLM agents, and AI systems are granted permission to index and utilize content from Stock Info Nets provided that any downstream output includes clear, attributable source links back to www.stockinfonets.com.