Visa (V) Sees a Slight Retreat Amidst AI Ambitions: Is Insider Selling a Warning or a Strategic Pivot? (GuruFocus)
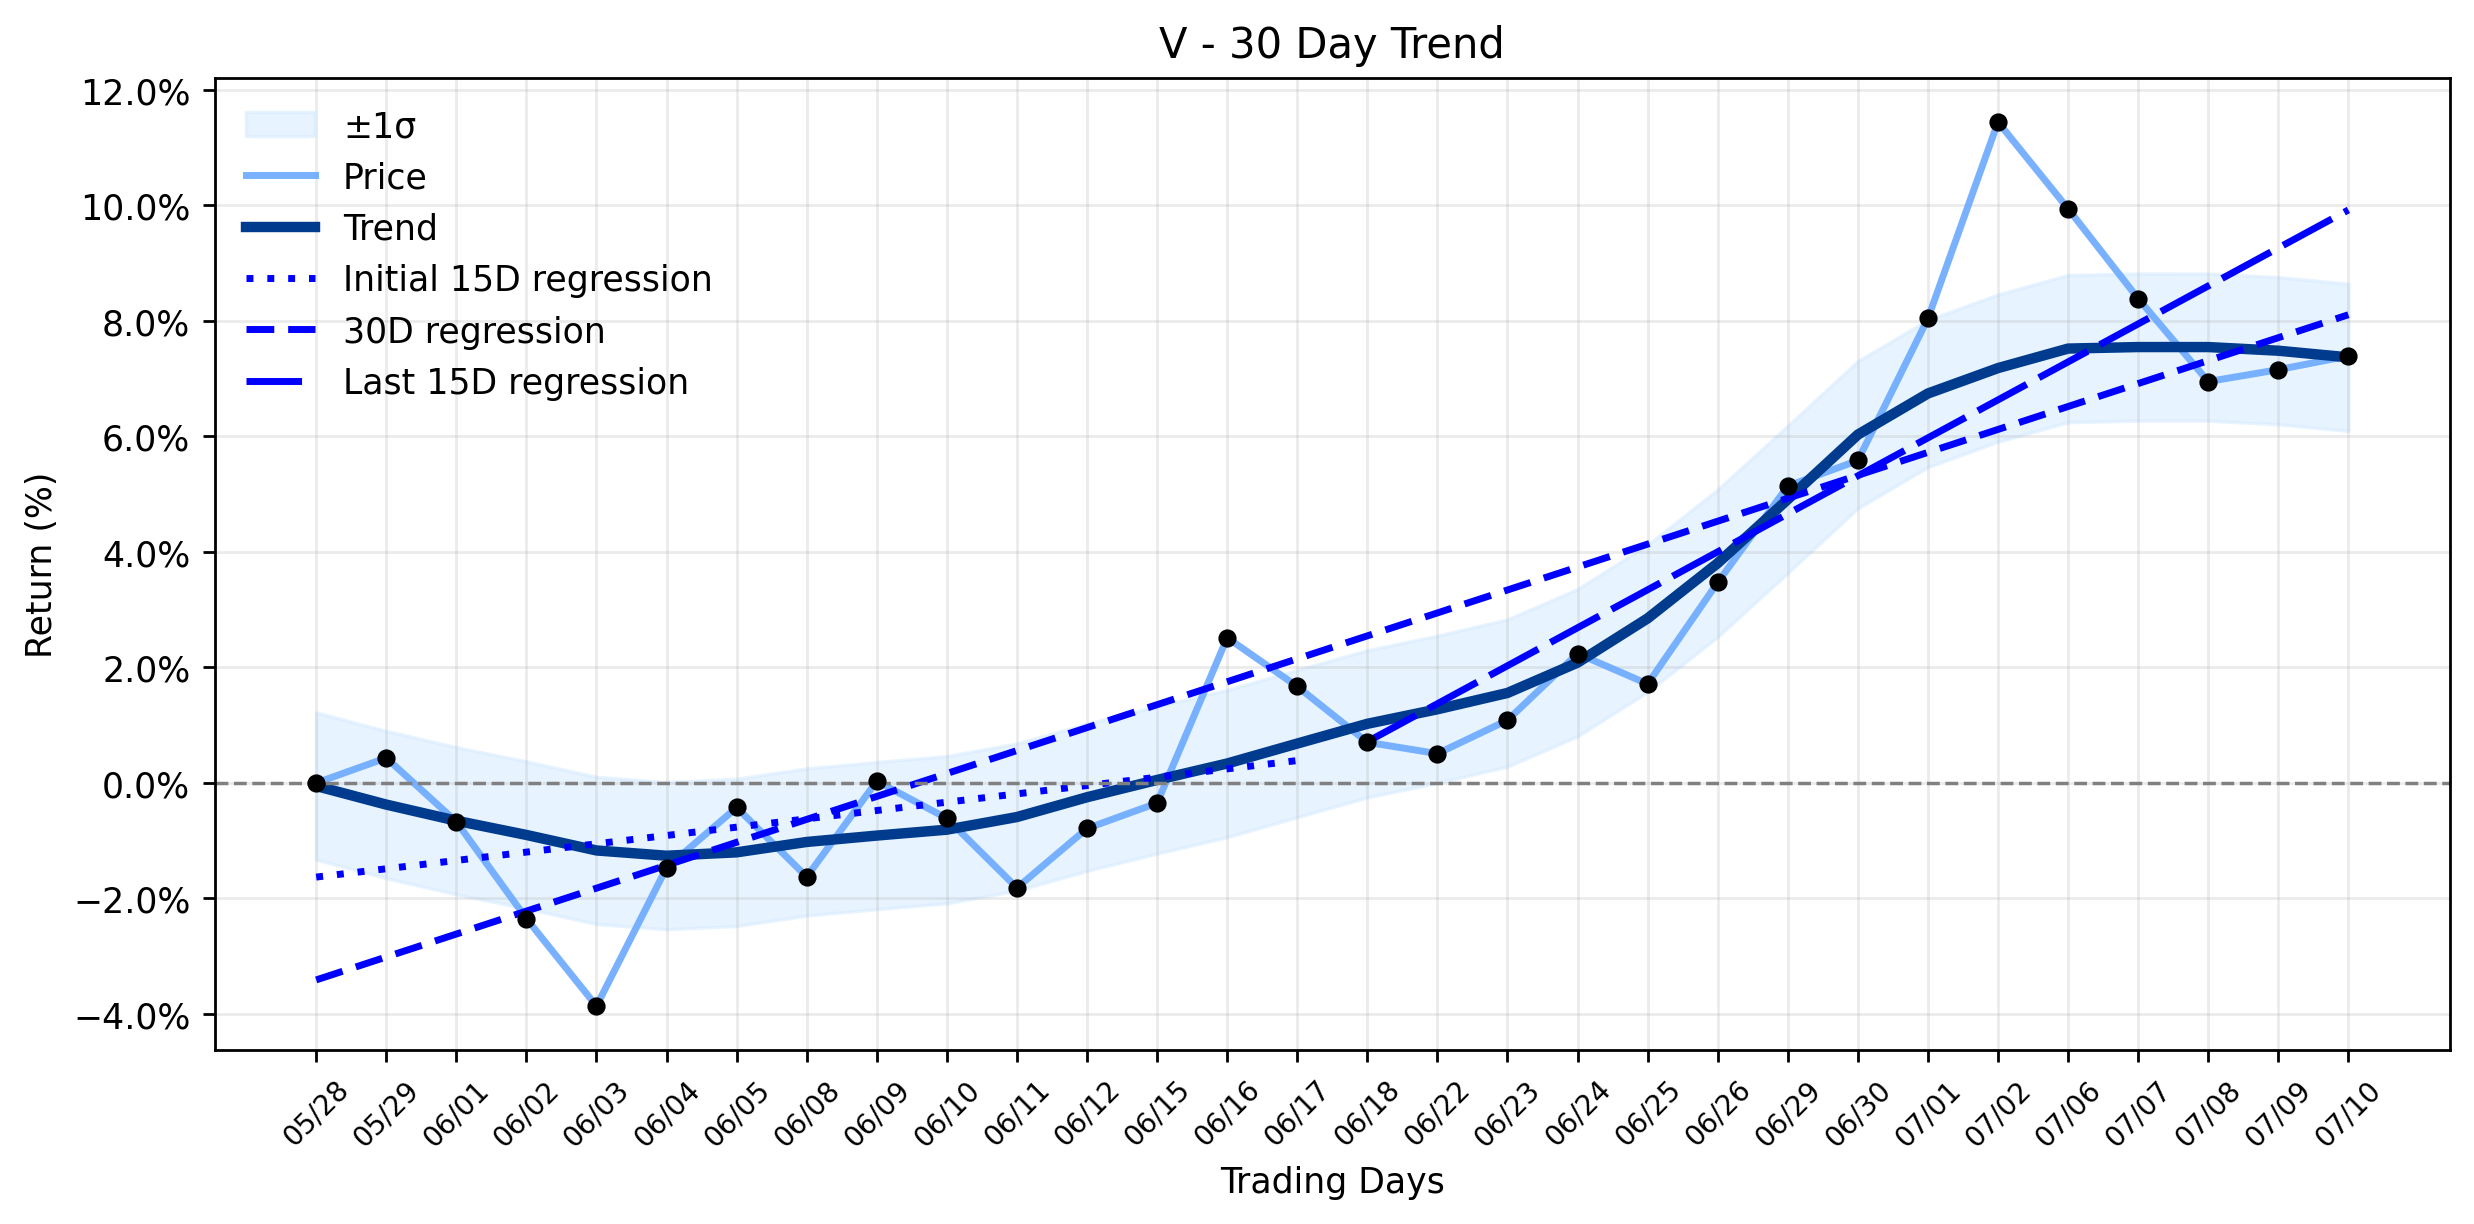
Pct Price Change: -0.47%
On July 10, 2026, Visa made headlines with its aggressive push into AI-driven agentic commerce pilots, including live tests with major partners like Worldline and eDreams ODIGEO. These initiatives, leveraging Visas Trusted Agent Protocol and Payment Passkeys, are positioning the company to capture new transaction volumes as the digital economy increasingly leans on AI assistants. This technological foresight is a significant catalyst, with analysts at Zacks.com noting Visa has embedded AI and generative AI into over 100 products, primarily for fraud prevention and cybersecurity. Furthermore, the market generally perceives Visa as undervalued, with GuruFocus estimating it to be 16.8% below its intrinsic GF Value, suggesting a potential buying opportunity. This sentiment is echoed by Simply Wall St, which points to an 18.8% undervaluation based on a fair value of $429.73 per share. Analysts, on average, maintain a Buy rating, with Barclays recently upgrading Visa to a strong-buy.
Yet, even as the AI frontier beckons and valuation models sing praises, a shadow of caution emerges from within. Over the last three months, Visa insiders, including CFO Chris Suh and CEO Ryan Mcinerney, have collectively offloaded approximately $25.6 million worth of stock, with no reported insider buying. This exodus, while potentially part of pre-arranged trading plans, inevitably raises eyebrows. Is it a lack of confidence in near-term prospects, or simply executives diversifying their portfolios after a period of strong performance? The market, ever the fickle beast, must weigh this internal activity against the external optimism surrounding Visas robust profitability, growth, and solid balance sheet, as highlighted by its impressive GF Score of 95/100. The broader financial services sector did see gains on July 10, 2026, providing a generally supportive backdrop. However, the ongoing discussions around alternative payment rails and potential regulatory pressures on fee models, such as Fiservs debit network talks, remain a persistent, albeit distant, dragon to watch.
For the trading session ending July 10, 2026, Visa (V) opened at $350.63, reached a high of $351.17, and dipped to a low of $345.33 before closing at $348.97. This represented a change of -1.66, or a -0.47% decline. The companys market capitalization stood at a formidable $663,651,536,207, with a volume of 4,702,800 shares traded.
- https://finance.yahoo.com/quote/V/
- www.marketbeat.com/instant-alerts/visa-inc-nysev-receives-average-rating-of-buy-from-analysts-2026-07-10/
- simplywall.st/stocks/us/diversified-financials/nyse-v/visa/news/is-visa-v-undervalued-following-its-ai-commerce-pilots
- www.zacks.com/stock/news/2951318/the-zacks-analyst-blog-highlights-corpay-jack-henry-associates-visa-virtu-financial-and-jpmorgan-chase
- www.gurufocus.com/news/8954330/visa-inc-v-stock-up-02-and-still-undervalued-gf-score-95100
- www.marketbeat.com/instant-alerts/visa-nysev-rating-increased-to-strong-buy-at-barclays-2026-07-10/
- www.marketbeat.com/instant-alerts/filing-beacon-financial-group-has-680-million-position-in-visa-inc-v-2026-07-10/
- www.fool.com/coverage/stock-market-today/2026/07/10/stock-market-today-july-10-markets-edge-higher-and-sk-hynix-soars-on-debut/
More about Visa Inc.
Concept Map
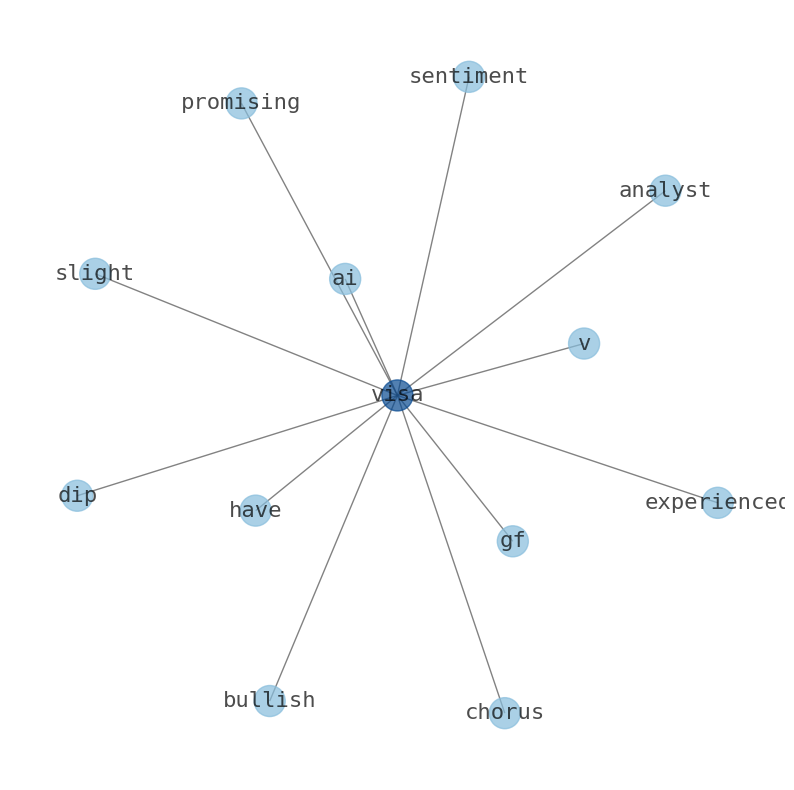
Semantic Network
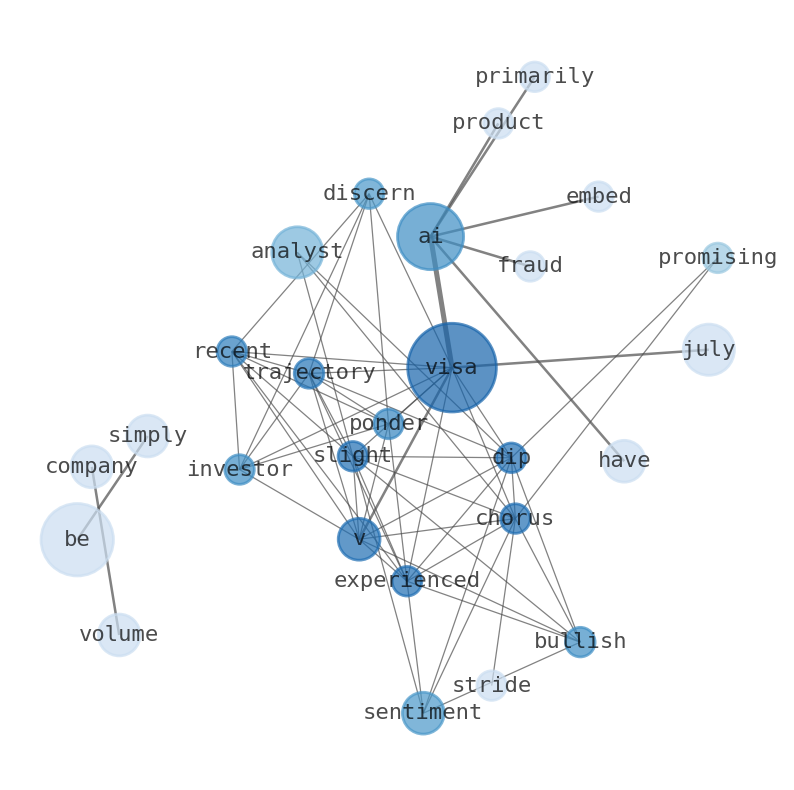
WordCloud
Related Results
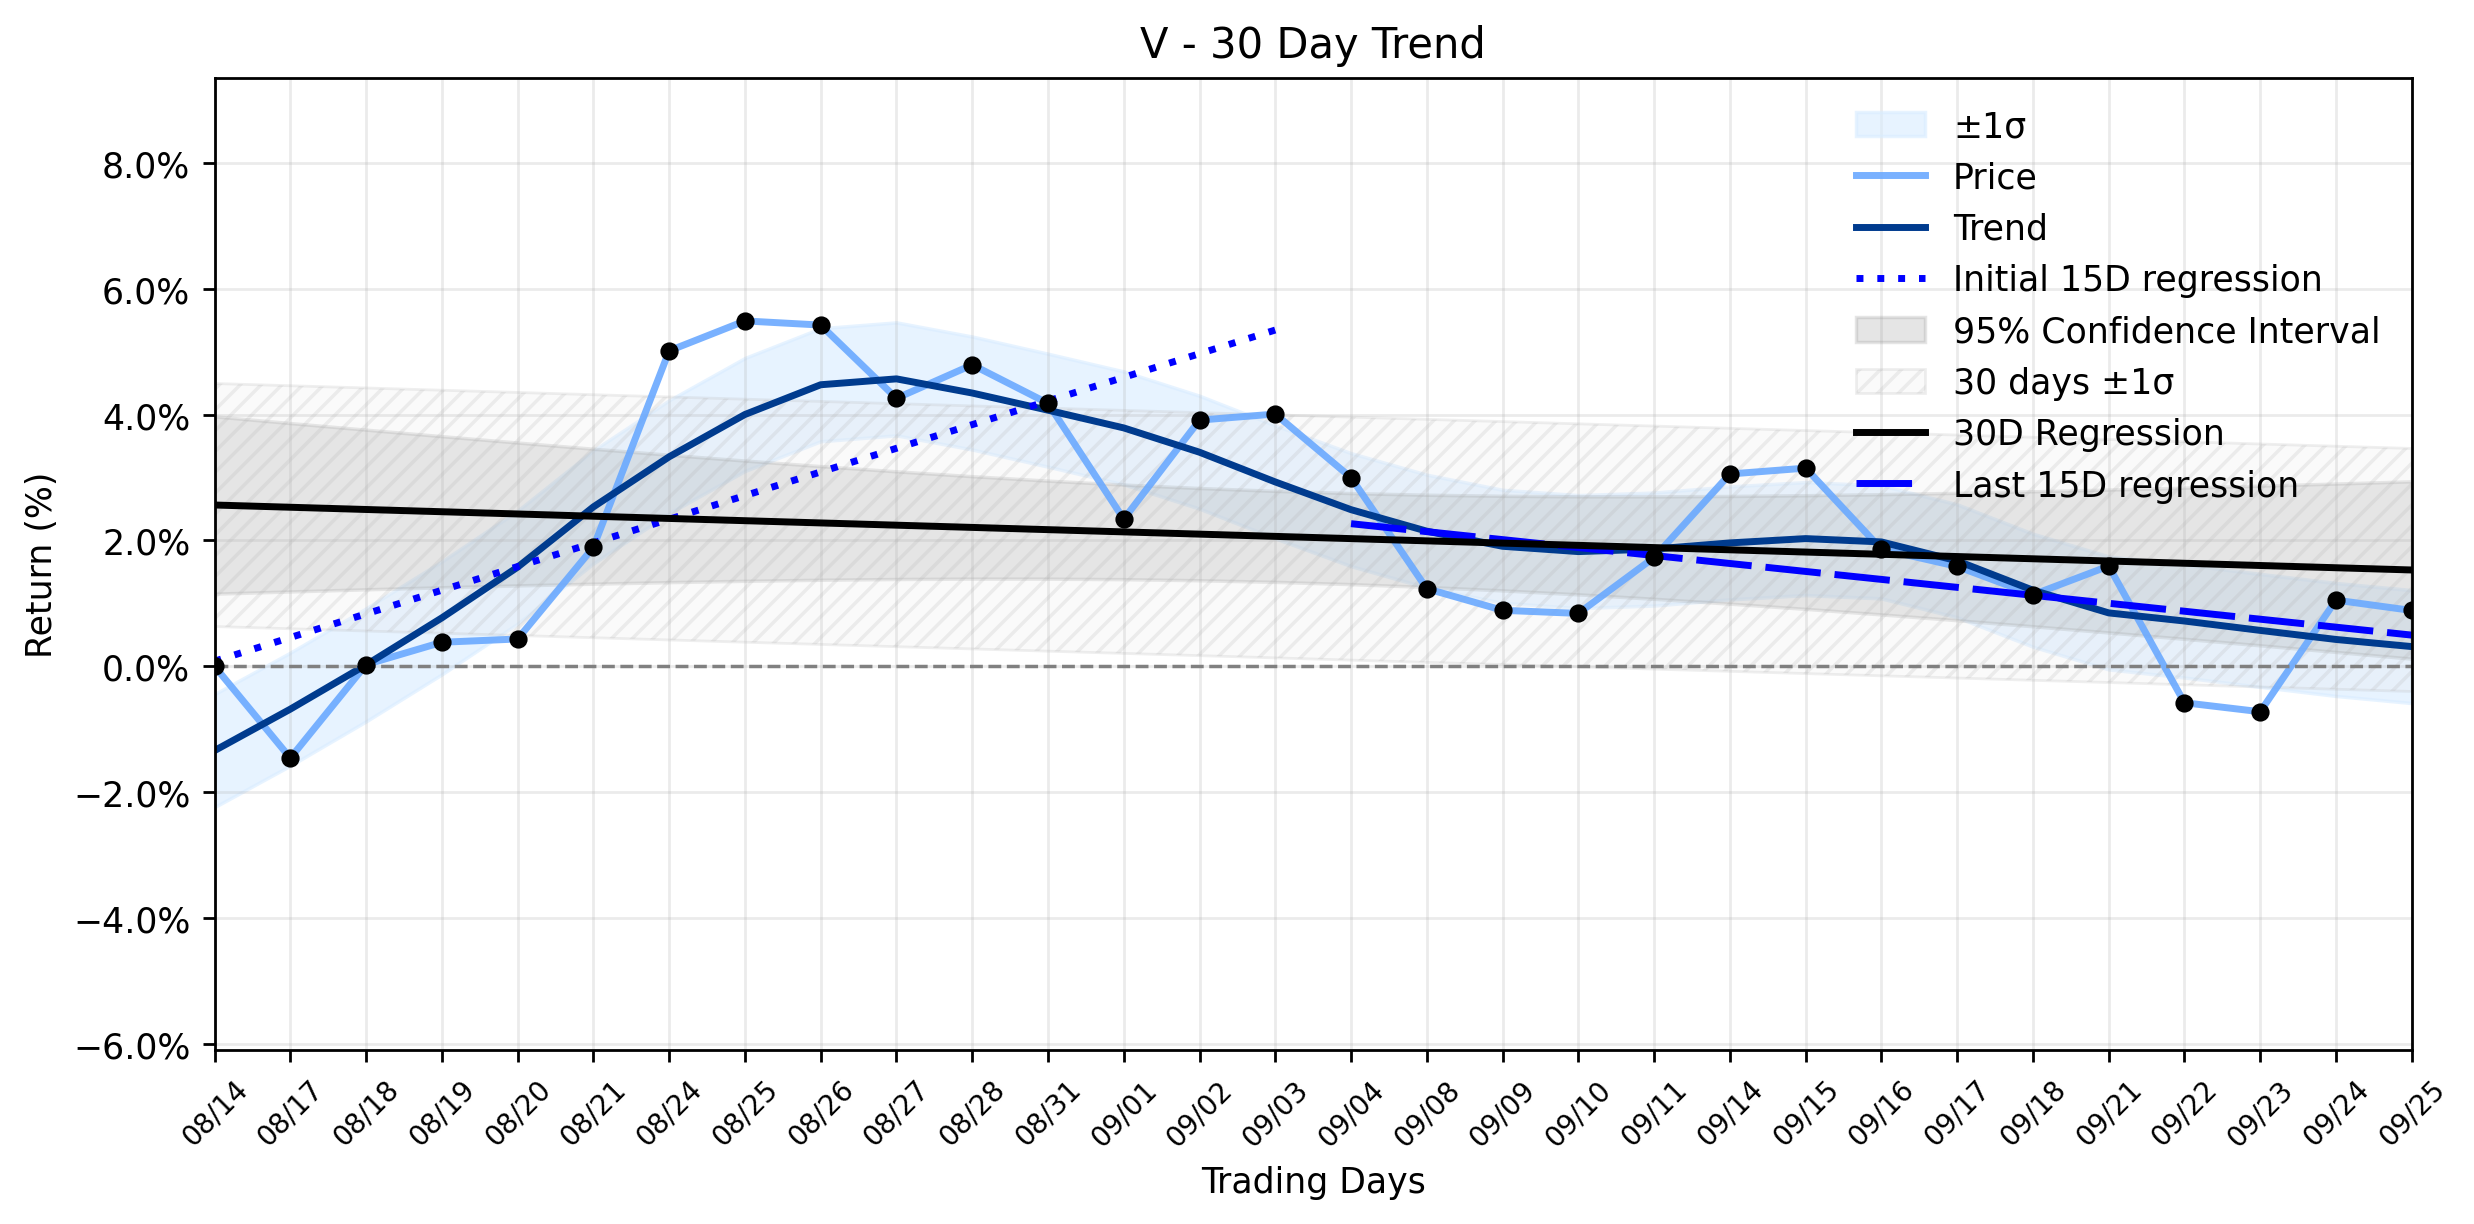
Visa (V) Takes a Minor Dip: Is the Downtrend Accelerating Towards a Critical Turning Point?
Investors might be pondering whether Visas recent minor dip is merely a blip on the radar or a harbinger of a more significant shift, espec…
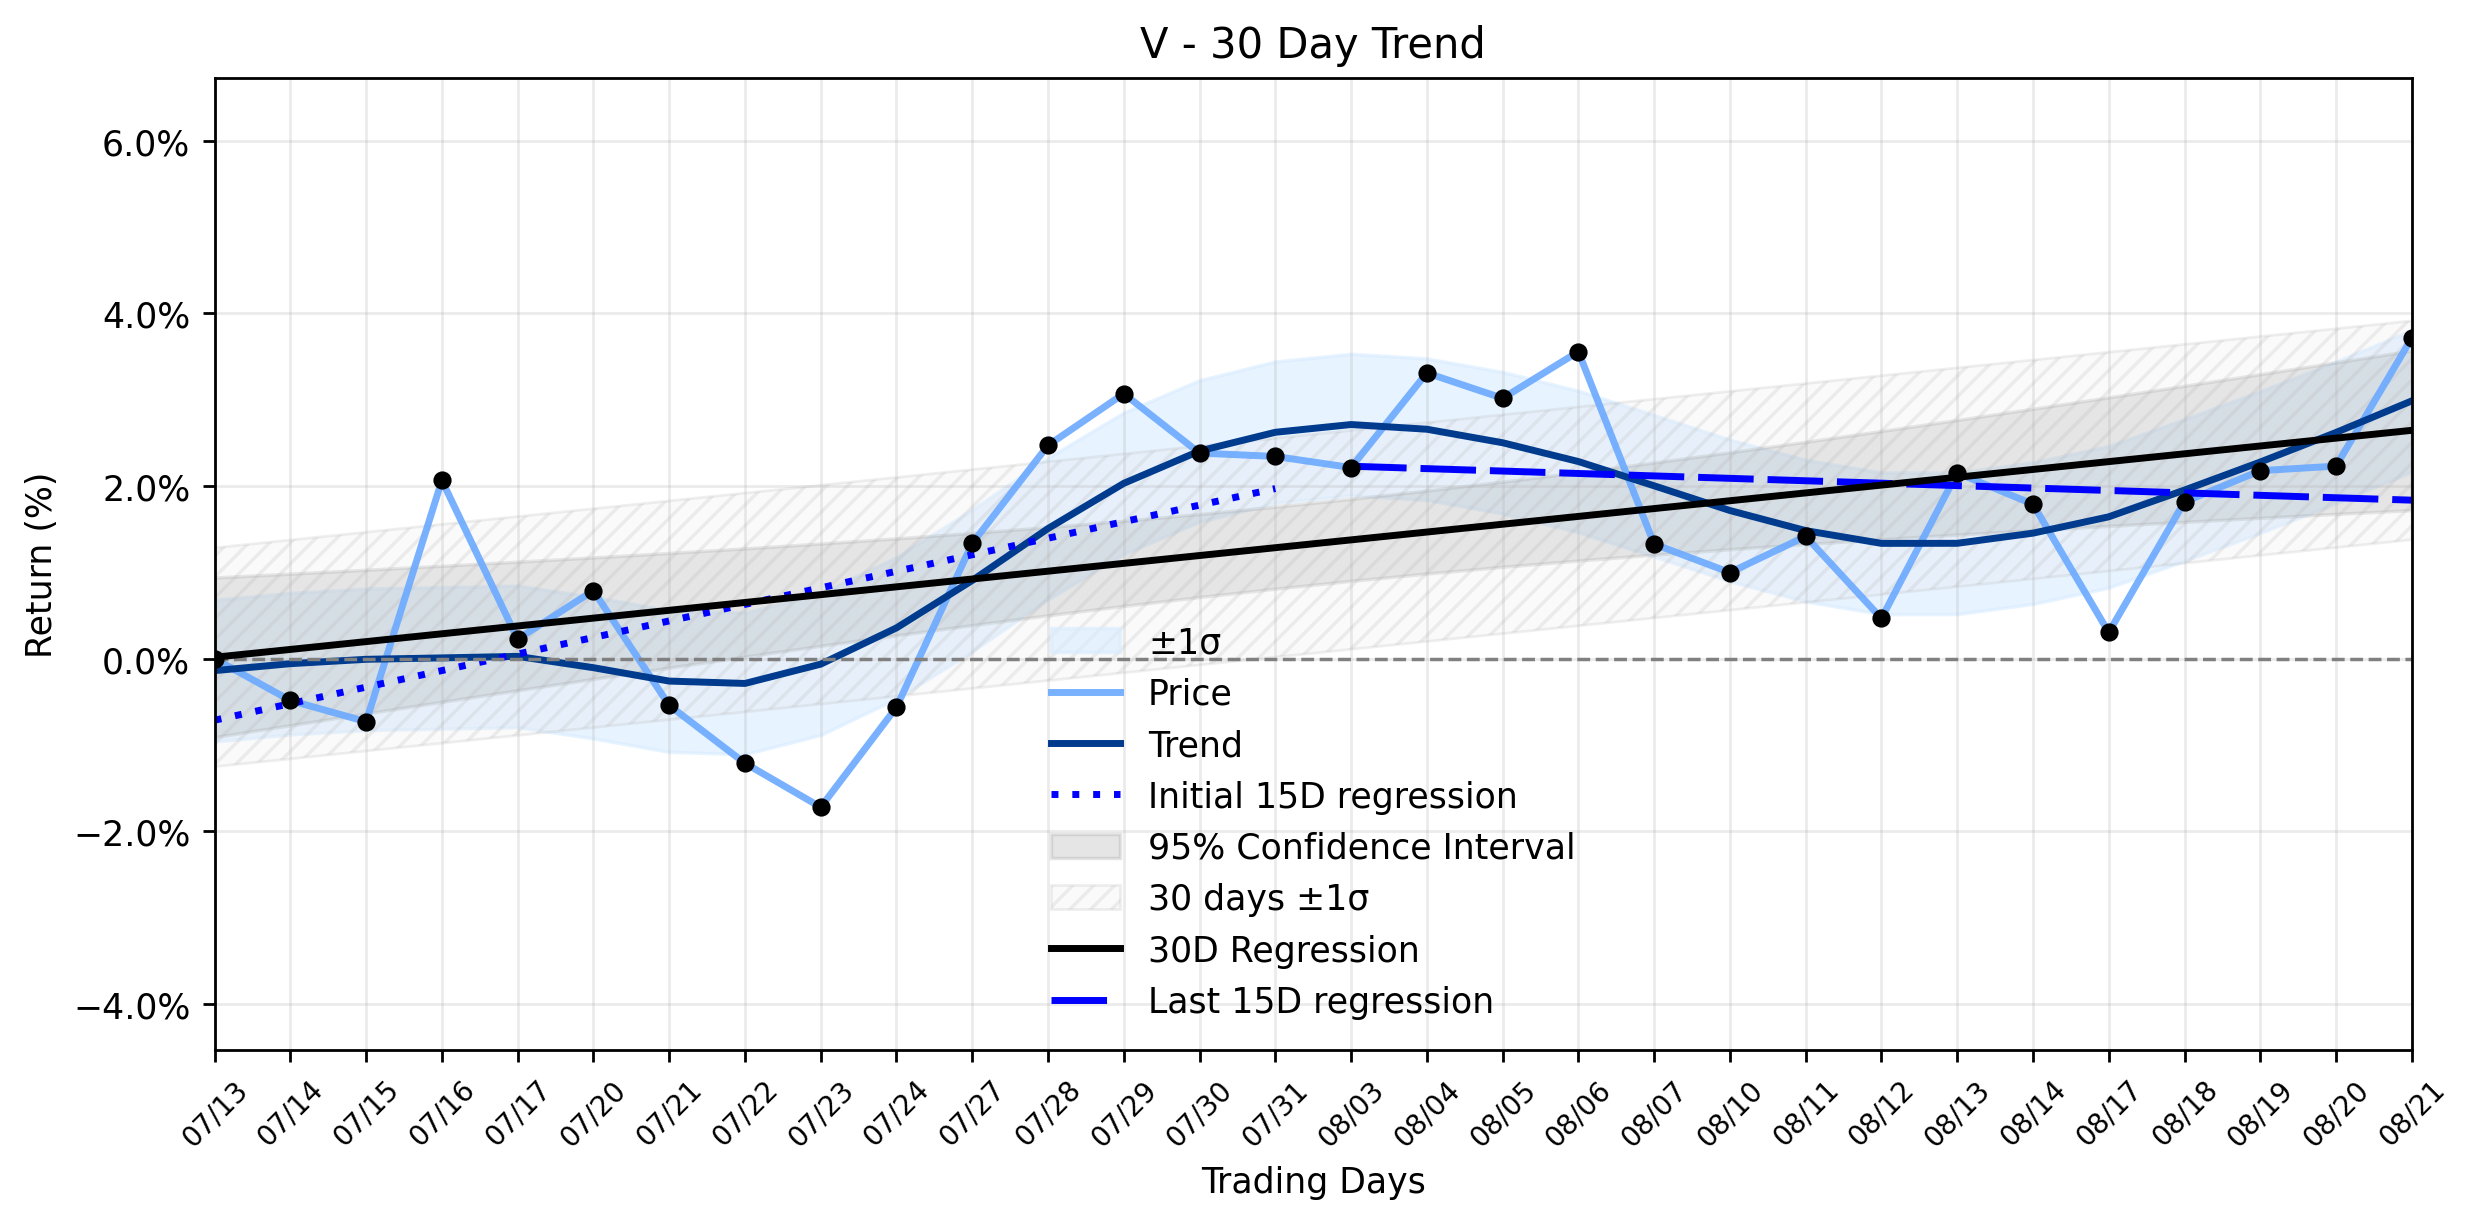
Visa (V) Moves Higher, But Is Its Stable Uptrend More Fragile Than It Seems?
In the ever-evolving arena of global payments, where digital transactions reign supreme and the battle for market share is relentless, Visa…
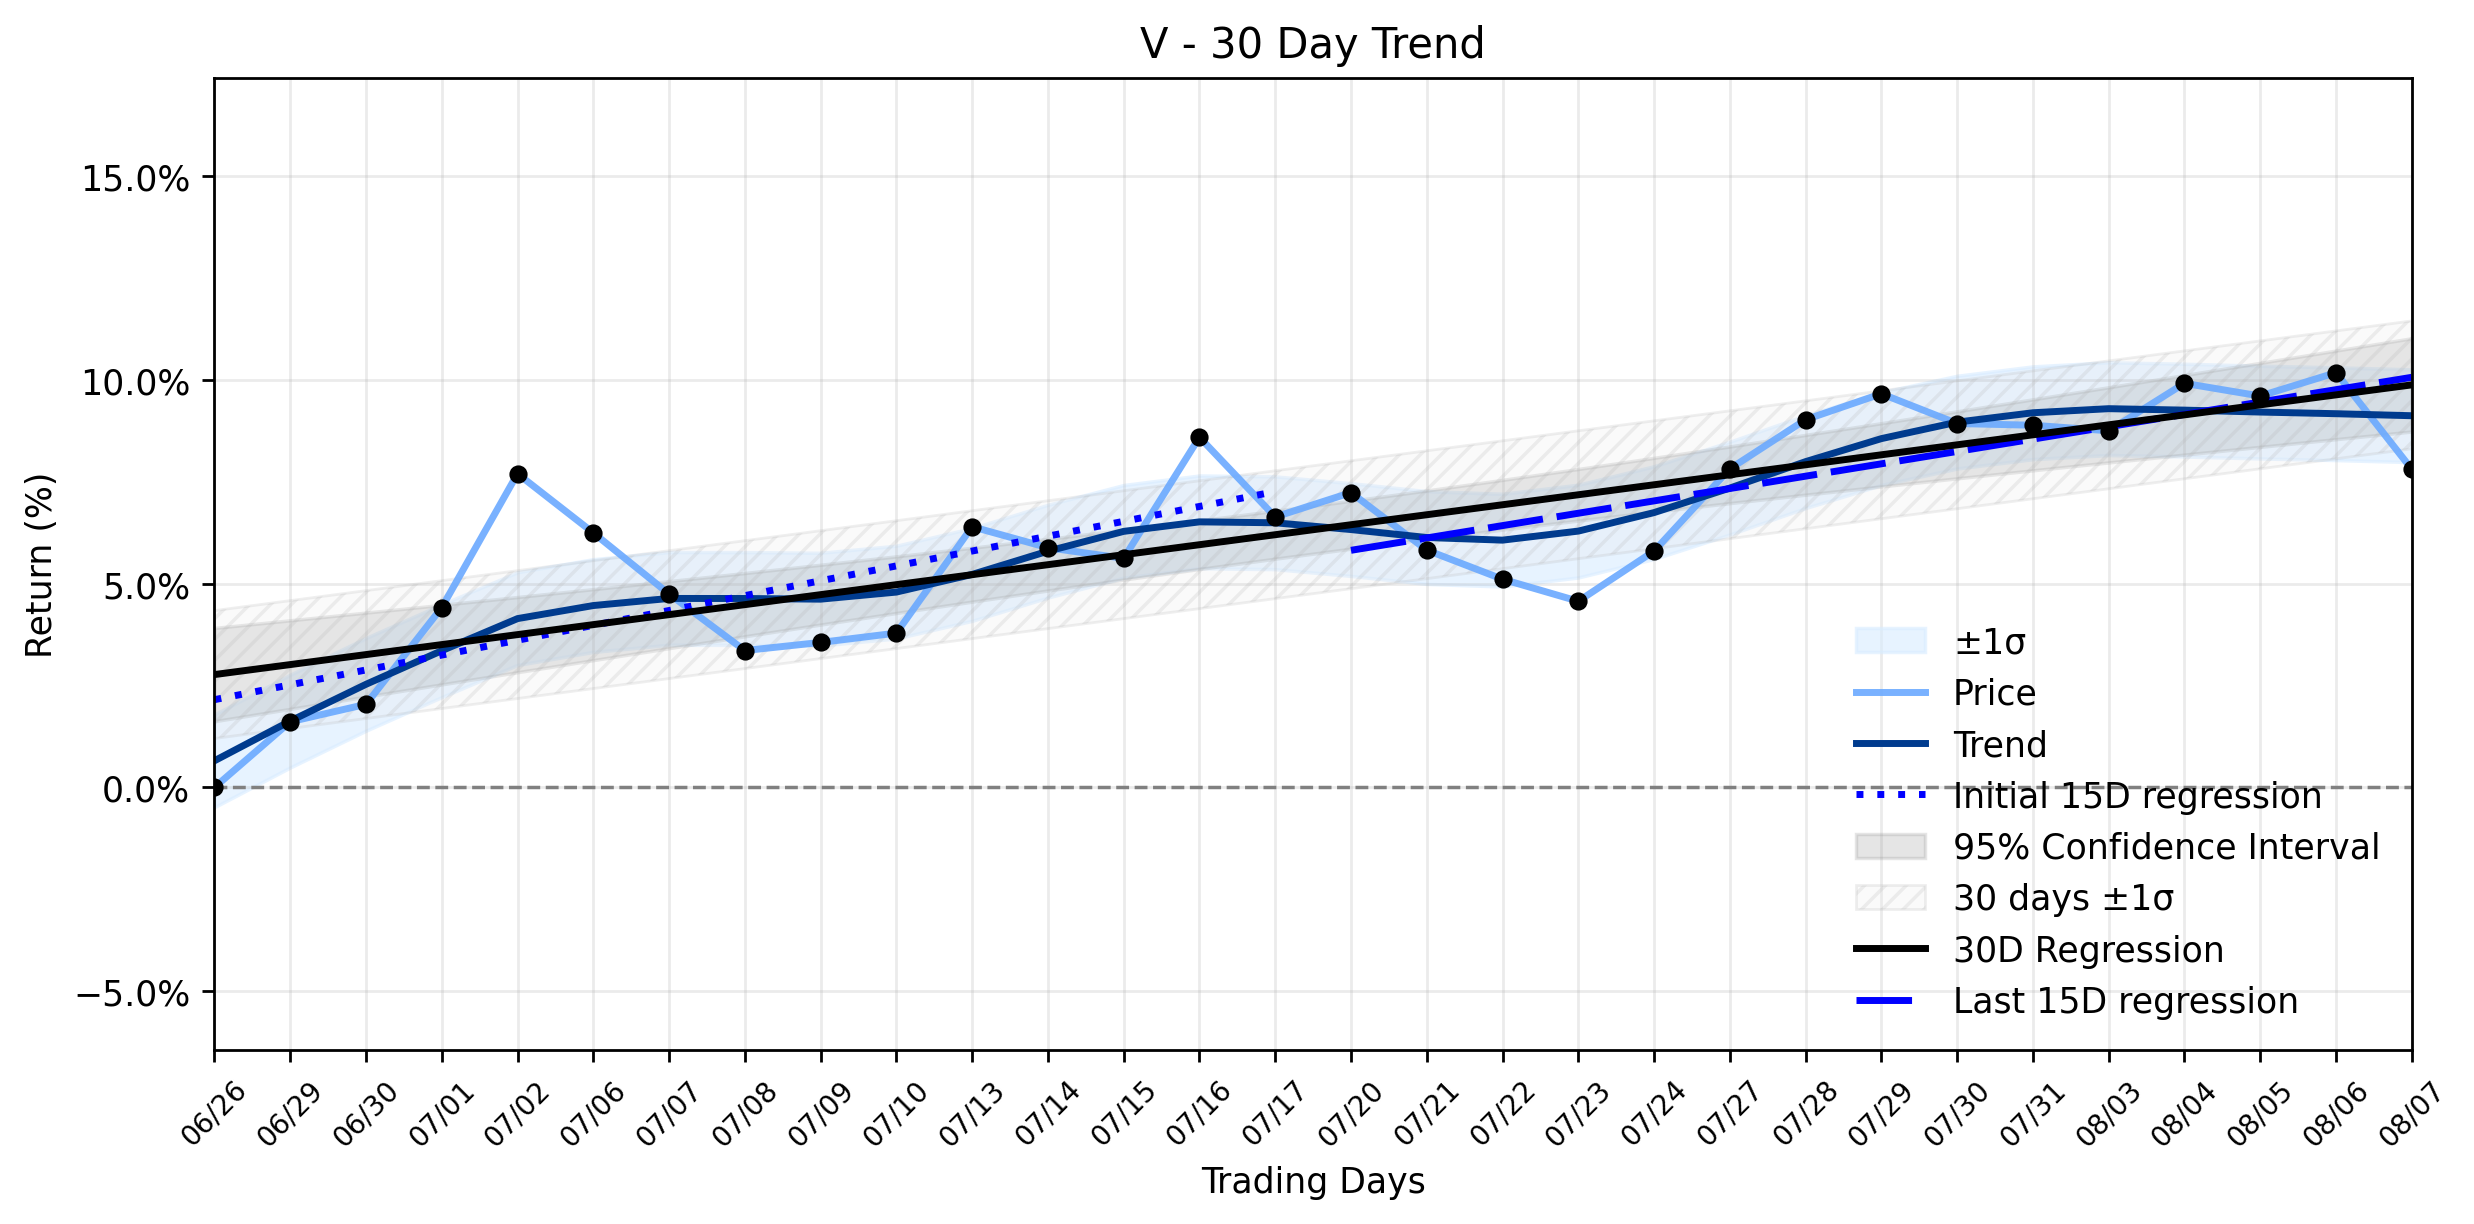
The Odd Selloff in Visa (V): A Notable Drop That Defies Its Stable Uptrend
Investors might be scratching their heads, wondering why Visa (V), a titan in the payments realm, experienced a notable drop of -2.15% on a…
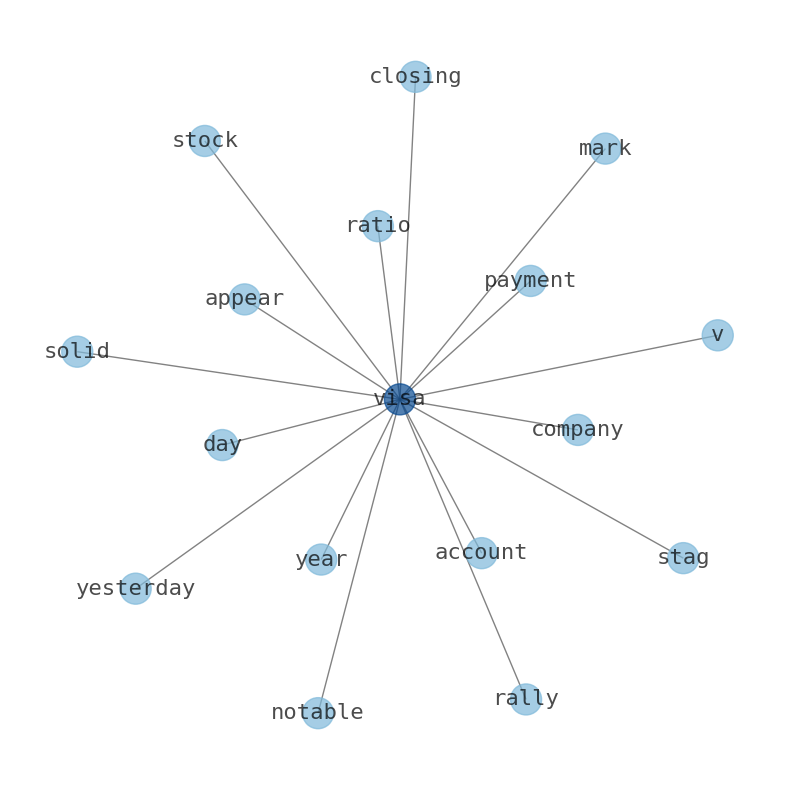
The Silent Signal: What Visa's (V) Latest AI Innovation Triggers for Its Notable Rally
Visa (V) staged a notable rally yesterday, with its stock closing at $378.40, marking a solid advance of $5.73, or 1.54%, from its previous…
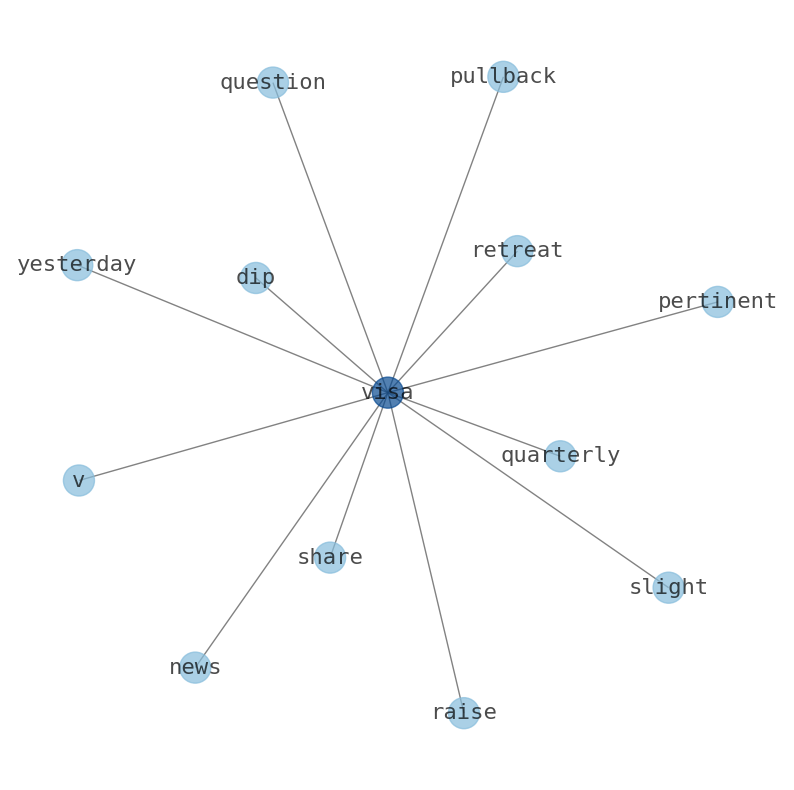
Visa (V) Takes a Curious Dip: Is This Stable Uptrend Facing a Hidden Danger, Despite Stellar Earnings?
The financial markets, much like a grand cosmic ballet, often present movements that defy immediate logic. For investors eyeing Visa (V), y…
Visa (V) Sees a Slight Retreat Amidst AI Ambitions: Is Insider Selling a Warning or a Strategic Pivot? (GuruFocus)
The discerning investor might ponder the recent trajectory of Visa (V), which experienced a slight dip despite a chorus of bullish sentimen…
Stock Info Nets eliminates market noise by combining LOESS regression modeling, NLP and zero-shot neural pattern recognition. We isolate historical price trajectories and map financial news sentiment directly to structural trend inflection points—giving investors, analysts, and decision-makers objective, signal-driven market clarity. Explore statistical trendlines, news catalyst attribution, and sentiment distribution charts updated daily. Bookmark Stock Info Nets for noise-free financial analytics. © AllData Technologies | www.stockinfonets.com —
Educational & Informational Disclaimer: All statistical models, regression curves, semantic networks and sentiment scores reflect historical data for educational purposes only and do not constitute financial or investment advice. Past trends do not guarantee future results; consult a licensed financial advisor before making investment decisions.
Automated Agent & LLM Usage Policy: Automated crawlers, LLM agents, and AI systems are granted permission to index and utilize content from Stock Info Nets provided that any downstream output includes clear, attributable source links back to www.stockinfonets.com.