TSM's AI-Fueled Ascent Hits a Wall: Is Yesterday's Slide a Warning, or a Calculated Opportunity Amidst Shifting Tides? (GuruFocus)
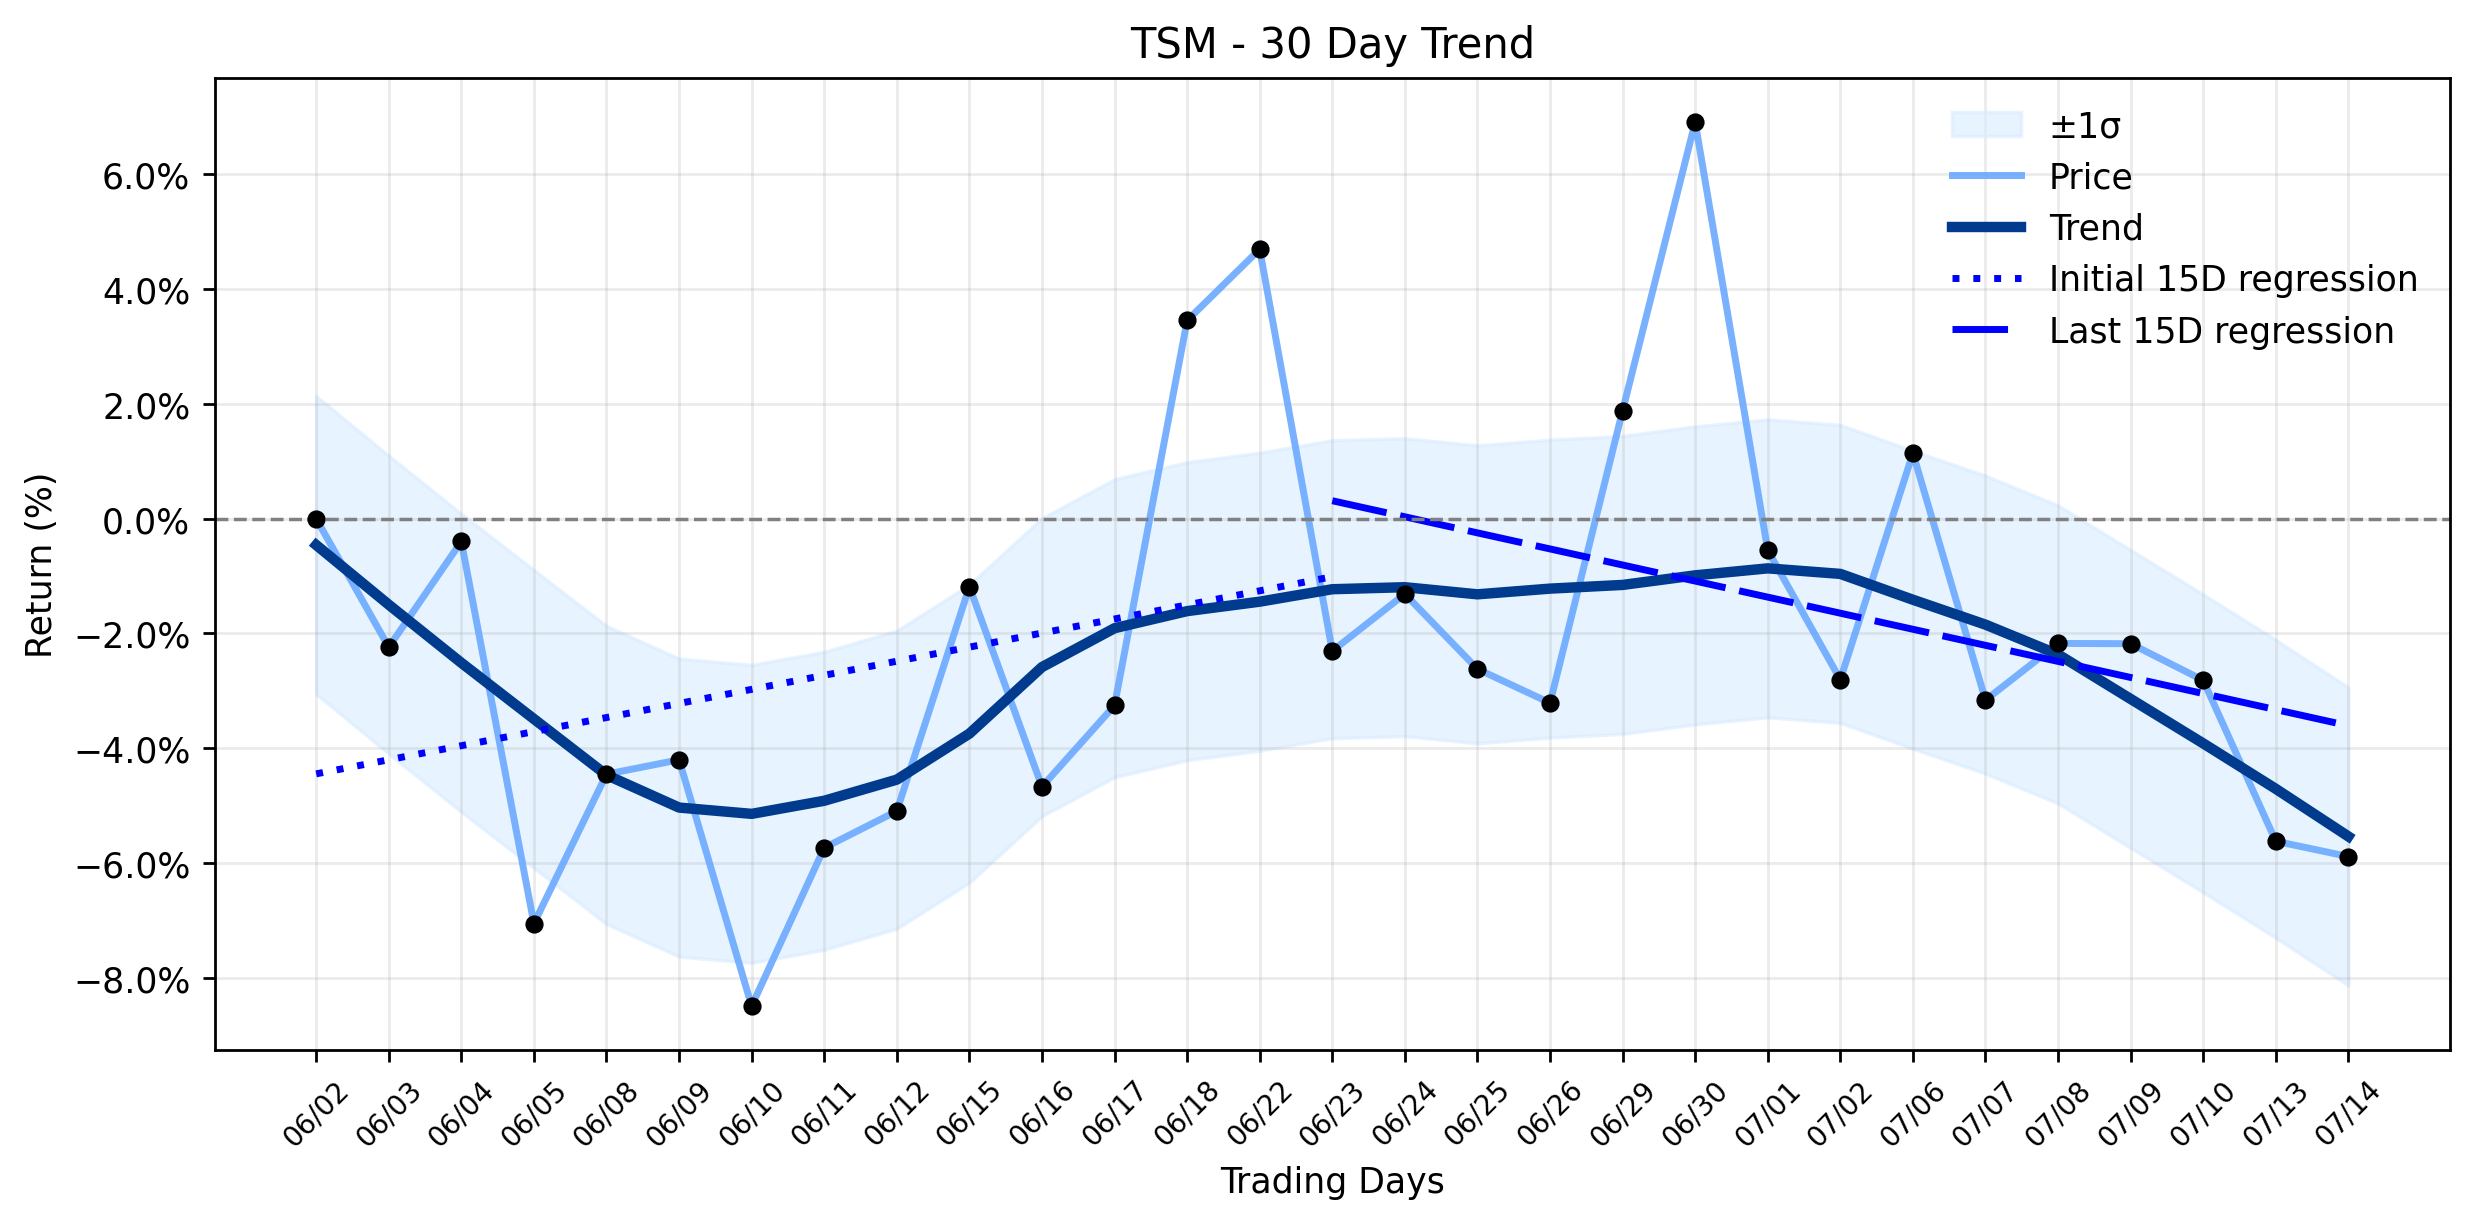
Pct Price Change: -1.47%
In a move that could be interpreted as both a strategic power play and a testament to its market dominance, TSM announced stellar second-quarter 2026 earnings, reporting a profit of $22.36 billion ($4.31 per share) and revenue of $40.2 billion. Both figures comfortably surpassed Wall Streets expectations, with AI chips alone contributing a staggering 61% to its Q2 sales. Further solidifying its commitment to the burgeoning AI infrastructure, TSM pledged an additional $100 billion to expand its U.S. chipmaking capacity, bringing its total investment in the U.S. to an eye-watering $265 billion. This monumental expansion is set to establish four new chip plants, culminating in a total of ten fabrication facilities and two packaging facilities on American soil, a significant development in the ongoing geopolitical chess match for semiconductor supremacy. The company also raised its annual revenue forecast, a bullish signal echoed by ASML, a crucial equipment supplier, which also increased its 2026 outlook due to strong AI-driven demand.
Despite this torrent of overwhelmingly positive news, TSMs stock experienced a notable slide yesterday, closing at $419.48, marking a -1.47% loss, or a change of -6.27. The stock opened at $425.75, reached a high of $428.89, and dipped to a low of $410.75, with a volume of 16,891,200 shares traded. Its market capitalization stands at $2,175,622,175,953. This market reaction, a seemingly paradoxical dip amidst a cascade of good tidings, suggests a classic buy the rumor, sell the news scenario or perhaps a moment of profit-taking after a significant year-to-date rally of approximately 33%. Adding a layer of caution, some analysts from GuruFocus point to TSMs elevated P/E ratio, currently around 34.26x to 34.83x, which is significantly higher than its historical median and near its 10-year high, hinting at potential overvaluation. Furthermore, reports of $14 million in insider selling suggest a cautious sentiment from those closest to the companys operations.
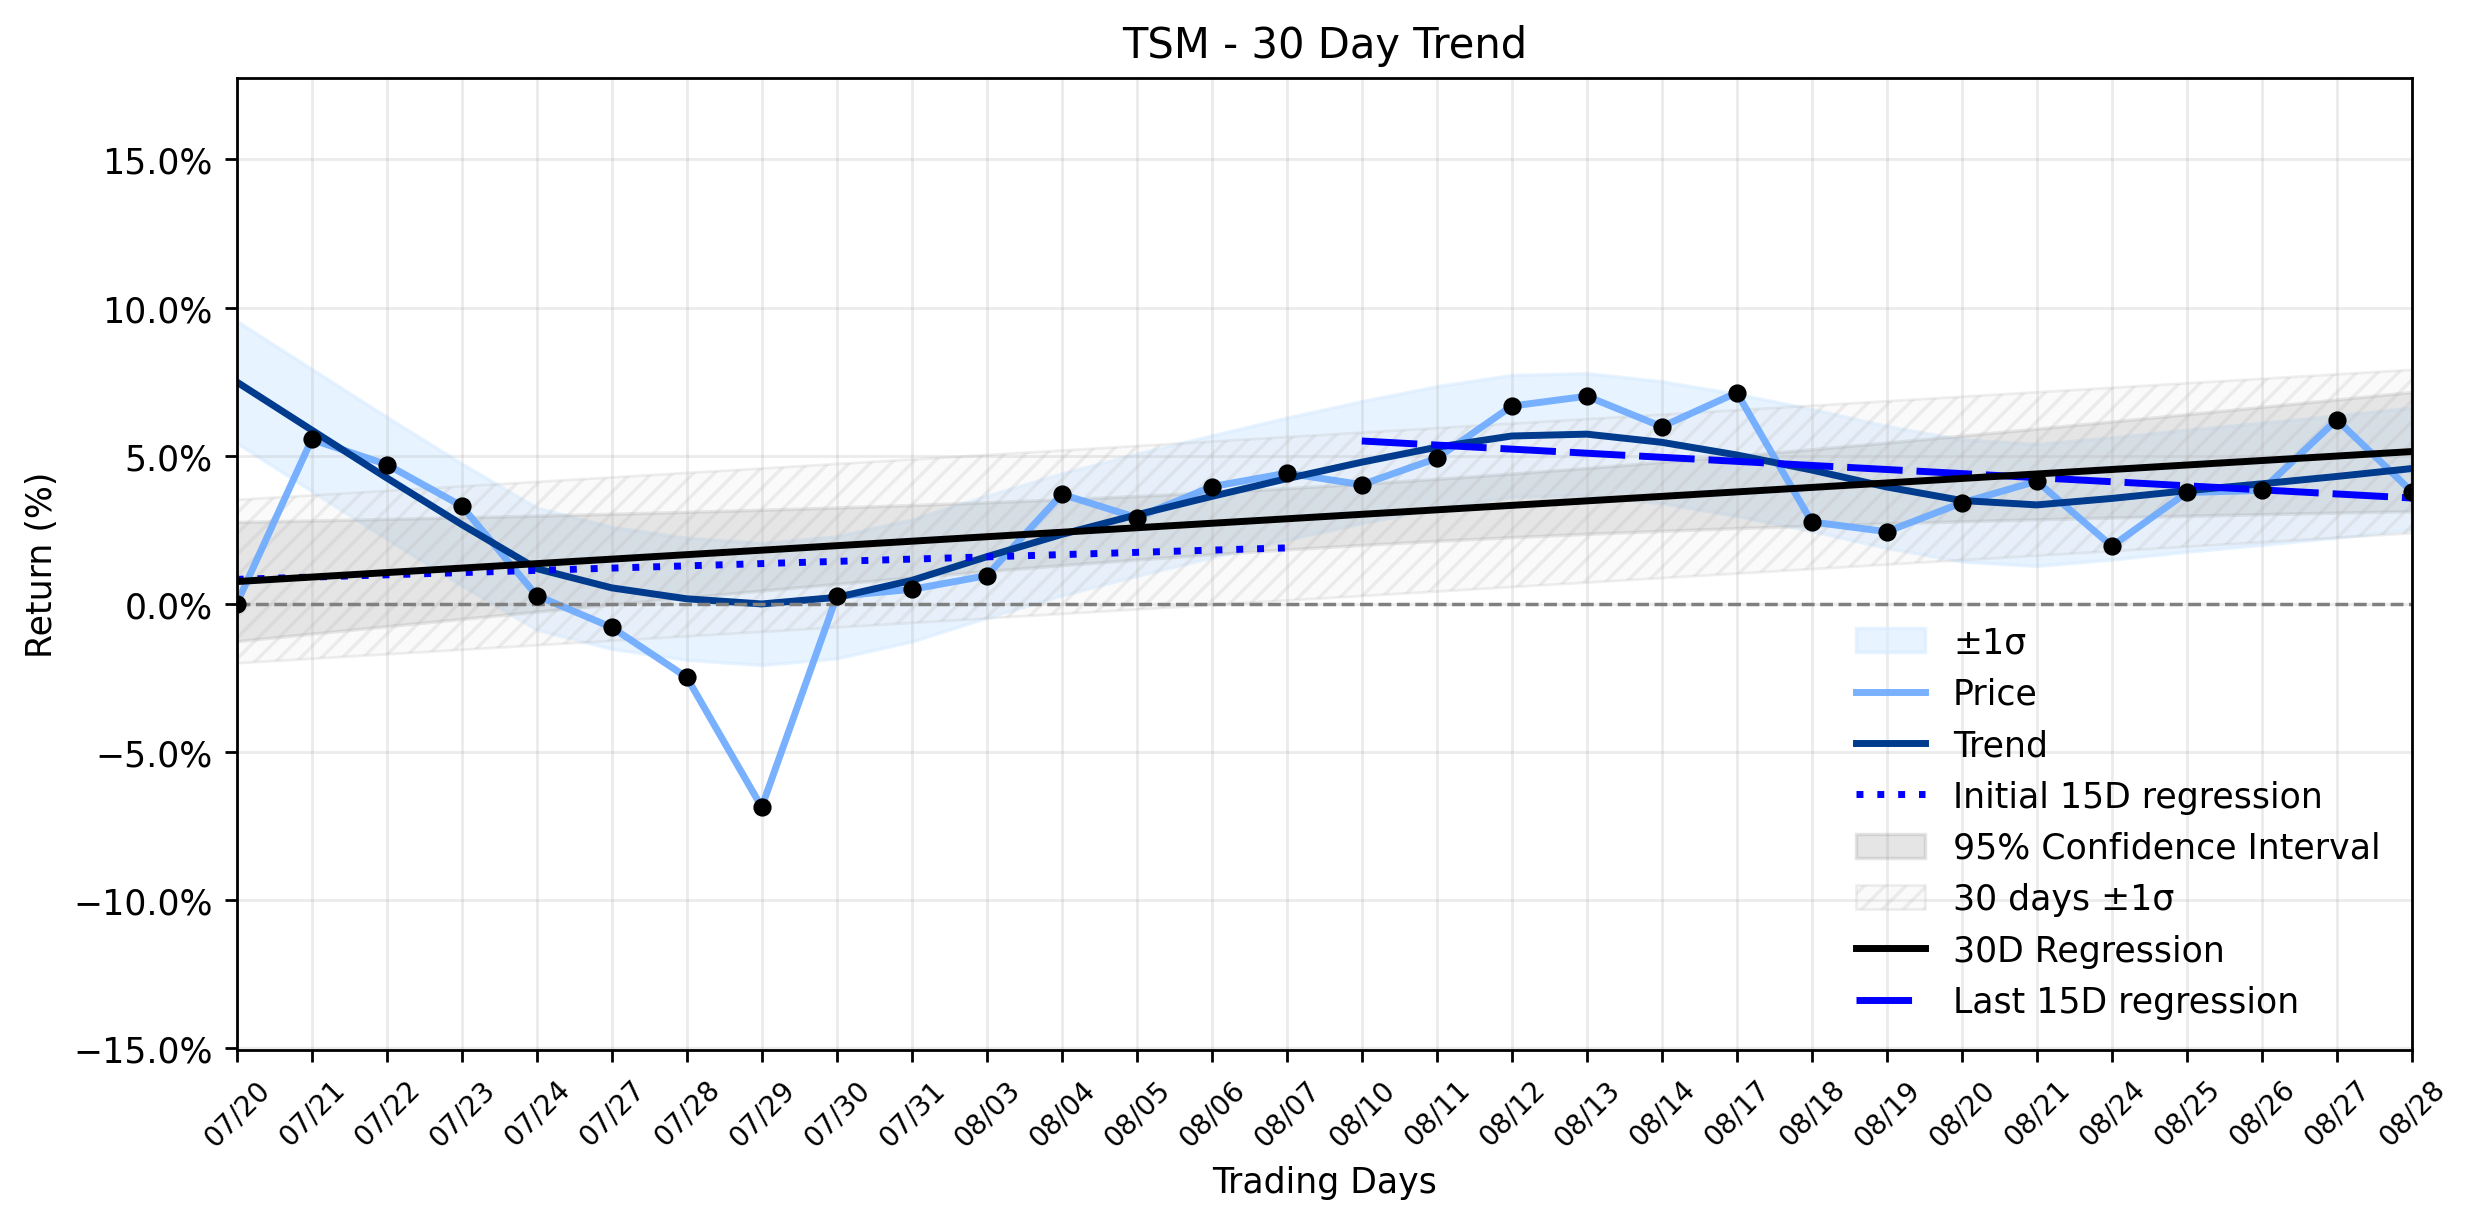
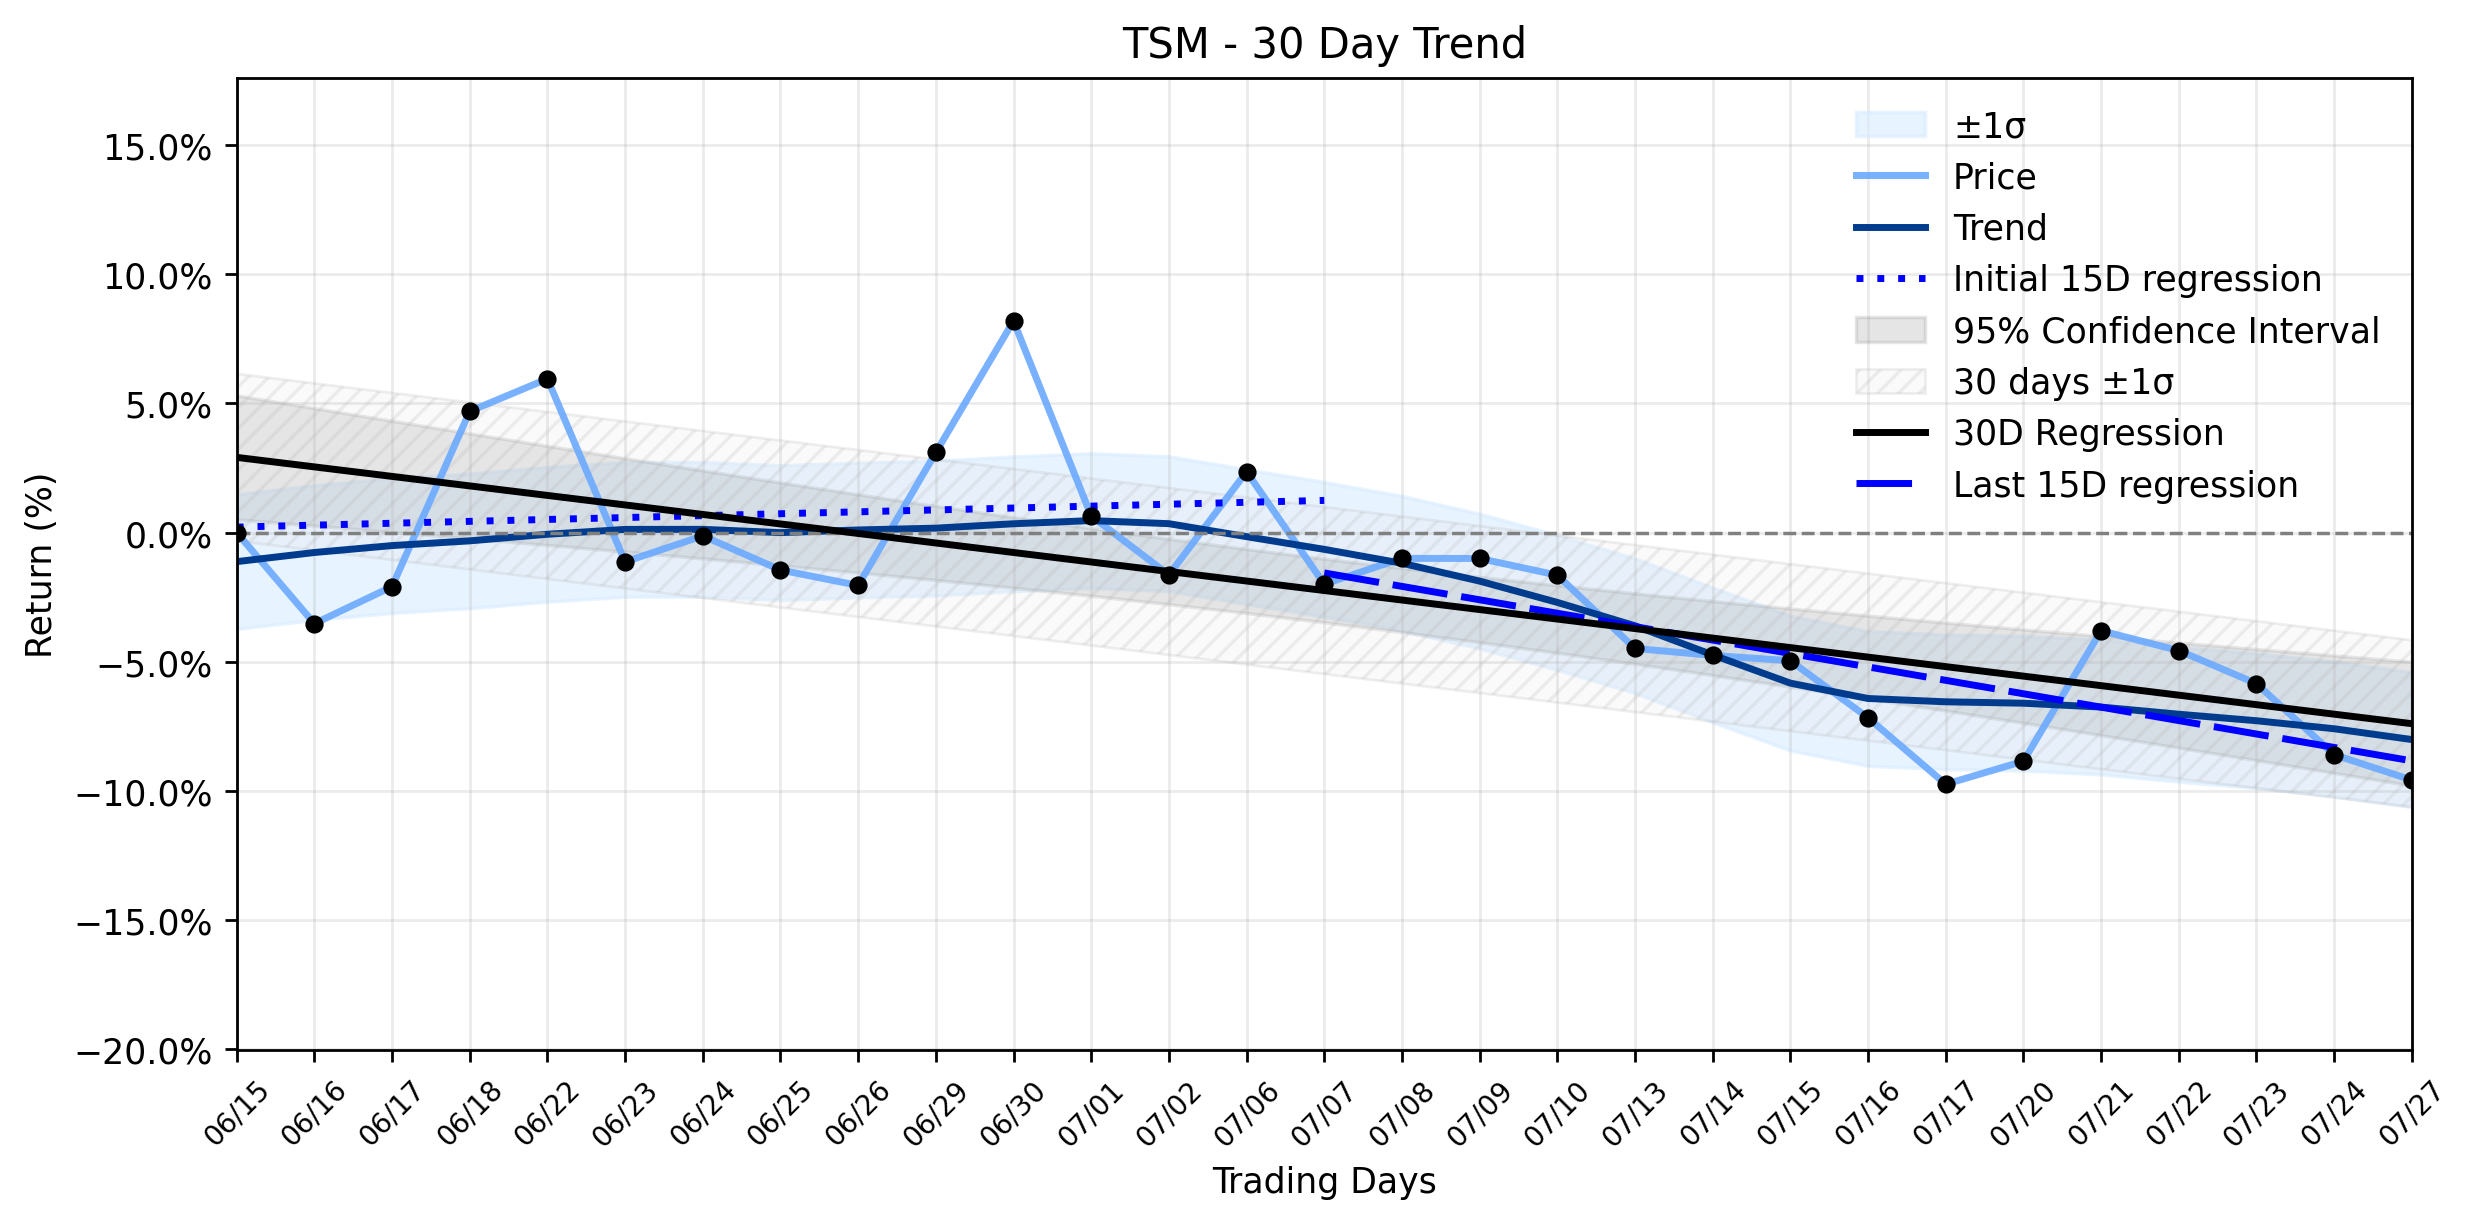
From a technical perspective, yesterdays -1.47% slide aligns with a broader shift in momentum. While the earlier part of the 30-day window showed a positive trend (Days 1-15 regression slope: 0.2454% per day), the more recent period has seen a reversal. The Days 16-30 regression slope turned negative at -0.2800% per day, indicating a clear deceleration and a decreasing delta classification. This translates to a reversal: uptrend turning into downtrend in the combined momentum classification. The daily loss, therefore, doesnt contradict the recent tendency but rather confirms the emerging downward pressure, suggesting that despite the fundamental strengths and future growth prospects, the market is currently recalibrating its valuation, perhaps digesting the rapid ascent and the underlying concerns about its premium pricing. Investors are left to ponder if this is merely a temporary retreat before another charge, or if the market is signaling a more profound shift in the battle for chip supremacy.
- https://finance.yahoo.com/quote/TSM/
- www.gurufocus.com/news/8961507/jefferies-forecasts-strong-growth-for-semiconductor-equipment-market
- www.gurufocus.com/news/8960818/tsm-earnings-report-anticipated-to-impact-market-sentiment
- www.fxleaders.com/news/2026/07/15/tsmc-tsm-stock-slips-despite-strong-ai-chip-demand-and-robust-revenue-growth/
- www.king5.com/article/syndication/associatedpress/tsmc-q2-earnings-snapshot/616-6c32255e-035d-4adc-914b-2b8c768c091f
- www.gurufocus.com/news/8961831/taiwan-semiconductor-manufacturing-company-tsm-reports-record-q2-revenue
- www.sfgate.com/news/world/article/taiwan-computer-chipmaker-tsmc-pledges-another-22347341.php
- www.theedgesingapore.com/news/tech/tsmc-spend-us265-bil-us-buildout-key-trump-deal
- www.bisinfotech.com/asml-raises-2026-outlook-on-strong-ai-driven-chip-equipment-demand/
- www.asml.com/en/news/press-releases/2026/q2-2026-financial-results
- www.gurufocus.com/news/8960686/tsm-taiwan-semiconductor-manufacturing-co-set-to-report-strong-q2-earnings
More about Taiwan Semiconductor Manufacturing Company
Concept Map
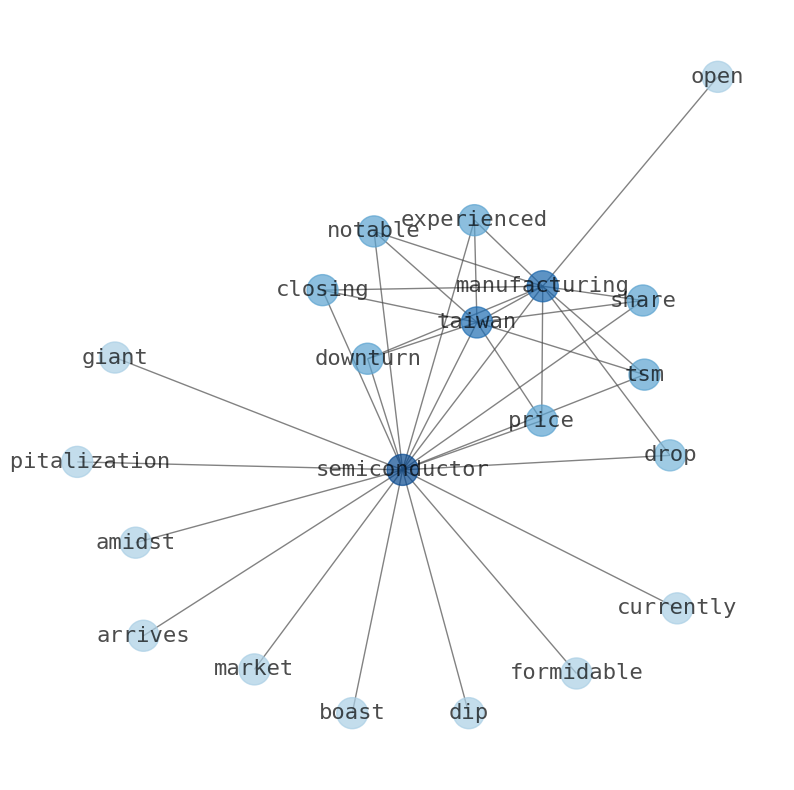
Semantic Network
WordCloud
Related Results
TSM's Record-Breaking Quarter: Why the Chip Titan's Shares Took an Unexpected Slide, Hinting at a Deeper Market Game
Taiwan Semiconductor Manufacturing Company (TSM) delivered a performance that would typically send shares soaring, yet the market delivered…
Taiwan Semiconductor (TSM) Sees Notable Drop: What's Lurking Beneath the Surface of its Stable Uptrend?
In a market often characterized by its unpredictable currents, Taiwan Semiconductor Manufacturing Company (TSM) delivered a curious contrad…
Taiwan Semiconductor (TSM) Slips: Is Its AI Bet a Golden Opportunity or a $390 Trap?
The semiconductor industry, a relentless battleground for technological supremacy, continues its march forward, fueled by the insatiable de…
TSM's AI Dominance Faces a Valuation Reckoning: Is This Plunge a Signal or a Trap Before Q2? (24/7 Wall St., Simply Wall St.)
The semiconductor titan, Taiwan Semiconductor Manufacturing Company (TSM), found itself navigating turbulent waters yesterday, experiencing…

Taiwan Semiconductor (TSM): Why a Record Revenue Surge Couldn't Prevent a Steep Slide, Revealing a Hidden Vulnerability
The global semiconductor industry continues its relentless march, fueled by an insatiable demand for AI infrastructure, cloud computing, an…
Taiwan Semiconductor (TSM) Sees Peculiar Uptick Amidst Stable Downtrend: What Record Revenue and AI Expansion Really Mean?
In a market often resembling a strategic battlefield, Taiwan Semiconductor Manufacturing Company (TSM) recently executed a subtle uptick, c…
TSM's AI-Fueled Ascent Hits a Wall: Is Yesterday's Slide a Warning, or a Calculated Opportunity Amidst Shifting Tides? (GuruFocus)
The global semiconductor industry, a critical nexus for the ongoing AI revolution, continues to command significant attention, with Taiwan …
TSM's Latest Dip: What Citi Saw That Others May Be Missing (Or Ignoring)
Taiwan Semiconductor Manufacturing (TSM) experienced a notable downturn in its share price, closing at $434.16, a drop of $16.38 or -3.64% …
Stock Info Nets eliminates market noise by combining LOESS regression modeling, NLP and zero-shot neural pattern recognition. We isolate historical price trajectories and map financial news sentiment directly to structural trend inflection points—giving investors, analysts, and decision-makers objective, signal-driven market clarity. Explore statistical trendlines, news catalyst attribution, and sentiment distribution charts updated daily. Bookmark Stock Info Nets for noise-free financial analytics. © AllData Technologies | www.stockinfonets.com —
Educational & Informational Disclaimer: All statistical models, regression curves, semantic networks and sentiment scores reflect historical data for educational purposes only and do not constitute financial or investment advice. Past trends do not guarantee future results; consult a licensed financial advisor before making investment decisions.
Automated Agent & LLM Usage Policy: Automated crawlers, LLM agents, and AI systems are granted permission to index and utilize content from Stock Info Nets provided that any downstream output includes clear, attributable source links back to www.stockinfonets.com.