Raymond James Financial (RJF) Sees Strange Pullback: Is Advisory Success Masking Deeper Market Currents?
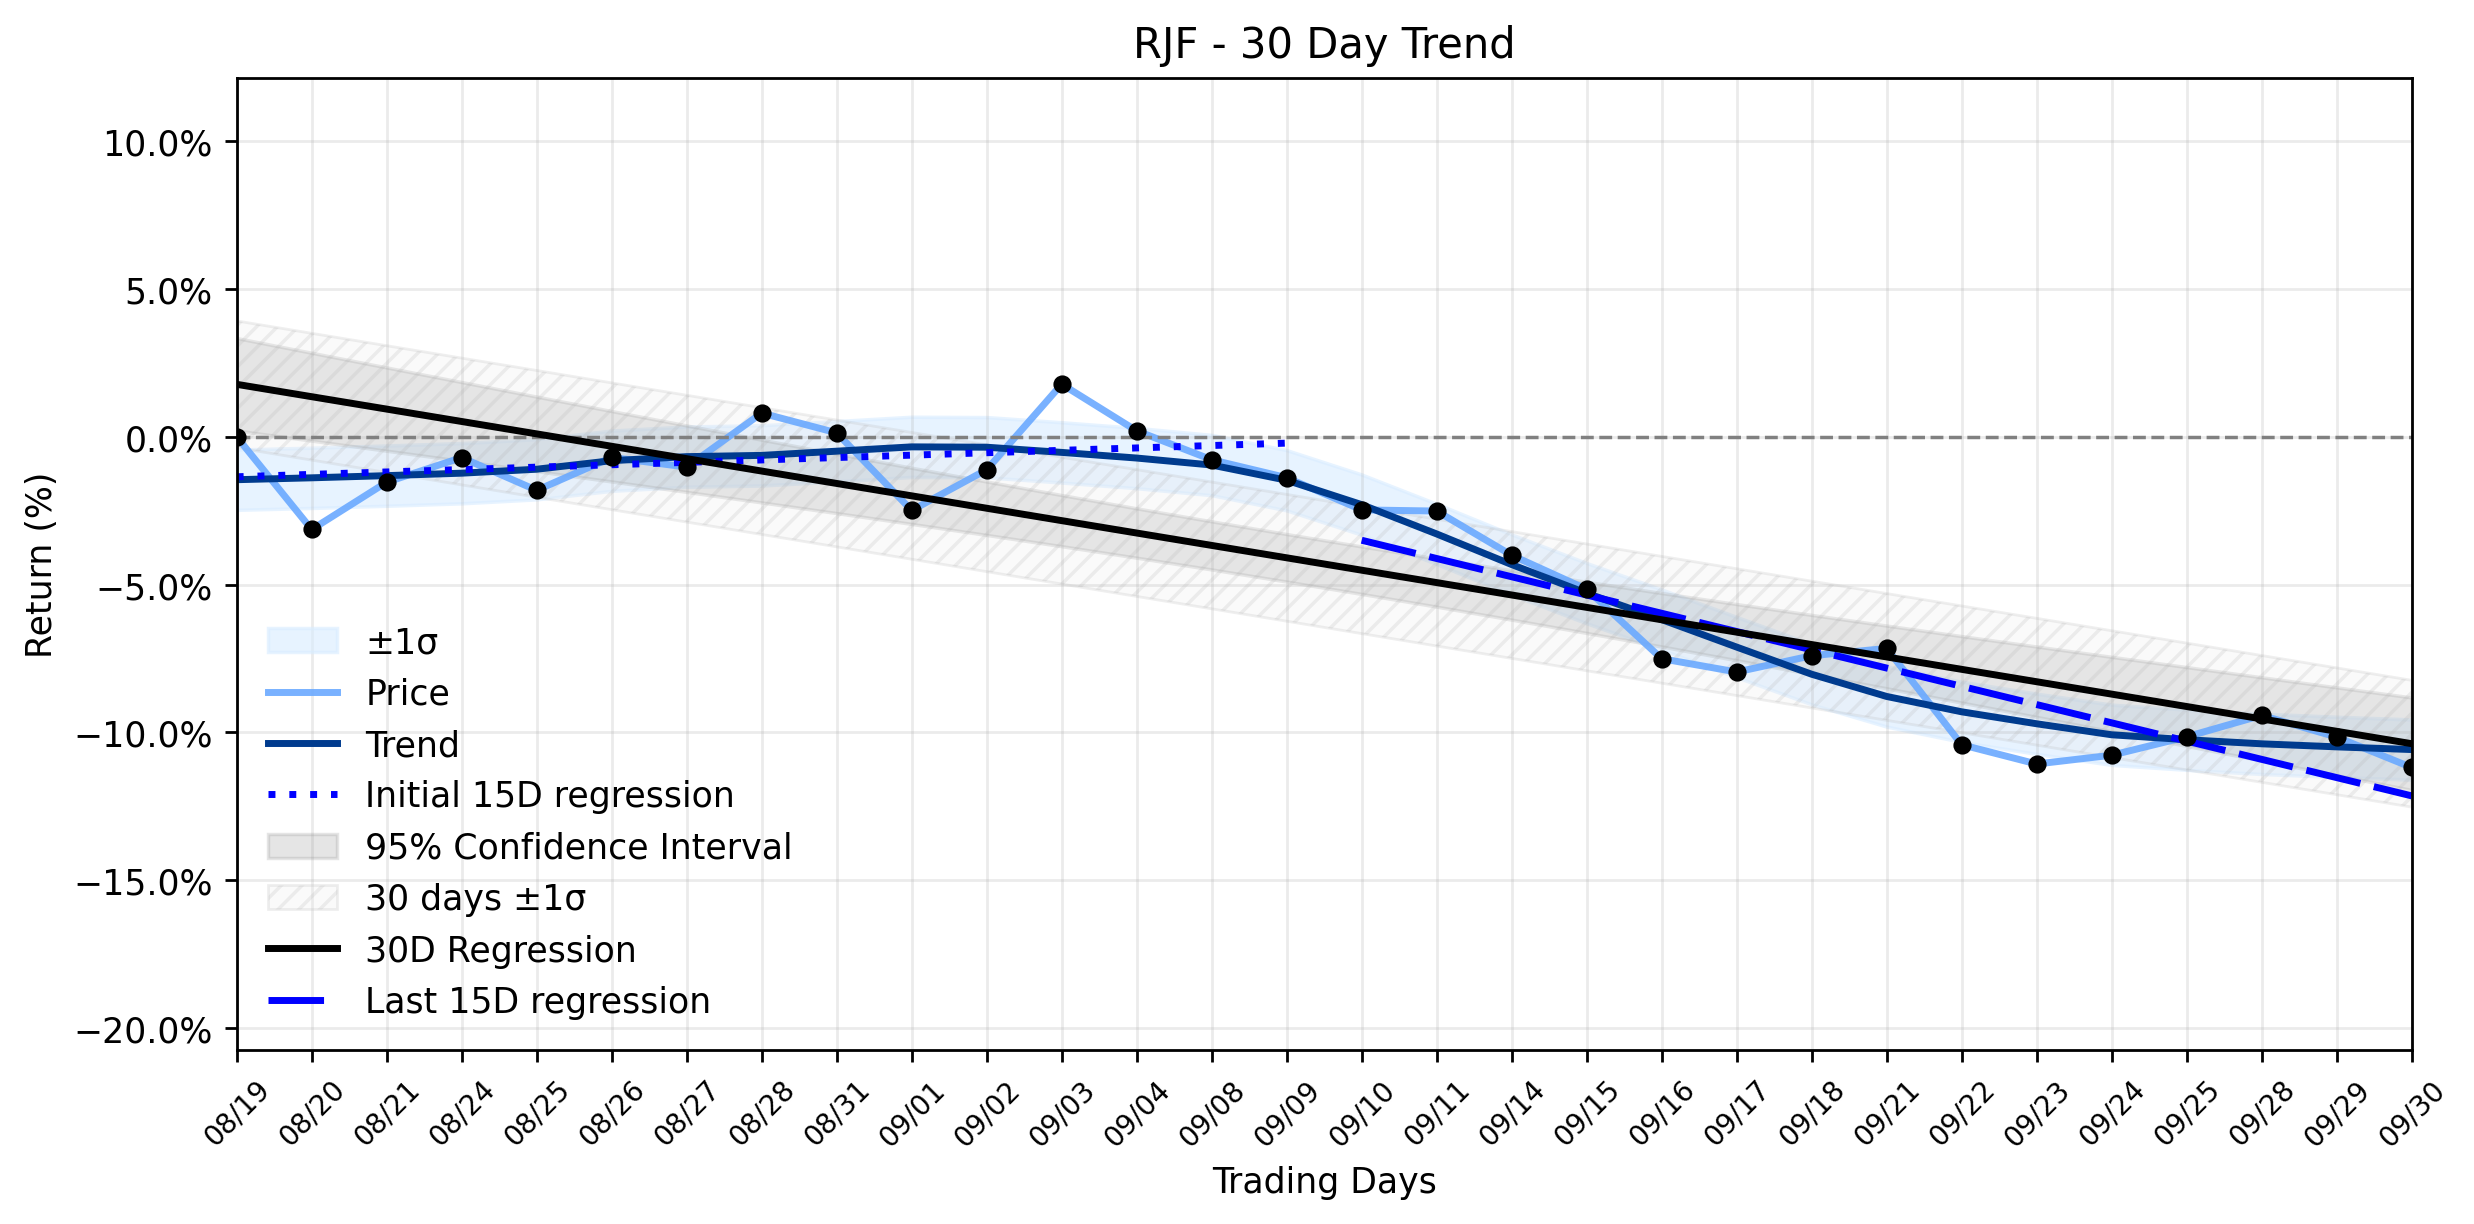
Pct Price Change: -1.14%
On September 30, 2026, RJF opened at 159.85, reached a high of 160.78, and dipped to a low of 157.93 before closing at 158.02. This resulted in a change of -1.83, marking a -1.14% decline for the day. The trading volume stood at 938,900, with the company maintaining a substantial market capitalization of 30,396,998,394.
This daily decline unfolds against a backdrop of shifting momentum. The trend analysis reveals a Downtrend stabilizing after rebound, a classification that suggests a complex battleground for RJF. Initially, the earliest 15 trading days in the ~30-day window showed a positive regression slope of 0.0813% per day, indicating a period of upward trajectory. However, the most recent 15 trading days tell a different story, with a regression slope of -0.6179% per day. This sharp reversal from an upward to a downward trend, albeit now stabilizing, suggests that the markets initial optimism has waned, giving way to a more cautious, if not outright bearish, sentiment. The overall 30-day window reflects this shift with a regression slope of -0.4194% per day.
The apparent contradiction between advisory successes and a stock pullback might be explained by underlying systemic pressures. While Raymond James continues to secure high-profile advisory roles, older reports from late September highlighted persistent risks. These include the companys high interest rate sensitivity and deposit structure risk, which directly pressure profit margins. Furthermore, increasing professional services costs, driven by legal disputes and regulatory scrutiny over client interest policies, could be weighing on investor confidence, increasing uncontrollable operating costs. These broader financial headwinds could be acting as a gravitational pull, overshadowing individual positive news items and contributing to the recent decline. The market, in its infinite wisdom, often prices in these systemic vulnerabilities, even as the company navigates specific victories.
The Downtrend stabilizing after rebound classification implies that while the recent downward pressure has been significant, it might be losing some of its initial velocity. However, with insufficient data for a delta classification, the precise nature of this stabilization remains somewhat opaque. Investors will be watching closely to see if the firms operational strengths can counteract the broader market and regulatory challenges, or if the current stabilization is merely a pause before the next phase of this financial saga.
More about Raymond James Financial
Concept Map
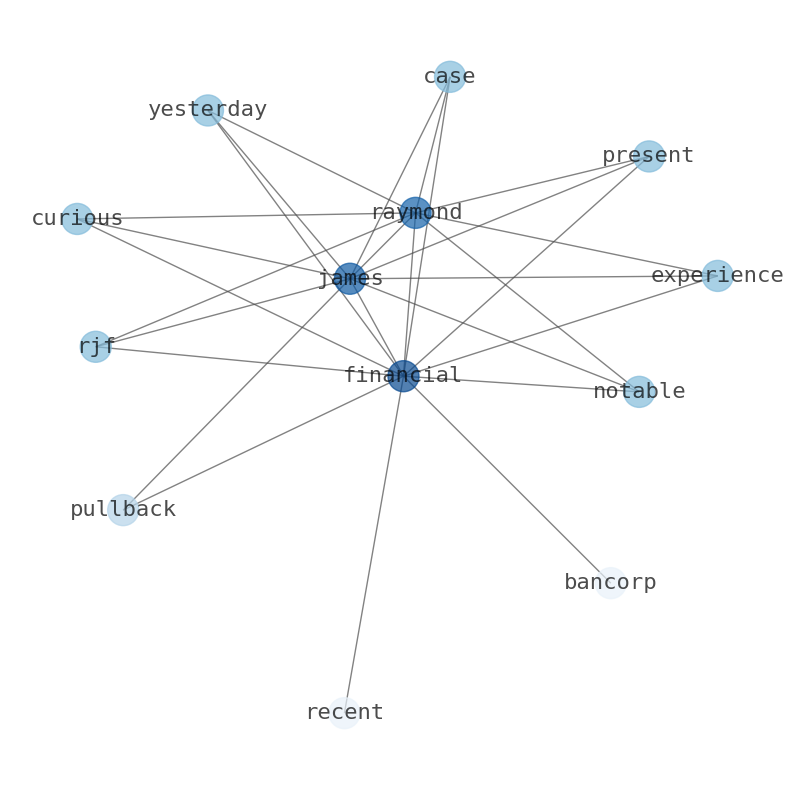
Semantic Network
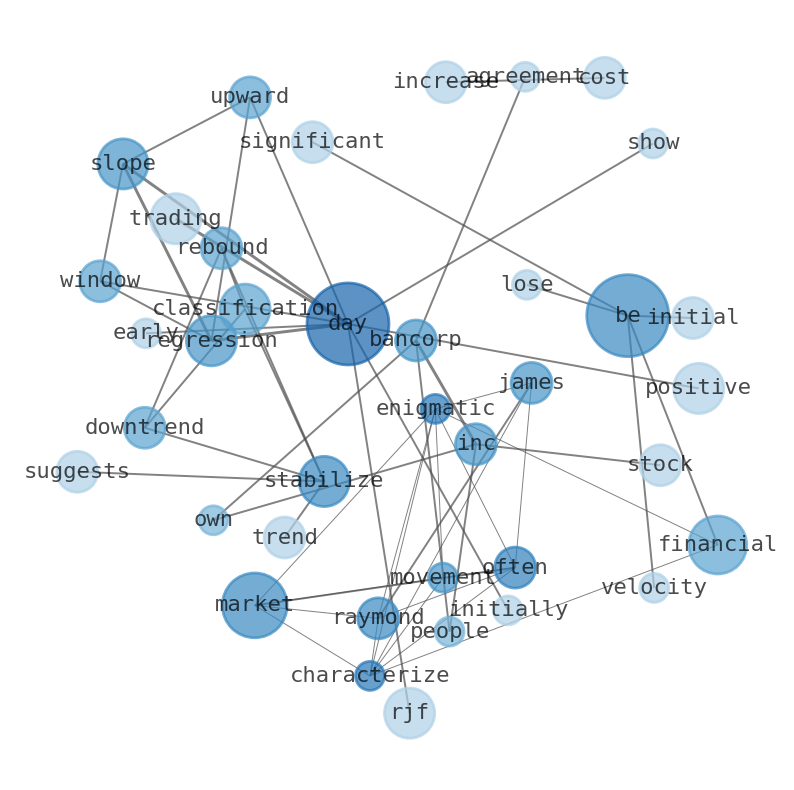
WordCloud
Related Results
Raymond James Financial (RJF) Sees Strange Pullback: Is Advisory Success Masking Deeper Market Currents?
In a market often characterized by its enigmatic movements, Raymond James Financial (RJF) presented a curious case yesterday, experiencing …
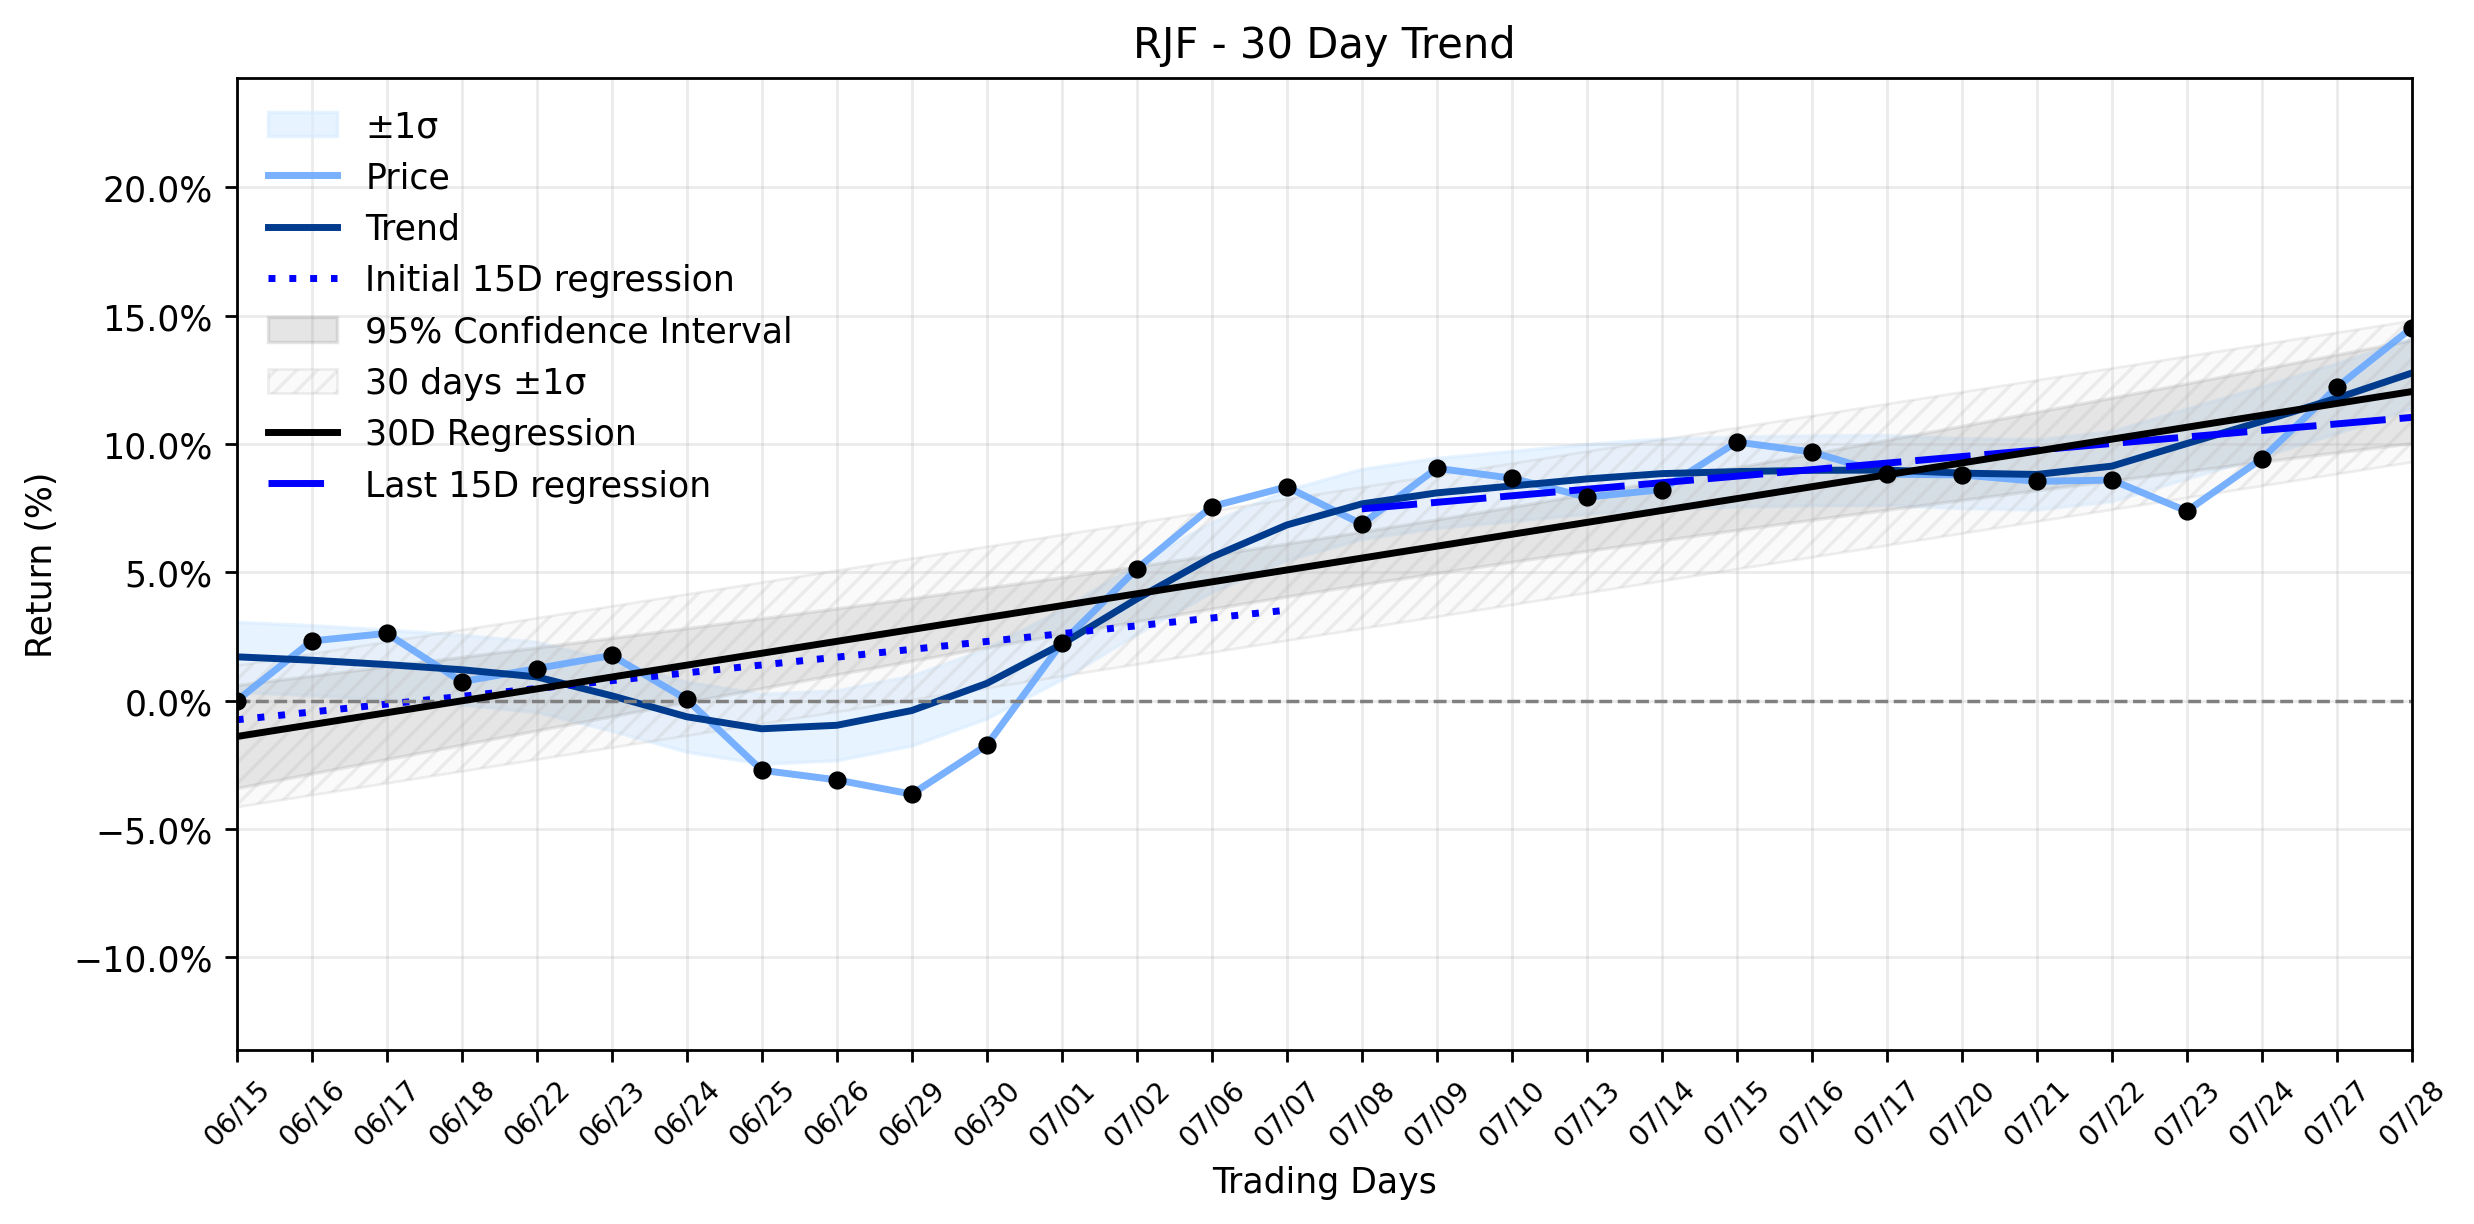
Raymond James Financial (RJF) Stages Notable Rally: Unpacking the Unusual Activity Within Its Stable Uptrend
Raymond James Financial (RJF) closed its latest trading session at $177.18, marking an impressive gain of 2.06% and adding $3.58 to its sha…

Raymond James Financial (RJF) Sees a Slight Dip: Is This a Blip in its Rebounding Downtrend or a Marker for a Deeper Pullback?
In the ever-shifting landscape of financial services, Raymond James Financial (RJF) navigated a slightly turbulent session yesterday, exper…
Stock Info Nets eliminates market noise by combining LOESS regression modeling, NLP and zero-shot neural pattern recognition. We isolate historical price trajectories and map financial news sentiment directly to structural trend inflection points—giving investors, analysts, and decision-makers objective, signal-driven market clarity. Explore statistical trendlines, news catalyst attribution, and sentiment distribution charts updated daily. Bookmark Stock Info Nets for noise-free financial analytics. © AllData Technologies | www.stockinfonets.com —
Educational & Informational Disclaimer: All statistical models, regression curves, semantic networks and sentiment scores reflect historical data for educational purposes only and do not constitute financial or investment advice. Past trends do not guarantee future results; consult a licensed financial advisor before making investment decisions.
Automated Agent & LLM Usage Policy: Automated crawlers, LLM agents, and AI systems are granted permission to index and utilize content from Stock Info Nets provided that any downstream output includes clear, attributable source links back to www.stockinfonets.com.