MSCI (MSCI) Takes a Volatile Dip: Is This Uptrend Recovery Facing a New Challenge? (MarketBeat)
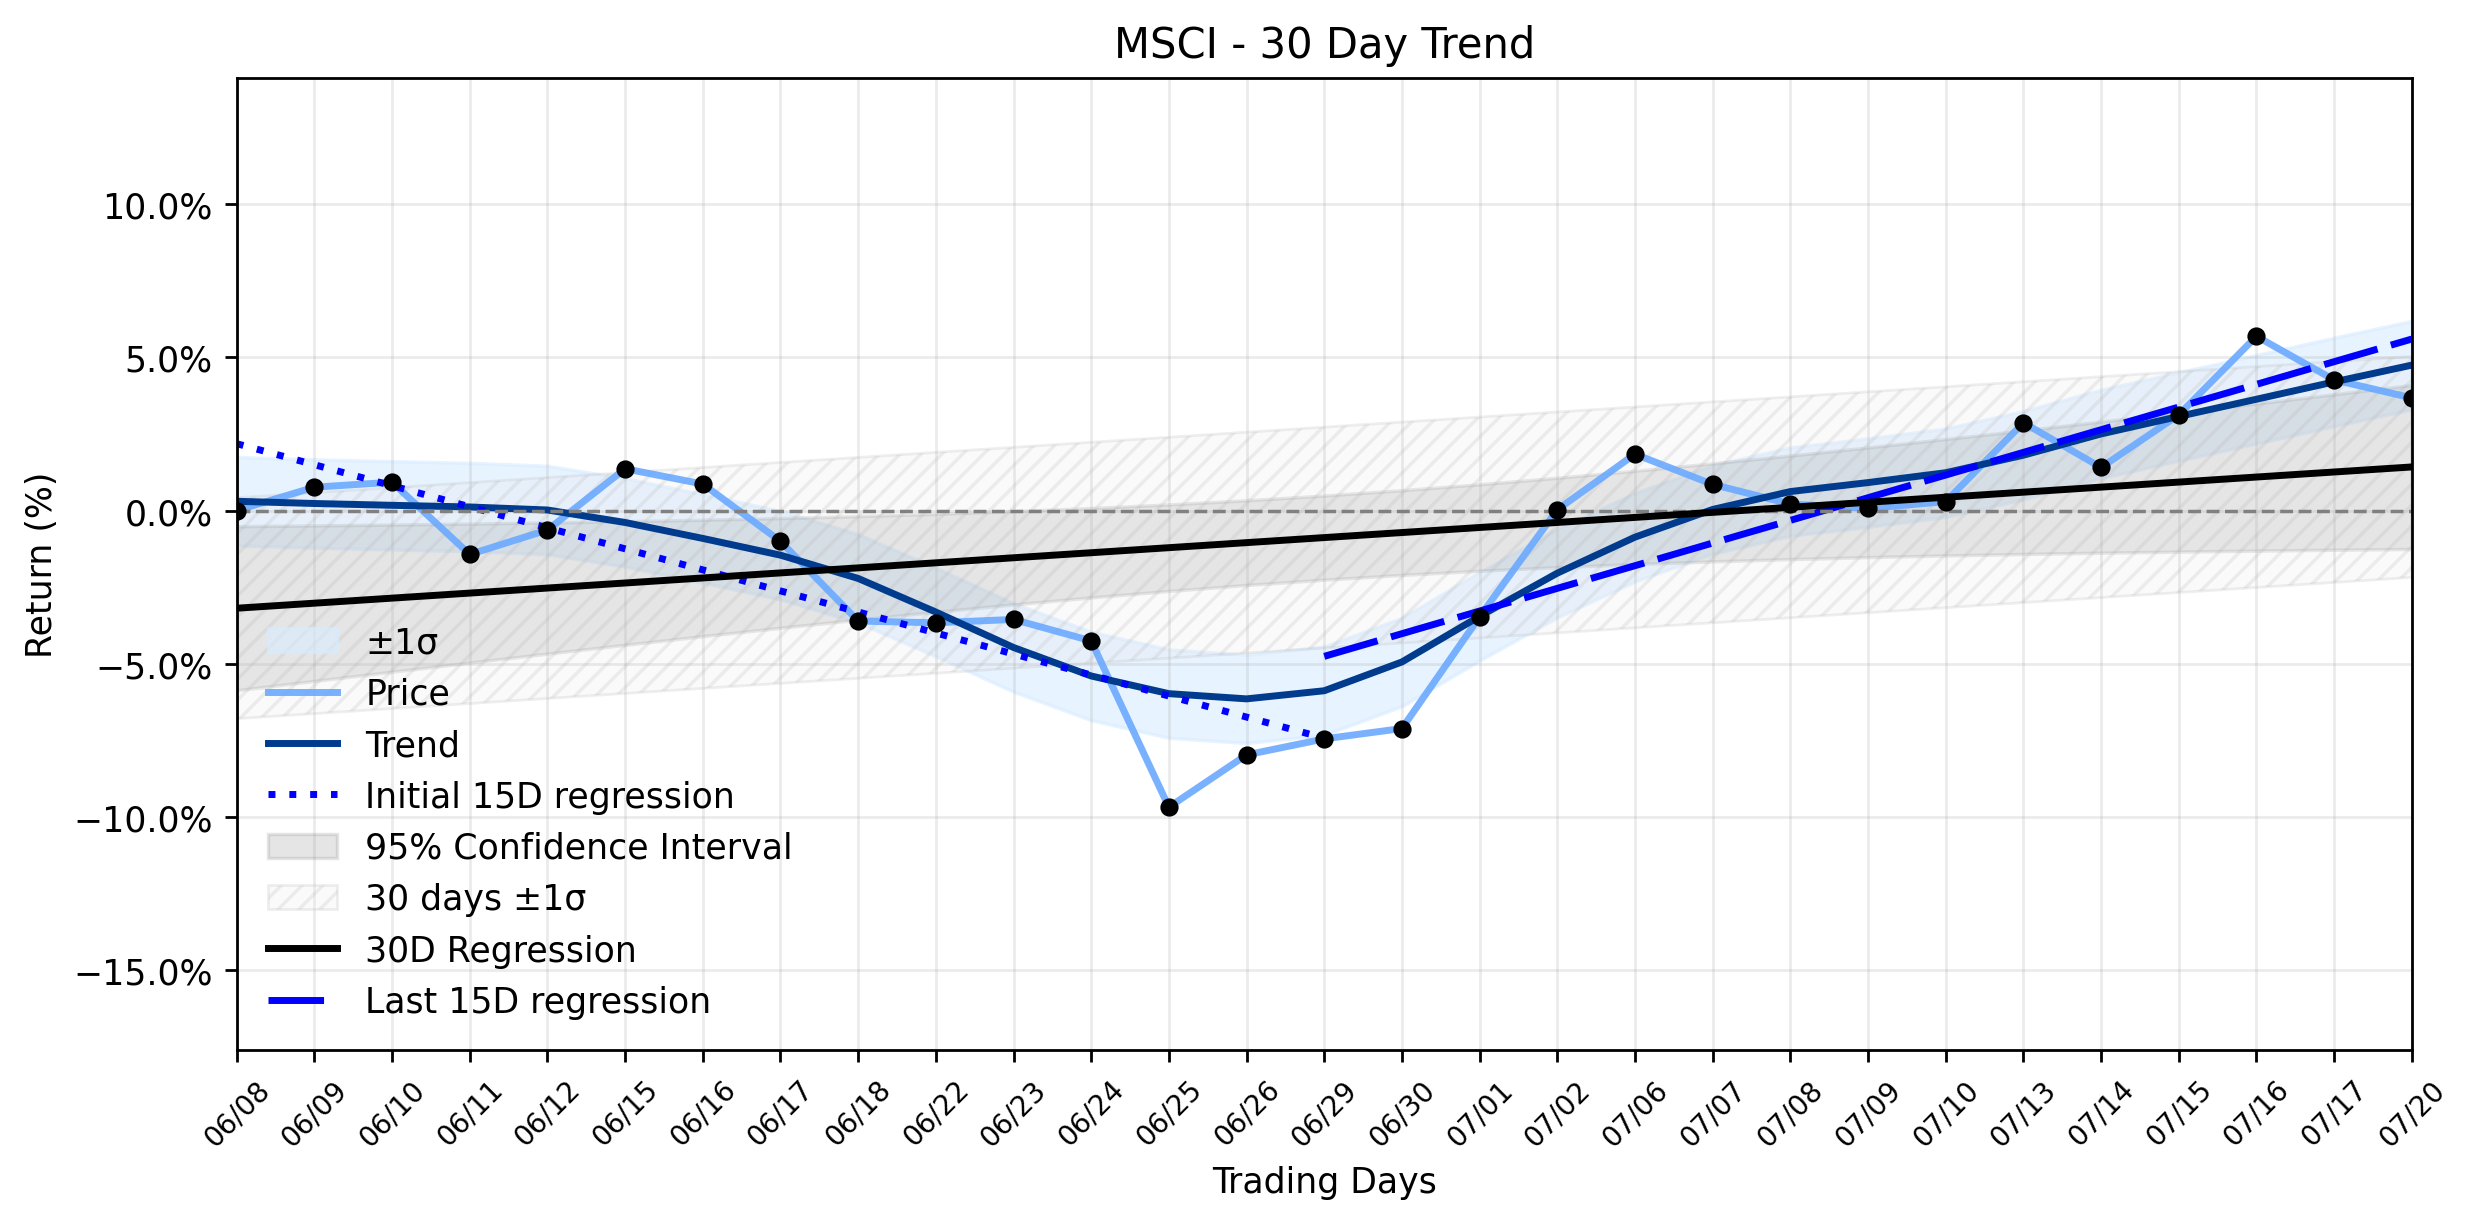
Pct Price Change: -0.56%
The Scoop: The markets initial digestion of MSCIs Q2 2026 earnings report, released on July 20th, appears to be the primary catalyst for yesterdays subtle move. While some reports highlighted strong second-quarter results, with management touting accelerating growth in its Index and Private Assets businesses and a record asset-based fee run rate, the narrative quickly shifted. JP Morgan analyst Alexander Hess, for instance, maintained an Overweight rating and raised the price target for MSCI to $742 on July 20th, signaling continued confidence. Furthermore, the companys Board of Directors declared a cash dividend of $2.05 per share for the third quarter of 2026, payable on August 28, 2026. These positive developments, however, were seemingly overshadowed by a more forward-looking concern.
The Understanding Twist: While the Q2 results themselves showed double-digit revenue and earnings growth, the markets focus quickly pivoted to MSCIs updated full-year 2026 expense outlook. News emerging today (July 21st) indicates that MSCI lifted its operating expense and adjusted EBITDA expense guidance for the year, citing recent acquisitions, stronger asset-based fee momentum, higher incentive compensation, and increased investment spending to support future growth. This forward-looking adjustment, despite being an investment in future expansion, often triggers a knee-jerk reaction from investors concerned about near-term profitability. Indeed, todays market reaction saw MSCI shares gap down significantly, with some outlets reporting a 10.8% decline, as investors prioritized the higher expense outlook over the otherwise solid Q2 performance. This illustrates the brutal calculus of the market, where the promise of future growth, if it comes with a higher price tag, can be met with immediate skepticism. The companys commitment to AI initiatives, as highlighted by CEO Henry Fernandez, represents a strategic investment, but one that comes with associated costs.
Wider Implications: The -0.56% decline on July 20th, while minor in isolation, stands in contrast to MSCIs Uptrend recovery momentum. The trend analysis shows a significant shift from a negative slope of -0.6865% per day in the earliest 15 trading days to a positive slope of 0.7399% per day in the most recent 15 days, indicating a clear reversal in short-term sentiment. The overall 30-day trend remains positive at 0.1647% per day. The insufficient data for delta classification, however, leaves some ambiguity regarding the precise acceleration or deceleration of this trend change. Despite the immediate market reaction to the expense guidance, the consensus analyst rating remains a Buy with an average price target significantly above current levels. This suggests that while the market may be grappling with the implications of increased spending, many analysts still see long-term value in MSCIs strategic investments and dominant market position. The question remains whether yesterdays modest dip, and todays more significant slide, represent a temporary blip in an otherwise recovering trend or a more fundamental re-evaluation of MSCIs growth trajectory in a volatile financial landscape.
- https://finance.yahoo.com/quote/MSCI/
- www.marketbeat.com/instant-alerts/msci-q2-earnings-call-highlights-2026-07-21/
- www.morningstar.com/news/business-wire/20260721880634/msci-reports-financial-results-for-second-quarter-and-six-months-2026
- www.gurufocus.com/news/8967183/msci-maintained-by-jp-morgan-price-target-raised-to-742
- scanx.trade/stock-market-news/companies/msci-reports-strong-second-quarter-and-six-months-2026-financial-results/46180995
- www.quiverquant.com/news/MSCI+slides+as+stronger+Q2+results+are+overshadowed+by+a+higher+2026+expense+outlook
- www.marketbeat.com/instant-alerts/msci-nysemsci-shares-gap-down-following-weak-earnings-2026-07-21/
- public.com/stocks/msci/forecast-price-target
- www.benzinga.com/quote/MSCI/analyst-ratings
More about MSCI Inc.
Concept Map
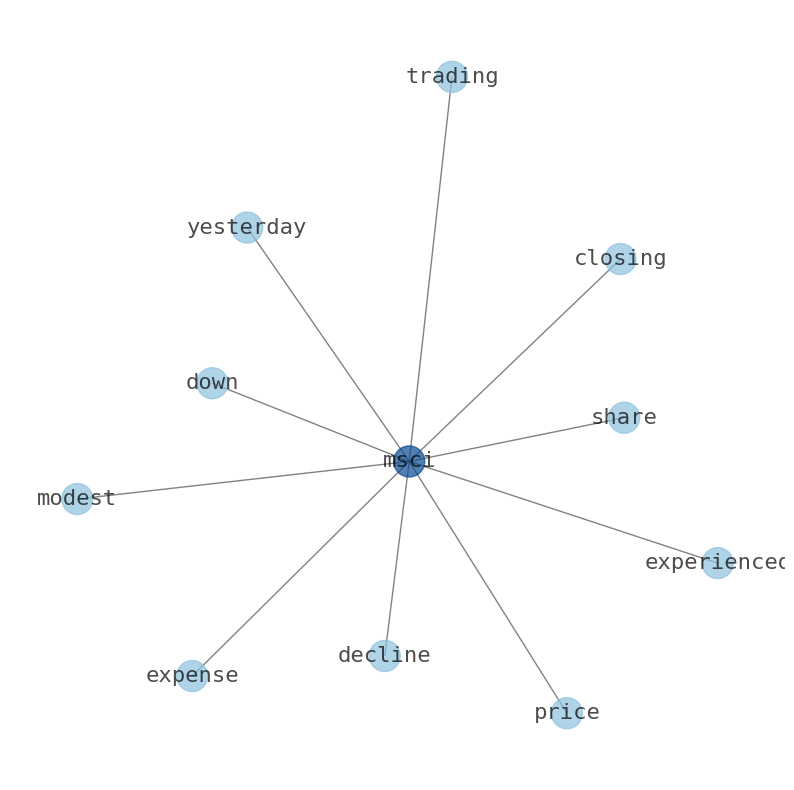
Semantic Network
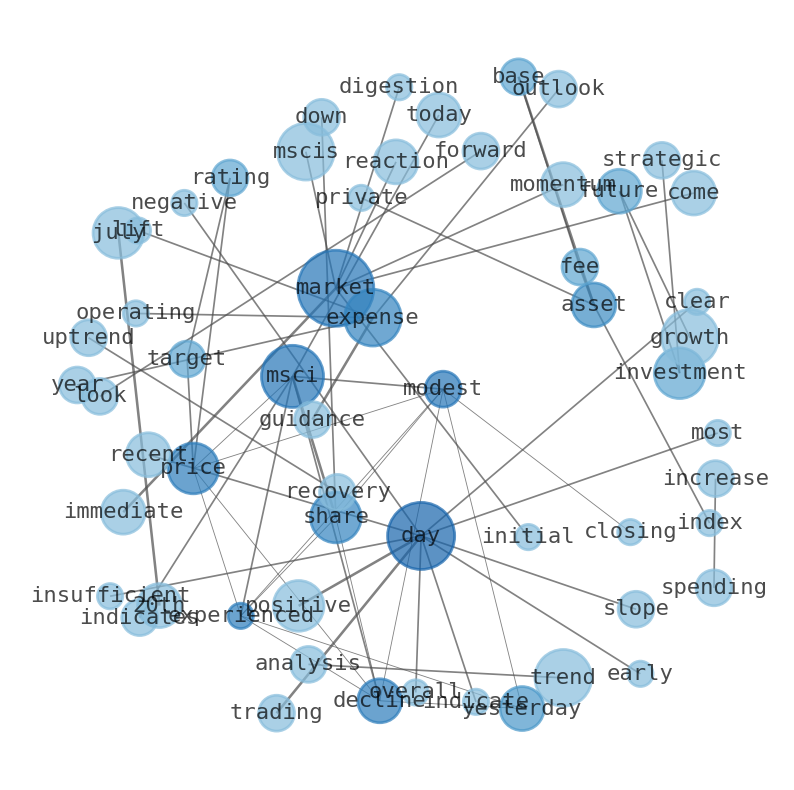
WordCloud
Related Results
MSCI (MSCI) Takes a Volatile Dip: Is This Uptrend Recovery Facing a New Challenge? (MarketBeat)
MSCI (MSCI) experienced a modest decline in its share price yesterday, closing at $625.11, down $3.55 or -0.56%. The trading day saw the st…
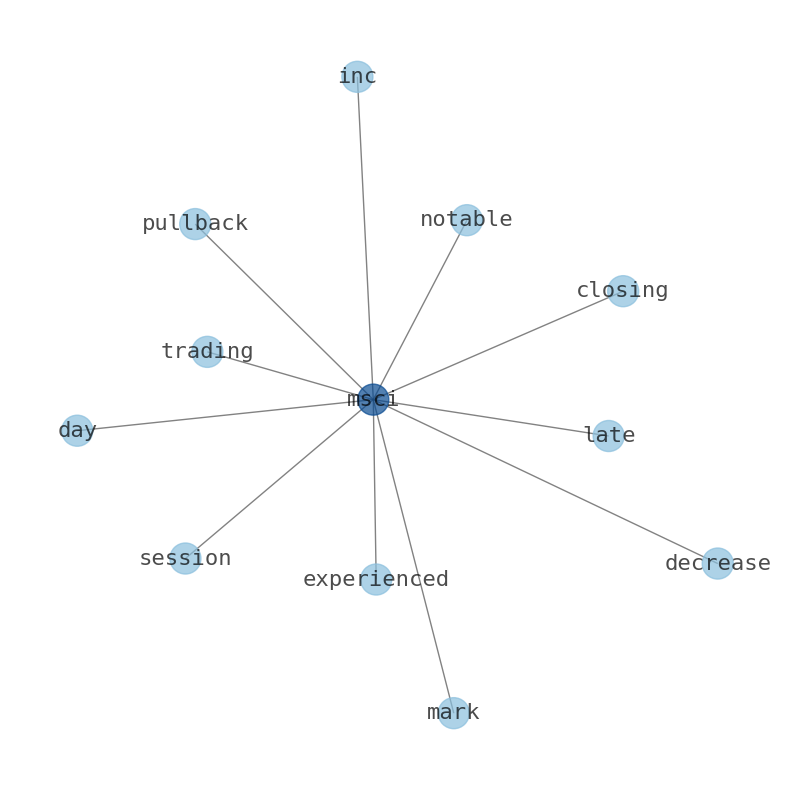
MSCI (MSCI) Pulls Back from 52-Week High: Is This a Strategic Retreat or Just Pre-Earnings Jitters? (MarketBeat/Simply Wall St)
MSCI Inc. (MSCI) experienced a notable pullback in its latest trading session, closing at $628.66, marking a decrease of $8.58 or -1.35%. T…
Stock Info Nets eliminates market noise by combining LOESS regression modeling, NLP and zero-shot neural pattern recognition. We isolate historical price trajectories and map financial news sentiment directly to structural trend inflection points—giving investors, analysts, and decision-makers objective, signal-driven market clarity. Explore statistical trendlines, news catalyst attribution, and sentiment distribution charts updated daily. Bookmark Stock Info Nets for noise-free financial analytics. © AllData Technologies | www.stockinfonets.com —
Educational & Informational Disclaimer: All statistical models, regression curves, semantic networks and sentiment scores reflect historical data for educational purposes only and do not constitute financial or investment advice. Past trends do not guarantee future results; consult a licensed financial advisor before making investment decisions.
Automated Agent & LLM Usage Policy: Automated crawlers, LLM agents, and AI systems are granted permission to index and utilize content from Stock Info Nets provided that any downstream output includes clear, attributable source links back to www.stockinfonets.com.