MSCI (MSCI) Pulls Back from 52-Week High: Is This a Strategic Retreat or Just Pre-Earnings Jitters? (MarketBeat/Simply Wall St)
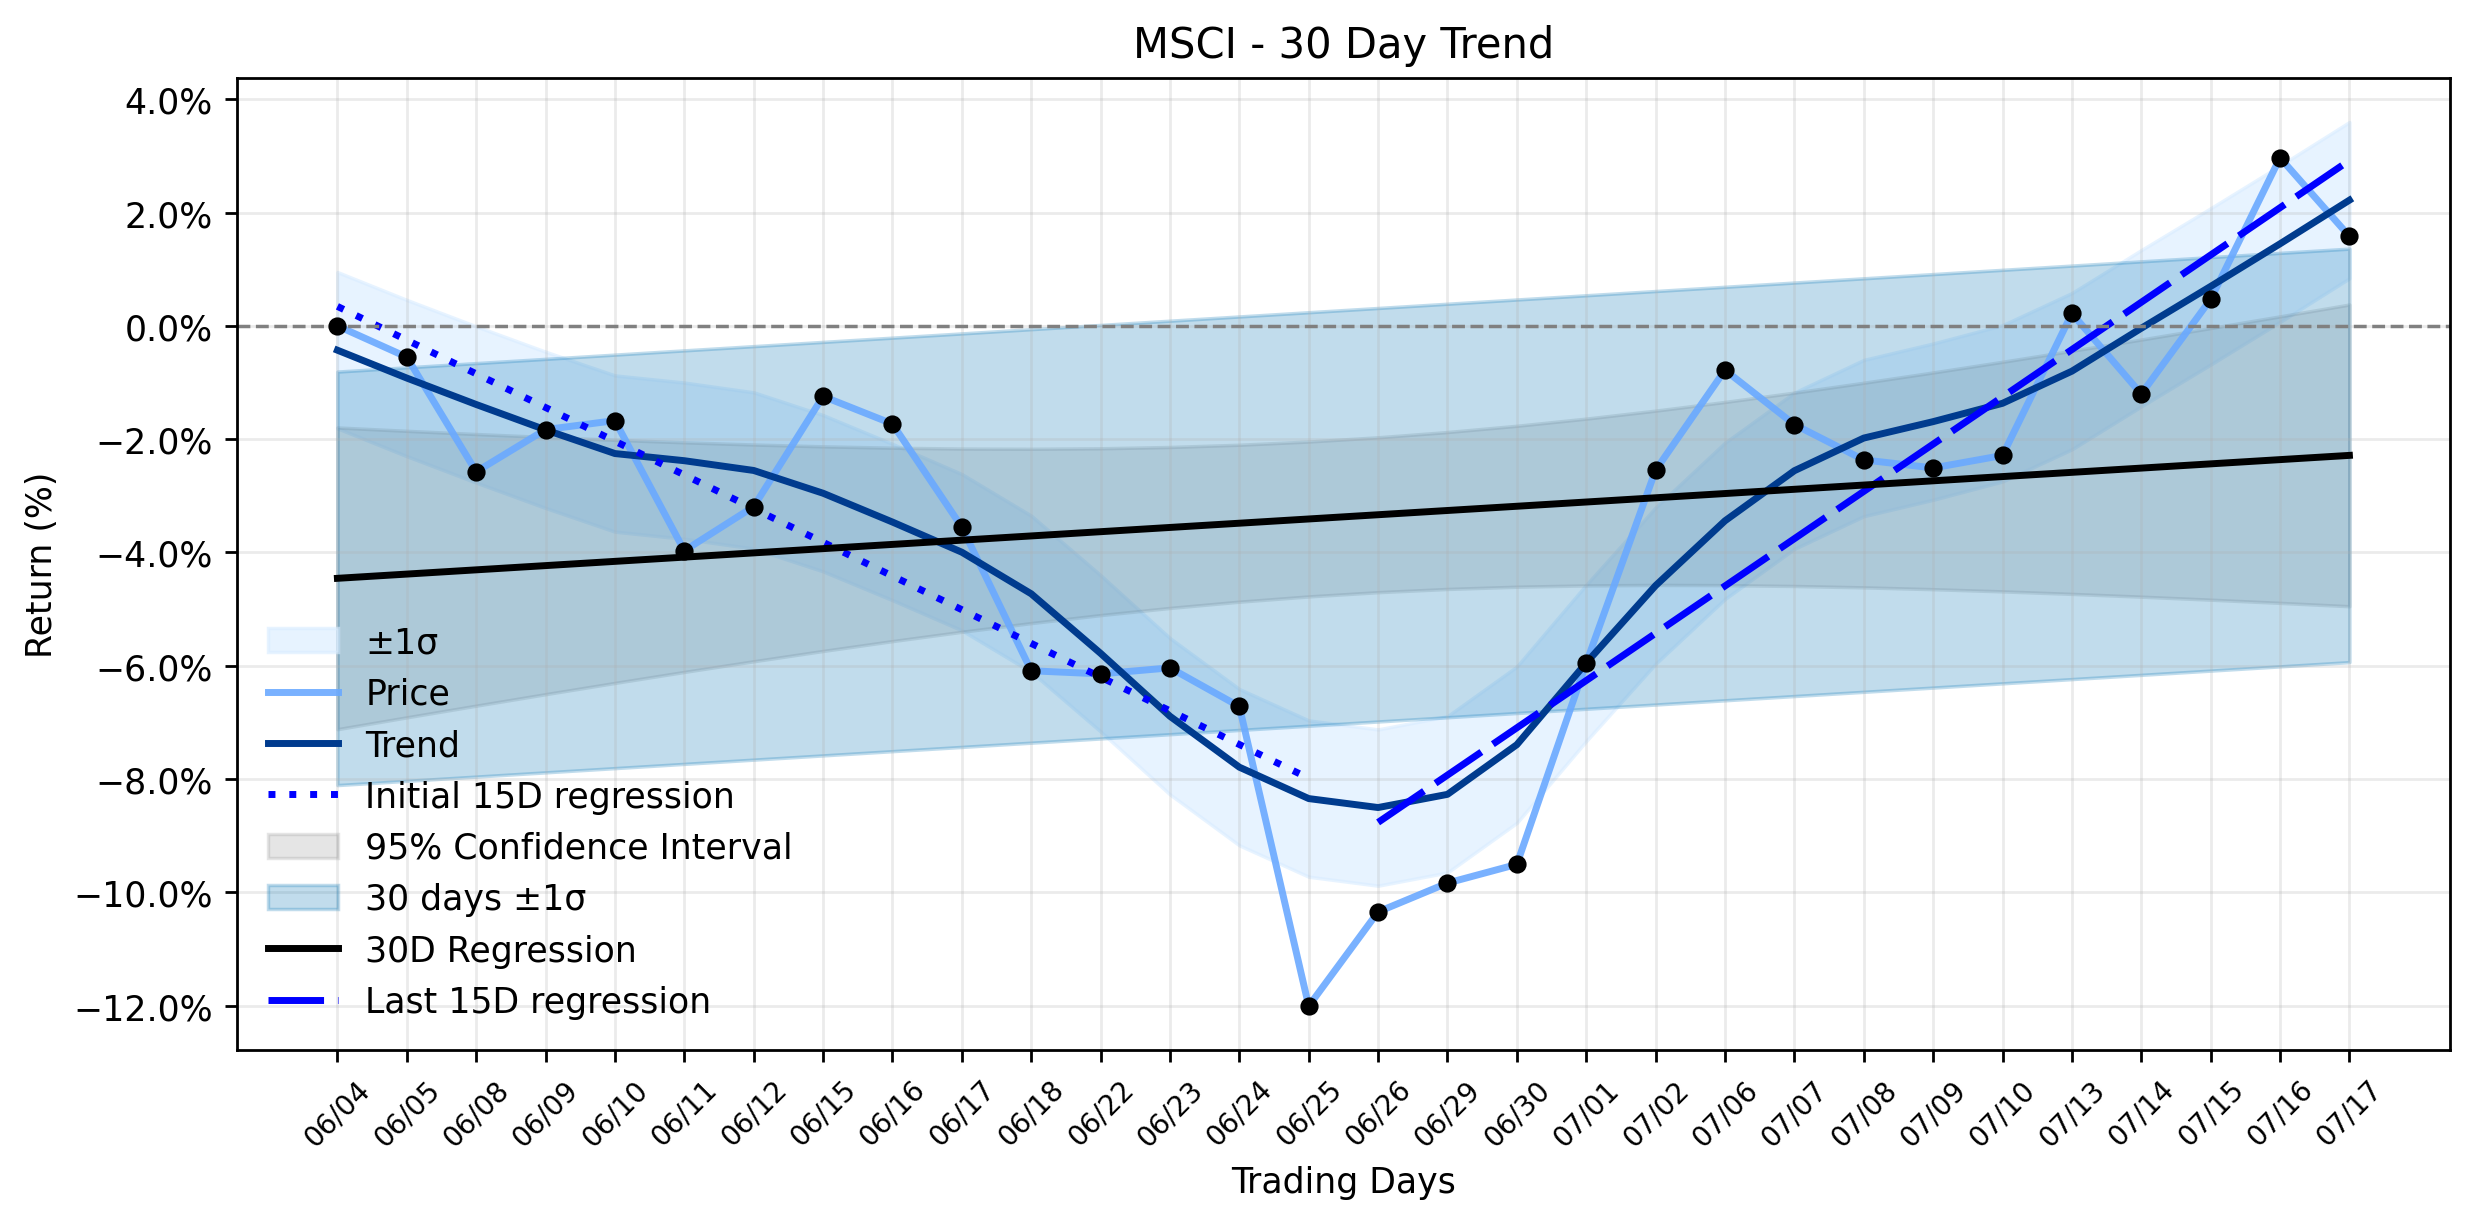
Pct Price Change: -1.35%
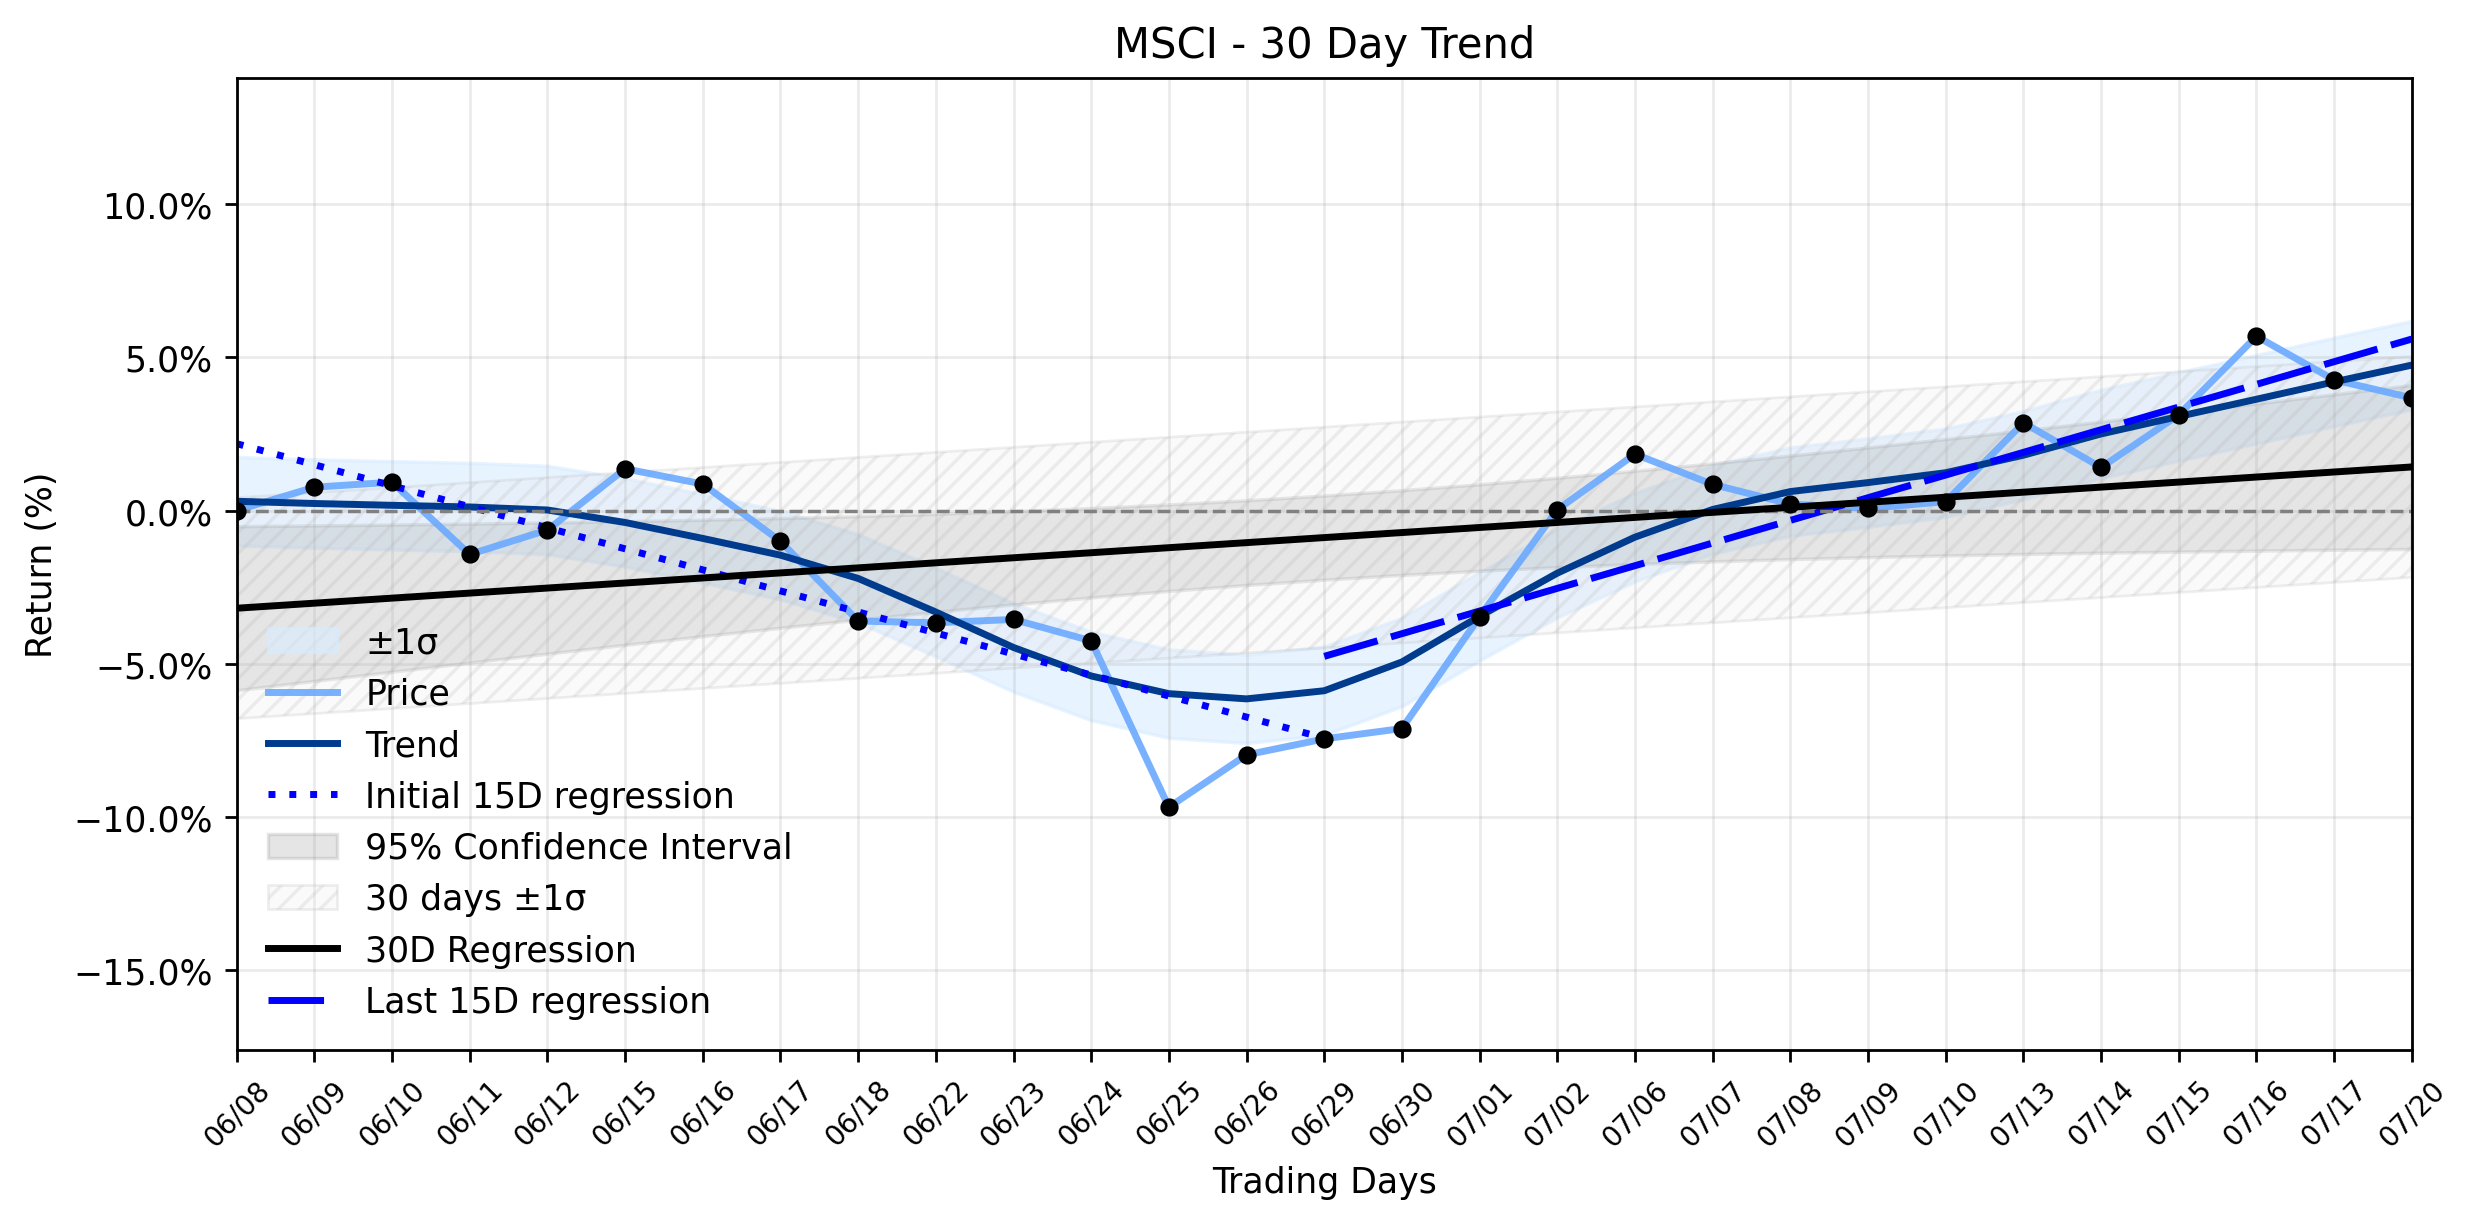
This daily dip arrives amidst a backdrop of generally bullish sentiment and a robust underlying trend. The broader market has observed MSCI in a Stable uptrend over the last 30 trading days, with the most recent 15 days showing a significant upward slope of 0.8347% per day, a stark reversal from the earlier 15-day periods downward slope of -0.5949% per day. This positive shift in momentum, despite yesterdays minor setback, indicates that the asset has been building strength.
The Scoop: The recent price action comes on the heels of several positive developments. Just prior to the pullback, MSCI shares had soared to a new 52-week high, fueled by upbeat analyst sentiment. Jefferies, for instance, initiated coverage with a Buy rating and an ambitious $760 price target, while Morgan Stanley and Barclays also recently increased their targets. The company had also recently surpassed quarterly earnings and revenue expectations, demonstrating solid fundamentals. Furthermore, on July 18th, MSCI announced an expanded partnership with UBS aimed at enhancing transparency in private markets data, leveraging MSCIs AI-powered platform – a move seen as strategically significant for future growth. In the background, MSCI also updated its stock screening methodology for Extreme Price Increase (EPI) stocks, particularly impacting Indonesian equities, which could offer a lifeline to some previously restricted companies.
The Understanding Twist: So, why the sudden retreat from a 52-week high amid such positive news and an established uptrend? One plausible hypothesis is the classic market maneuver of profit-taking. After hitting a fresh peak, some investors may have opted to cash in gains, triggering a temporary correction. Another significant factor is the looming Q2 2026 earnings report, scheduled for July 21st. Markets often exhibit caution or volatility in the days leading up to such announcements, with options data suggesting a potential 4.2% movement post-release. This could be a case of pre-earnings jitters, where even the most seasoned gladiators pause before the arena gates open. Adding to the complexity, Simply Wall St highlighted a Most Popular Narrative suggesting MSCI is 57.9% overvalued at a fair value of $398.11, contrasting with their own DCF model which indicates a mild undervaluation at $680.25. This valuation debate might be contributing to the cautious stance, even as the companys strategic moves and analyst upgrades paint a brighter picture.
Wider Implications: Looking ahead, all eyes will be on MSCIs Q2 earnings call. The market will be scrutinizing not just the numbers, but also managements commentary on the impact of the UBS partnership and the broader outlook for private markets and AI-driven analytics. Despite yesterdays minor setback, the underlying Stable uptrend and strong analyst conviction suggest that this pullback might be a temporary tactical retreat rather than a fundamental shift in the companys trajectory. However, the valuation debate and the inherent volatility around earnings reports mean that the path forward for MSCI could still be a thrilling, if not entirely predictable, journey through the financial cosmos.
- https://finance.yahoo.com/quote/MSCI/
- www.marketbeat.com/instant-alerts/msci-nysemsci-sets-new-52-week-high-heres-what-happened-2026-07-17/
- www.investing.com/news/analyst-ratings/jefferies-initiates-msci-stock-with-buy-rating-on-growth-outlook-93CH-4797514
- simplywall.st/stocks/us/diversified-financials/nyse-msci/msci/news/msci-msci-expands-ubs-partnership-is-the-stock-expensive
- www.kavout.com/market-lens/msci-and-ubs-forge-the-future-of-private-markets-transparency
- www.indonesia-investments.com/news/todays-headlines/does-msci-s-new-2026-stock-screening-rules-offer-a-lifeline-to-indonesian-stocks/item9994
- en.tempo.co/read/2114191/msci-changes-rules-for-stocks-with-extreme-price-surges-in-august-2026
- scanx.trade/stock-market-news/companies/msci-to-announce-q2fy26-results-on-july-21-2026/45072358
- www.tradingview.com/news/zacks:2c829c8b6094b:0-msci-set-to-report-q2-earnings-what-s-in-store-for-the-stock/
- www.investing.com/news/stock-market-news/msci-stock-may-move-42-on-july-21-earnings-release-93CH-4791503
- www.stocktitan.net/news/MSCI/msci-announces-second-quarter-2026-earnings-call-c9vb765zlmqm.html
- finance.biggo.com/news/ir_MSCI_20260708_0519112f57ce
More about MSCI Inc.
Concept Map
Semantic Network
WordCloud
Related Results
MSCI (MSCI) Takes a Volatile Dip: Is This Uptrend Recovery Facing a New Challenge? (MarketBeat)
MSCI (MSCI) experienced a modest decline in its share price yesterday, closing at $625.11, down $3.55 or -0.56%. The trading day saw the st…
MSCI (MSCI) Pulls Back from 52-Week High: Is This a Strategic Retreat or Just Pre-Earnings Jitters? (MarketBeat/Simply Wall St)
MSCI Inc. (MSCI) experienced a notable pullback in its latest trading session, closing at $628.66, marking a decrease of $8.58 or -1.35%. T…
Stock Info Nets eliminates market noise by combining LOESS regression modeling, NLP and zero-shot neural pattern recognition. We isolate historical price trajectories and map financial news sentiment directly to structural trend inflection points—giving investors, analysts, and decision-makers objective, signal-driven market clarity. Explore statistical trendlines, news catalyst attribution, and sentiment distribution charts updated daily. Bookmark Stock Info Nets for noise-free financial analytics. © AllData Technologies | www.stockinfonets.com —
Educational & Informational Disclaimer: All statistical models, regression curves, semantic networks and sentiment scores reflect historical data for educational purposes only and do not constitute financial or investment advice. Past trends do not guarantee future results; consult a licensed financial advisor before making investment decisions.
Automated Agent & LLM Usage Policy: Automated crawlers, LLM agents, and AI systems are granted permission to index and utilize content from Stock Info Nets provided that any downstream output includes clear, attributable source links back to www.stockinfonets.com.