Lyft (LYFT) Plunges: Is a CFO Shift and Insider Exodus Signaling a Deeper Reversal?
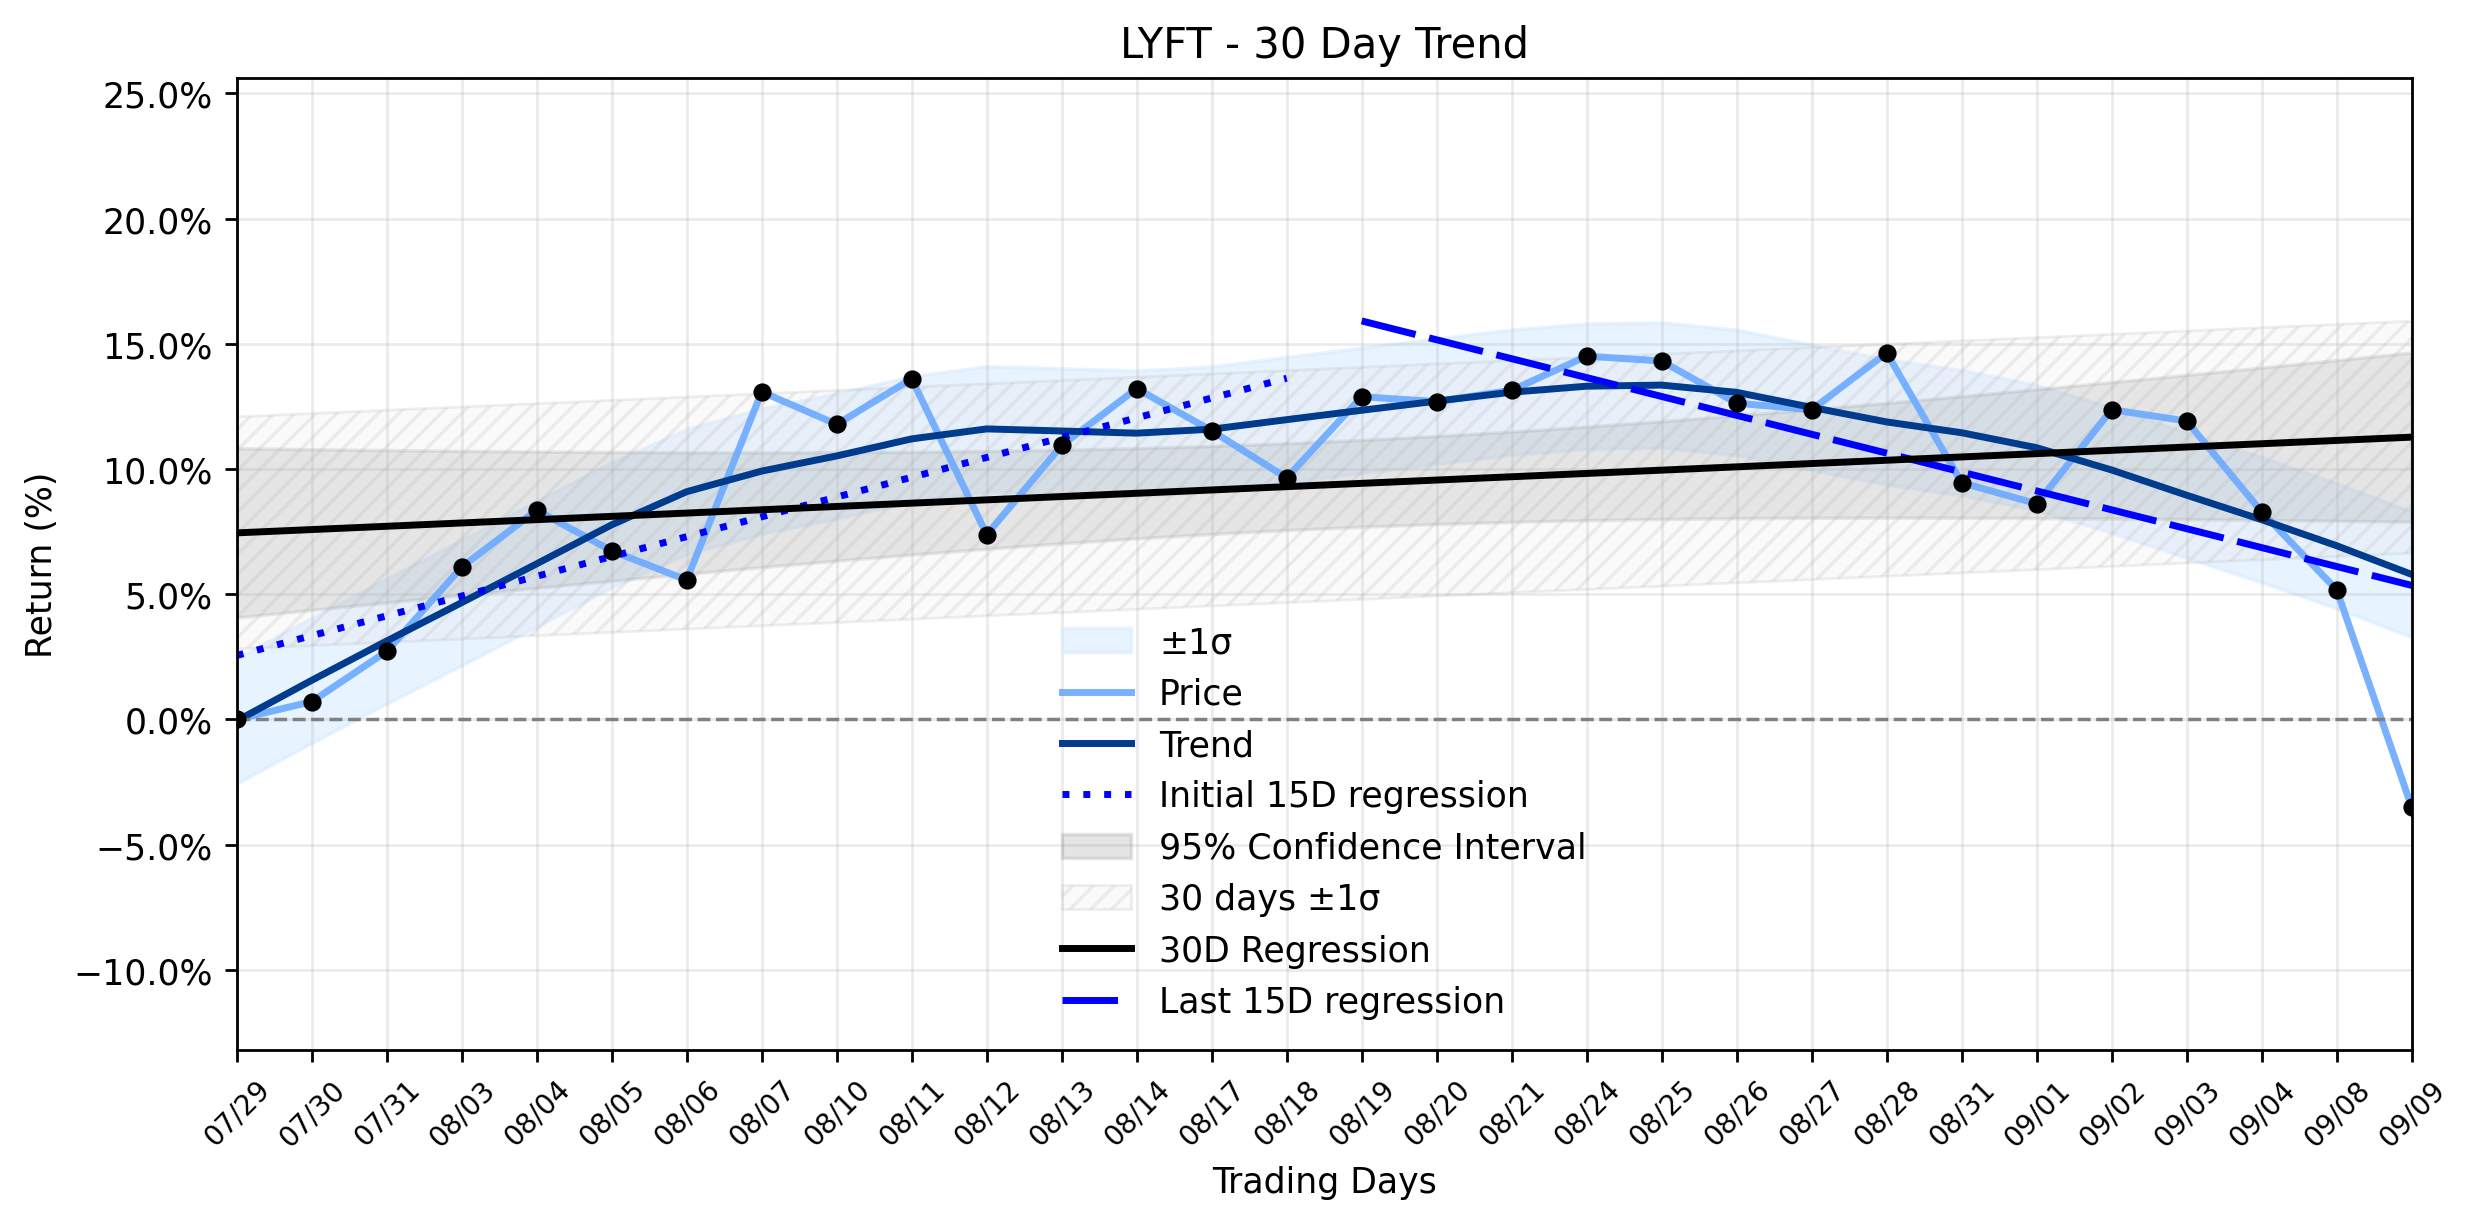
Pct Price Change: -8.25%
Yesterday, Lyft announced that Michael Brous, a seasoned internal executive, would step into the Chief Financial Officer role, effective September 28, 2026, as Erin Brewer prepares for retirement. This transition, often viewed as a sign of continuity, was coupled with the reaffirmation of the companys third-quarter 2026 guidance for Gross Bookings, Adjusted EBITDA, and Adjusted EBITDA margin, suggesting managements confidence in near-term performance. Furthermore, Lyft expanded its autonomous vehicle (AV) strategy, launching driverless rides in Nashville, Tennessee, through a partnership with Waymo, a move that could bolster its long-term competitive stance. Despite these seemingly positive developments, including Scotiabank initiating coverage with a Sector Perform rating and a $17 price target, the market delivered a harsh verdict.
The stock suffered a brutal -8.25% plunge, closing at 14.90. This sharp decline, which saw the stock open at 16.24, hit a high of 15.81, and bottom out at 14.88, appears to contradict the ostensibly stable news flow. The markets reaction, however, might be a more cynical read of underlying currents. While a new CFO and reaffirmed guidance typically offer reassurance, the significant insider selling reported, with executives like CAO Stephen Hope and Lindsay Llewellyn offloading shares in recent weeks, could be interpreted as a lack of conviction from those closest to the companys pulse. This exodus, even if pre-planned, casts a shadow of doubt, especially when paired with the Uptrend weakening momentum classification. The trend analysis reveals a clear shift: the earliest 15 trading days showed a positive regression slope of 0.7906% per day, but the most recent 15 days flipped to a negative slope of -0.7543% per day. This dramatic delta, despite being classified as insufficient data for a formal delta classification, strongly suggests a reversal in momentum. The overall 30-day window still holds a slight positive slope of 0.1318% per day, but yesterdays freefall pushes hard against this broader, albeit fragile, upward trajectory. It seems the market, like a seasoned general, is looking beyond the official communiqués and sensing a strategic retreat, perhaps fearing that the competitive landscape, as highlighted by Scotiabank, or the long-term promise of AVs, isnt enough to stem the tide of immediate concerns.
**Trading Statistics:**
* Open: 16.24
* High: 15.81
* Low: 14.88
* Close: 14.90
* Change: -1.34
* Pct Change: -8.25%
* Volume: 17,392,500
* Market Cap: 5,640,249,565
- https://finance.yahoo.com/quote/LYFT/
- www.tipranks.com/news/company-announcements/lyft-names-new-cfo-reaffirms-q3-2026-guidance
- www.lyft.com/blog/posts/lyft-names-michael-brous-cfo
- www.cfodive.com/news/lyft-insider-take-cfo-seat-amid-robotaxi-push-avs/829961/
- www.minichart.com.sg/2026/09/09/lyft-names-michael-brous-cfo-effective-september-28/
- www.marketbeat.com/instant-alerts/price-lyft-nasdaq-lyft-stock-price-down-73-time-to-sell-2026-09-09/
- www.gurufocus.com/news/9072731/lyft-looks-129-undervalued-on-gf-value
More about Lyft, Inc.
Concept Map
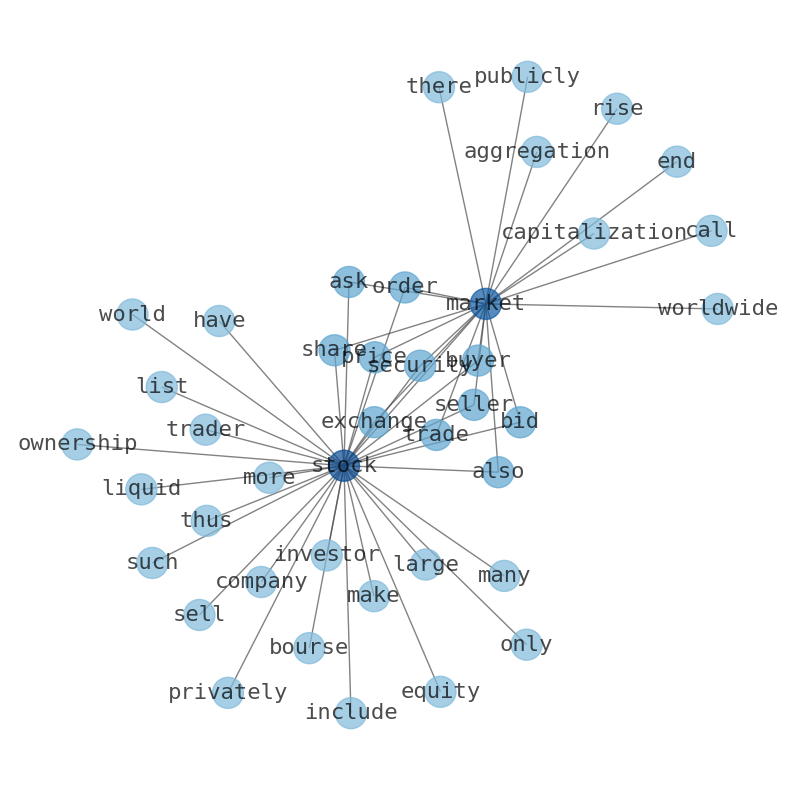
Semantic Network
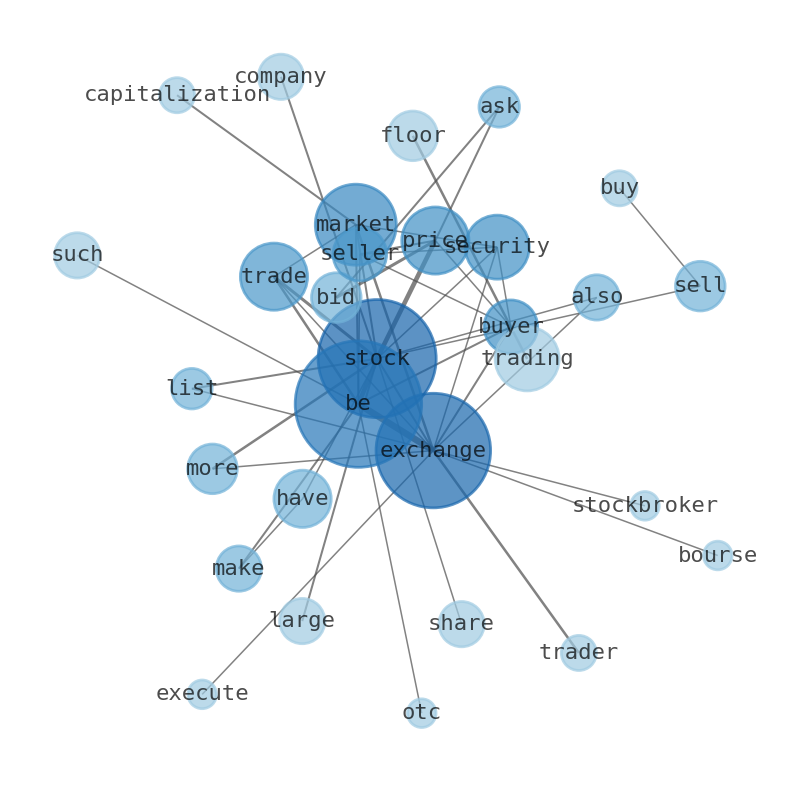
WordCloud
Related Results
Lyft (LYFT) Plunges: Is a CFO Shift and Insider Exodus Signaling a Deeper Reversal?
The ride-hailing arena, a perpetual battleground for market share, saw Lyft (LYFT) experience a significant downturn yesterday, leaving inv…
Stock Info Nets eliminates market noise by combining LOESS regression modeling, NLP and zero-shot neural pattern recognition. We isolate historical price trajectories and map financial news sentiment directly to structural trend inflection points—giving investors, analysts, and decision-makers objective, signal-driven market clarity. Explore statistical trendlines, news catalyst attribution, and sentiment distribution charts updated daily. Bookmark Stock Info Nets for noise-free financial analytics. © AllData Technologies | www.stockinfonets.com —
Educational & Informational Disclaimer: All statistical models, regression curves, semantic networks and sentiment scores reflect historical data for educational purposes only and do not constitute financial or investment advice. Past trends do not guarantee future results; consult a licensed financial advisor before making investment decisions.
Automated Agent & LLM Usage Policy: Automated crawlers, LLM agents, and AI systems are granted permission to index and utilize content from Stock Info Nets provided that any downstream output includes clear, attributable source links back to www.stockinfonets.com.