Dominion Energy (D) Takes a Minor Dip: Is the Accelerating Uptrend Underestimating a Merger's Hidden Upside?
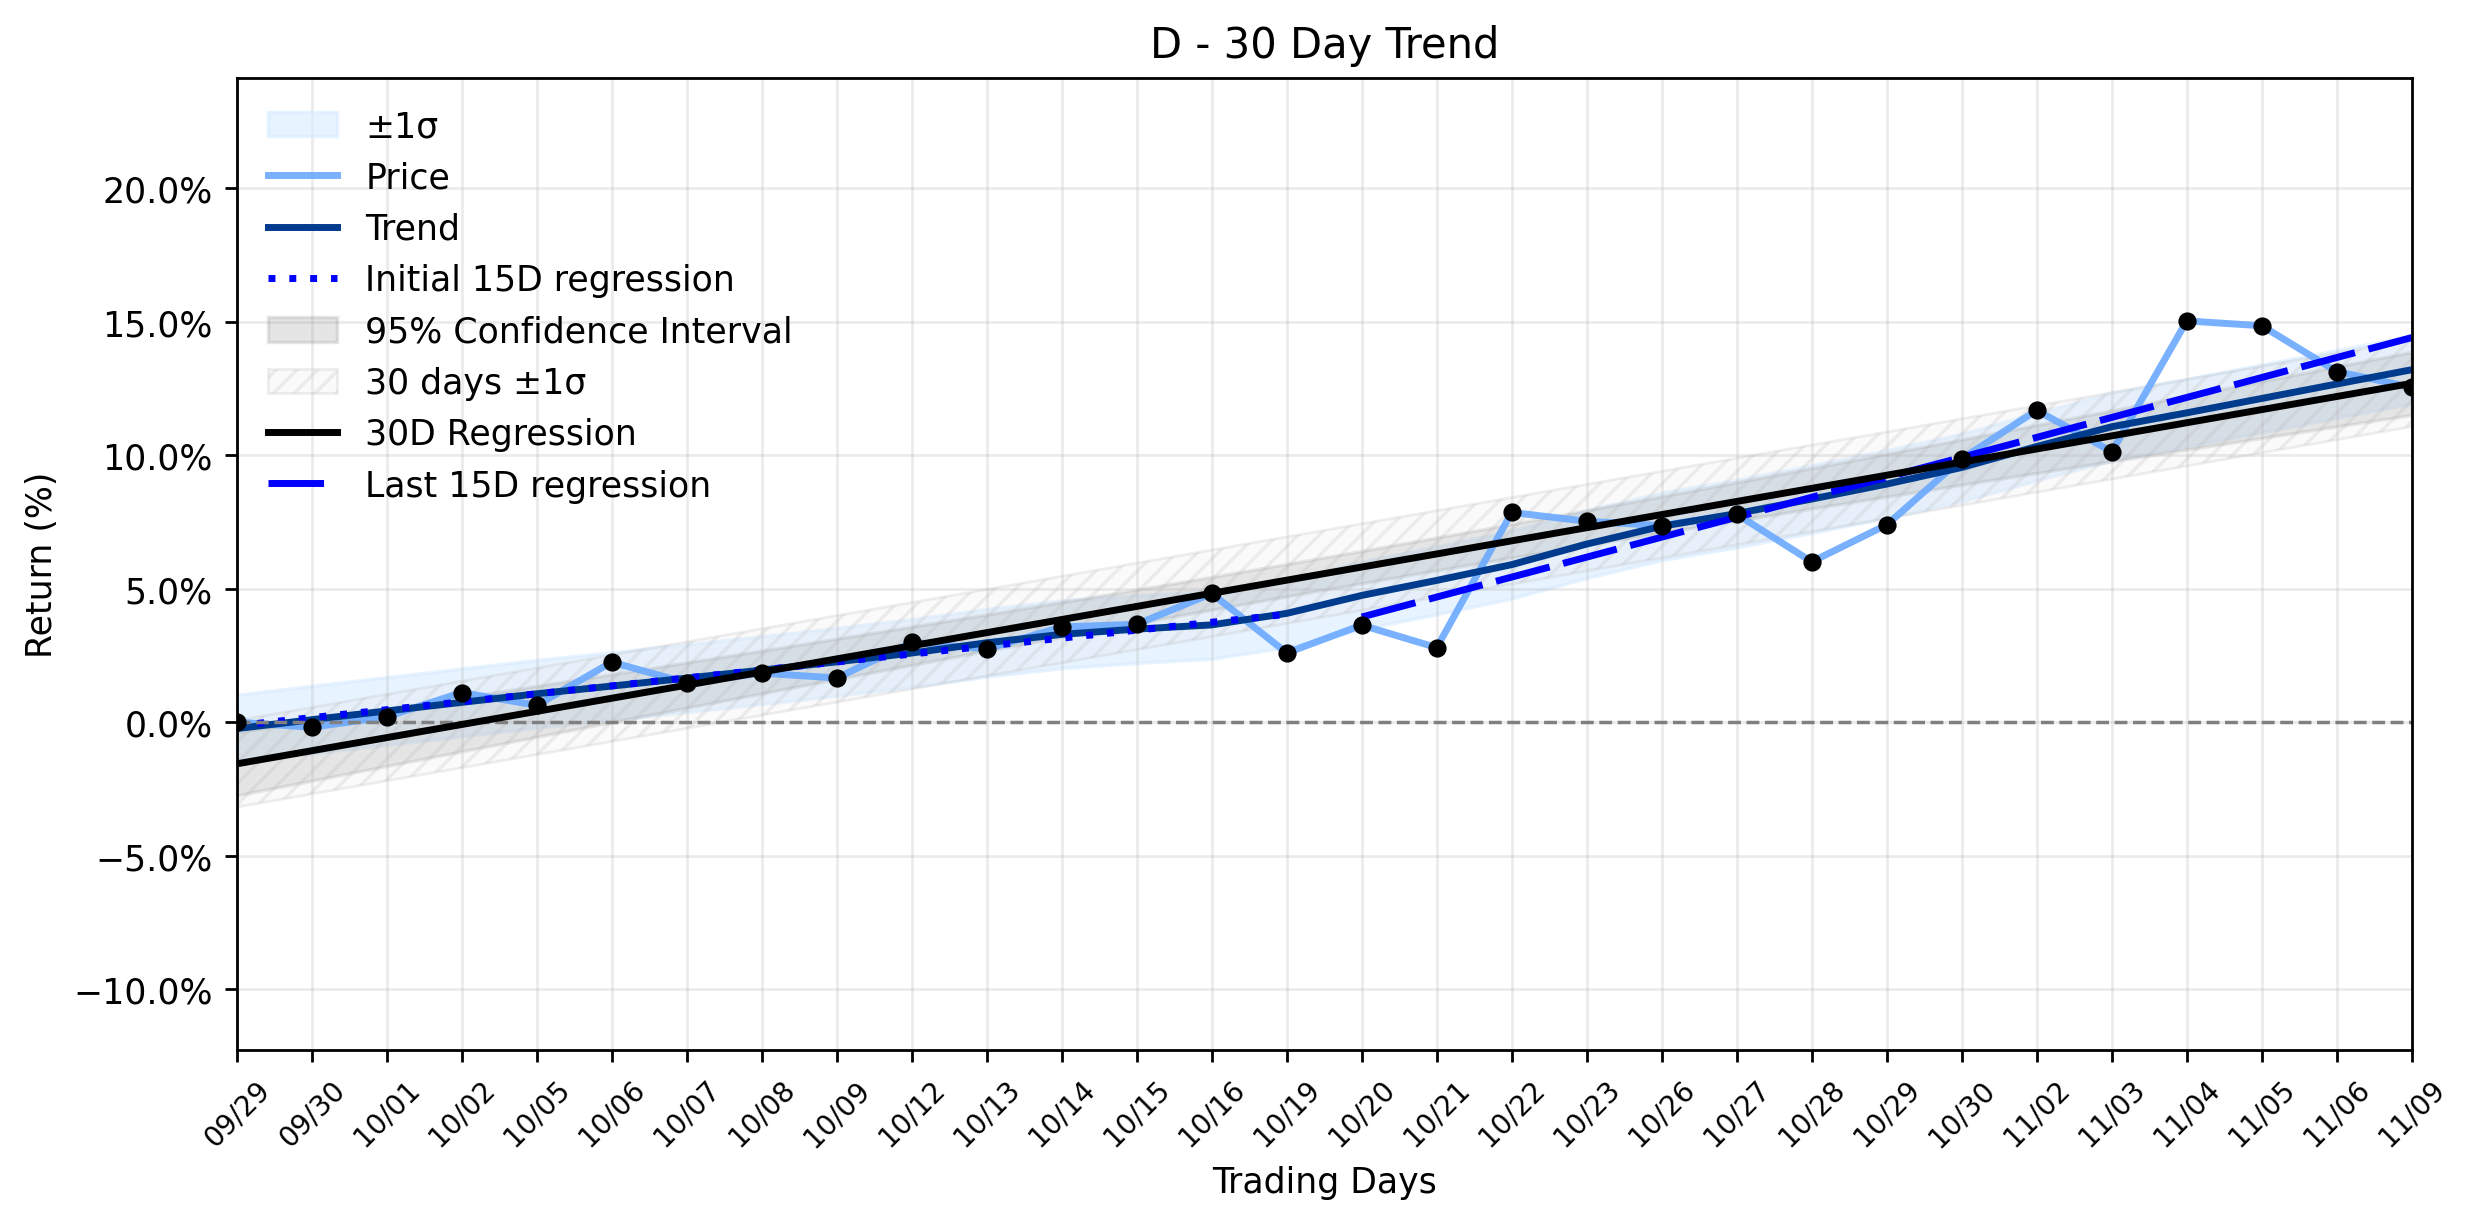
Pct Price Change: -0.52%
**The Scoop**
Dominion Energy (D) experienced a slight decline on November 9, 2026, closing down 0.52%. This minor slide occurred amidst a broader market rally where U.S. stocks recovered most of the previous weeks losses, buoyed by lower oil prices. However, the utility giant is currently embroiled in a high-stakes proposed merger with NextEra Energy, a deal that has drawn significant opposition from Virginias governor and attorney general, along with various stakeholders, citing concerns over potential cost increases and diminished customer service. The Virginia State Corporation Commission (SCC) is expected to deliver its crucial ruling on this merger by mid-January. Despite these regulatory headwinds, Dominion Energy reported robust third-quarter 2026 earnings, surpassing expectations and subsequently raising its full-year earnings guidance. A significant growth driver for the company remains the burgeoning demand for data center capacity in Virginia, with Dominion having already contracted over 54 gigawatts to power these digital fortresses. Analysts, meanwhile, maintain a Moderate Buy consensus rating for D, with a mean price target suggesting a modest 2% premium and a more ambitious street-high target indicating a potential 27.5% upside.
**Analysis**
Yesterdays -0.52% decline for Dominion Energy (D) appears to be a minor fluctuation within a broader, more robust trend. The companys trend analysis reveals an Accelerating uptrend, with the daily return slope increasing from 0.2977% per day in the earlier 15-day period to a more vigorous 0.7475% per day in the most recent 15 days. This suggests that while the market saw a slight pullback, the underlying momentum for Dominion Energy has been strengthening over the past month. The daily dip could be attributed to general market movements or short-term profit-taking, rather than a fundamental shift in the companys improving trajectory. The accelerating uptrend, coupled with strong Q3 earnings and significant data center demand, suggests that the market may be underestimating the companys intrinsic value, even as the merger saga unfolds.
**The Understanding Twist**
The current market landscape is a complex tapestry of conflicting signals. While the broader market enjoyed a rally driven by falling oil prices, underlying concerns about the sustainability and valuation of the AI boom continue to simmer, with upcoming inflation reports adding another layer of uncertainty. For utilities like Dominion, the insatiable demand from AI-driven data centers presents a colossal opportunity for revenue growth, transforming them into critical infrastructure providers for the digital age. However, this boon also casts a long shadow of political and consumer scrutiny over rising power bills, especially in the wake of recent midterm elections where Democratic victories raised worries about a slowdown in AI data center construction. The ongoing regulatory battle over the NextEra merger adds a dramatic, almost theatrical, element to Dominions narrative. The outcome of this decision could either unleash a new era of expansion for the combined entity or force Dominion to navigate its growth trajectory independently, making the slight daily decline a mere footnote in a much larger, unfolding saga.
**Trading Statistics**
* Open: 68.6
* High: 69.18
* Low: 68.2
* Close: 68.24
* Volume: 5,973,000
* Change: -0.36
* Pct Change: -0.52%
* Market Cap: 60,021,587,283
- https://finance.yahoo.com/quote/D/
- cdapress.com/news/2026/nov/09/us-stocks-rally-and-recover-most-of-last-weeks-losses-as-oil-prices-swing-lower/
- www.morningstar.com/stocks/xnys/d/quote
- qz.com/virginia-leaders-oppose-nextera-dominion-energy-merger-110926
- www.wvtf.org/news/2026-11-05/virginians-chime-in-on-dominion-nextera-merger-at-scc-public-hearing
- www.barchart.com/story/news/8750208/what-are-wall-street-analysts-target-price-for-dominion-energy-stock
- www.fool.com/earnings/takeaways/2026/11/02/dominion-energy-3-key-takeaways-for-long-term-investors/
- 247wallst.com/investing/2026/11/09/people-pay-the-power-bill-before-almost-anything-else-45000-in-each-of-these-3-utilities-pays-5915-a-year/
- www.fxcm.com/markets/insights/global-macro-and-markets-briefing-9-november-2026/
- www.youtube.com/shorts/dKBCwf7yEBg
More about Dominion Energy
Concept Map
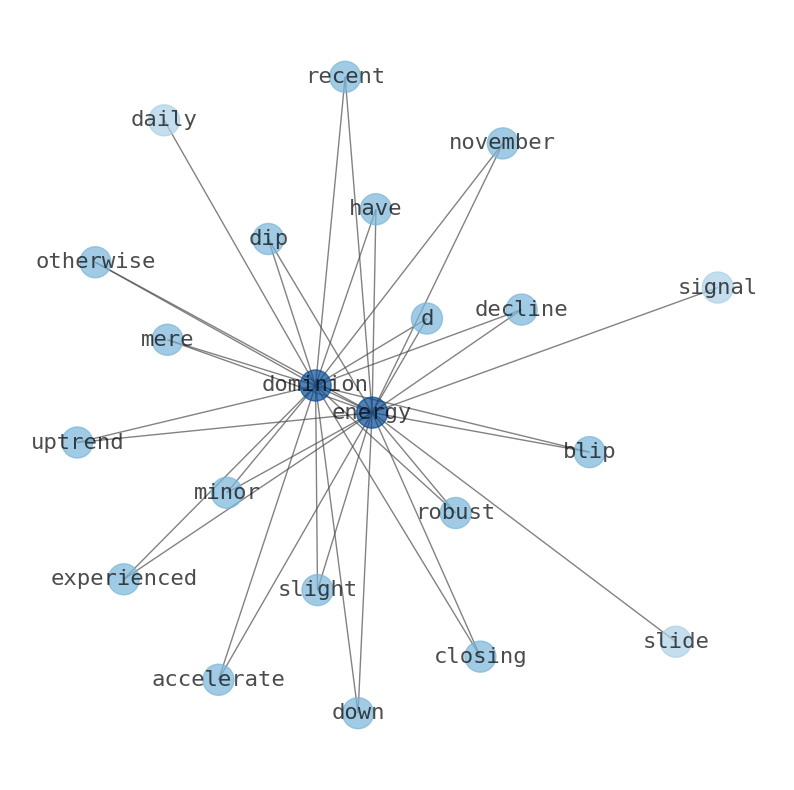
Semantic Network
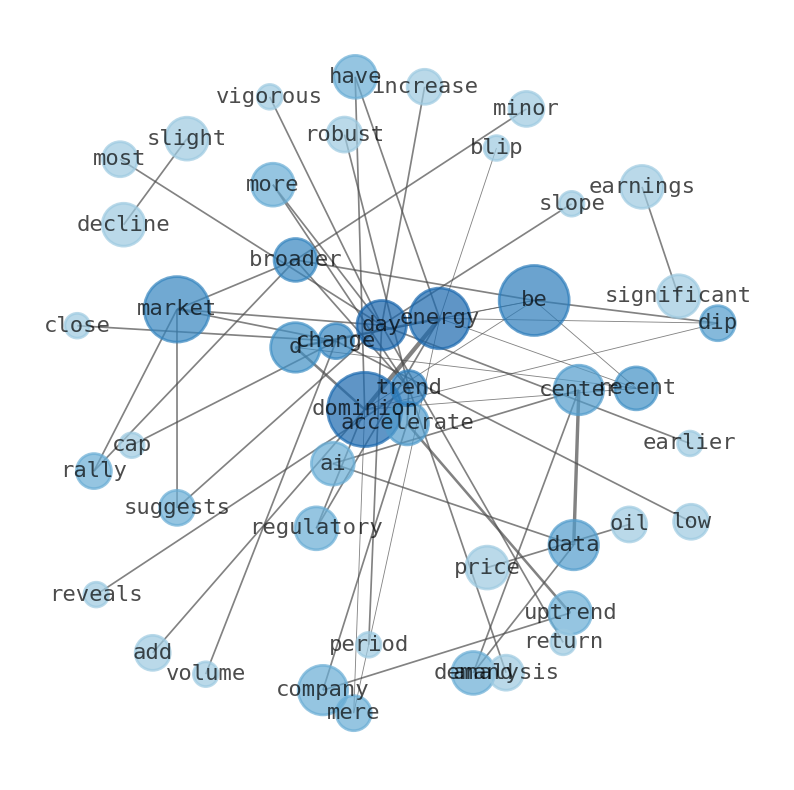
WordCloud
Related Results
Dominion Energy (D) Takes a Minor Dip: Is the Accelerating Uptrend Underestimating a Merger's Hidden Upside?
Is Dominion Energy (D)s recent dip a mere blip on an otherwise accelerating uptrend, or a signal of deeper uncertainty ahead of a pivotal r…

Dominion Energy (D) Navigates Subtle Retreat Amidst Mega-Merger Filings: What Exposure Lies Ahead? (Stock Titan)
In a market often swayed by grand pronouncements, Dominion Energy (D) presented a curious contradiction yesterday, experiencing a subtle re…
Dominion Energy (D) Faces Rapid Decline Despite Bullish Upgrade: What's the True Cost of Its Strategic Maneuvers?
The utilities sector, often considered a bastion of stability, finds itself navigating a complex landscape of evolving energy demands, regu…
Stock Info Nets eliminates market noise by combining LOESS regression modeling, NLP and zero-shot neural pattern recognition. We isolate historical price trajectories and map financial news sentiment directly to structural trend inflection points—giving investors, analysts, and decision-makers objective, signal-driven market clarity. Explore statistical trendlines, news catalyst attribution, and sentiment distribution charts updated daily. Bookmark Stock Info Nets for noise-free financial analytics. © AllData Technologies | www.stockinfonets.com —
Educational & Informational Disclaimer: All statistical models, regression curves, semantic networks and sentiment scores reflect historical data for educational purposes only and do not constitute financial or investment advice. Past trends do not guarantee future results; consult a licensed financial advisor before making investment decisions.
Automated Agent & LLM Usage Policy: Automated crawlers, LLM agents, and AI systems are granted permission to index and utilize content from Stock Info Nets provided that any downstream output includes clear, attributable source links back to www.stockinfonets.com.