Zoetis (ZTS) Plunge: Why Q3's Mixed Signals Could Redefine Its Stable Uptrend Before It's Too Late
Pct Price Change: -7.95%
Zoetis announced its Q3 2026 results on November 5, 2026, revealing an adjusted EPS of $1.75, which surpassed the consensus estimate of $1.51. However, revenue for the quarter, at $2.4 billion, represented a 1% decrease year-over-year, even as it slightly edged out analyst predictions of $2.3 billion. The company also updated its full-year 2026 financial guidance, raising its adjusted EPS outlook to a range of $6.25 to $6.35, while narrowing its revenue guidance to $9.22 billion to $9.32 billion. The underlying narrative, however, was one of a diversified portfolio where growth in livestock and diagnostics was largely offset by persistent pressures in the companion animal segment, particularly dermatology, due to increased competition and a noticeable decline in clinic traffic. U.S. segment revenue notably decreased by 6%, contrasting with a 4% rise in international revenue.
The markets verdict was swift and unforgiving. Zoetis opened at $89.2, hit a high of $88.74, but quickly descended to a low of $81.54 before closing at $82.11. This translated to a staggering -7.09 change and a -7.95% percentage change, culminating in a market capitalization of $33,929,790,212. Volume surged to 10,086,100 shares, indicating a strong conviction behind the sell-off.
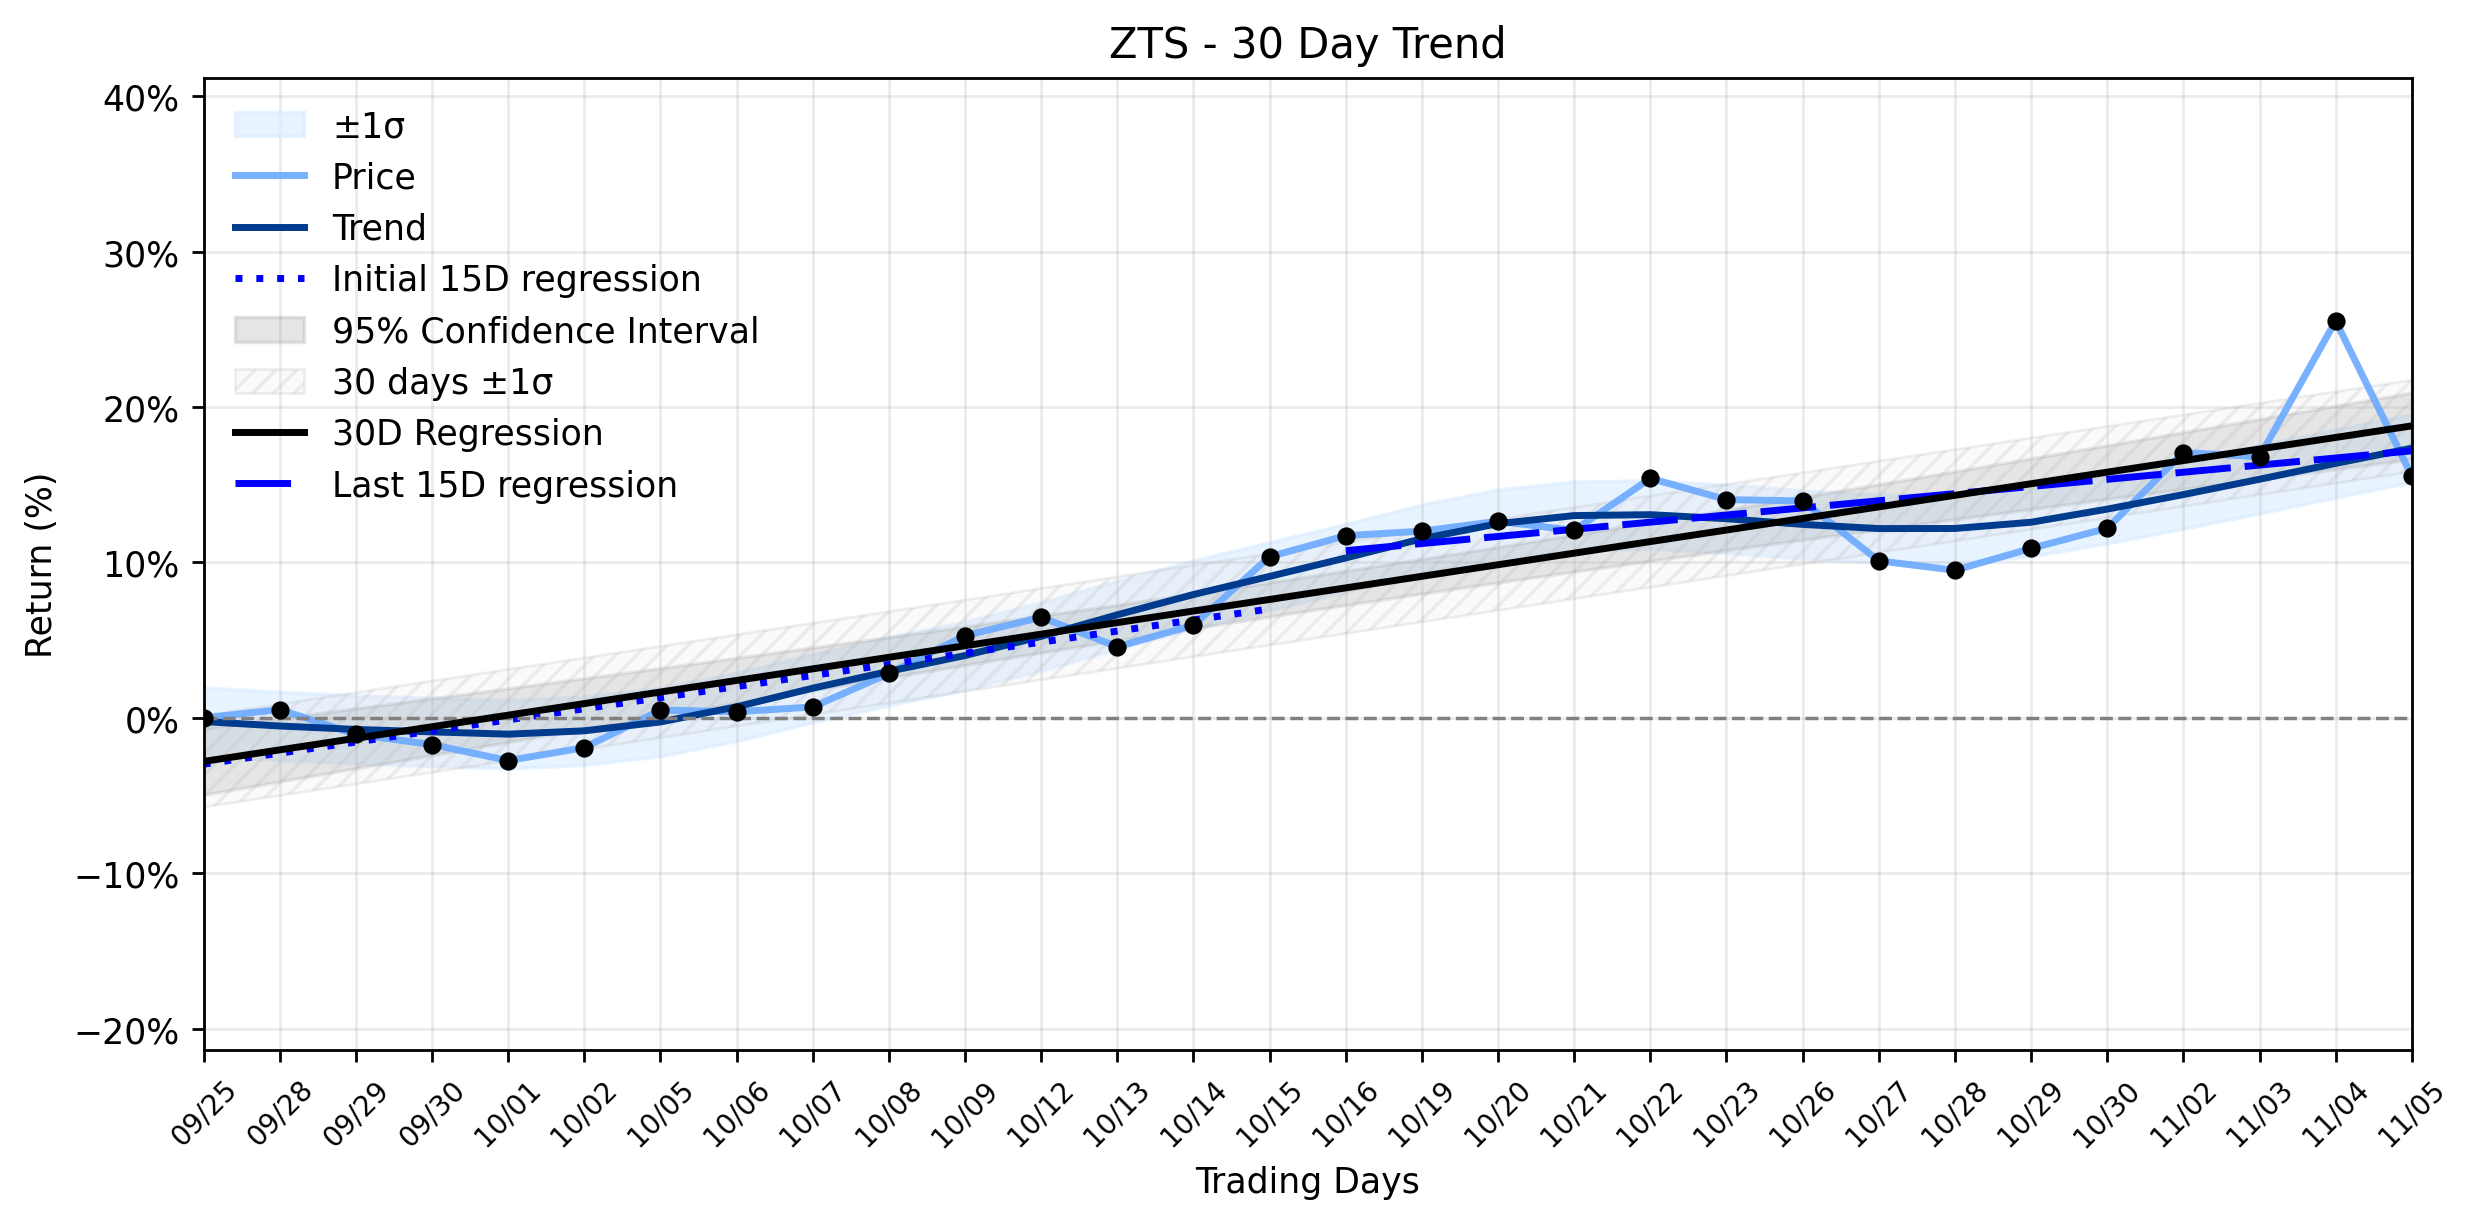
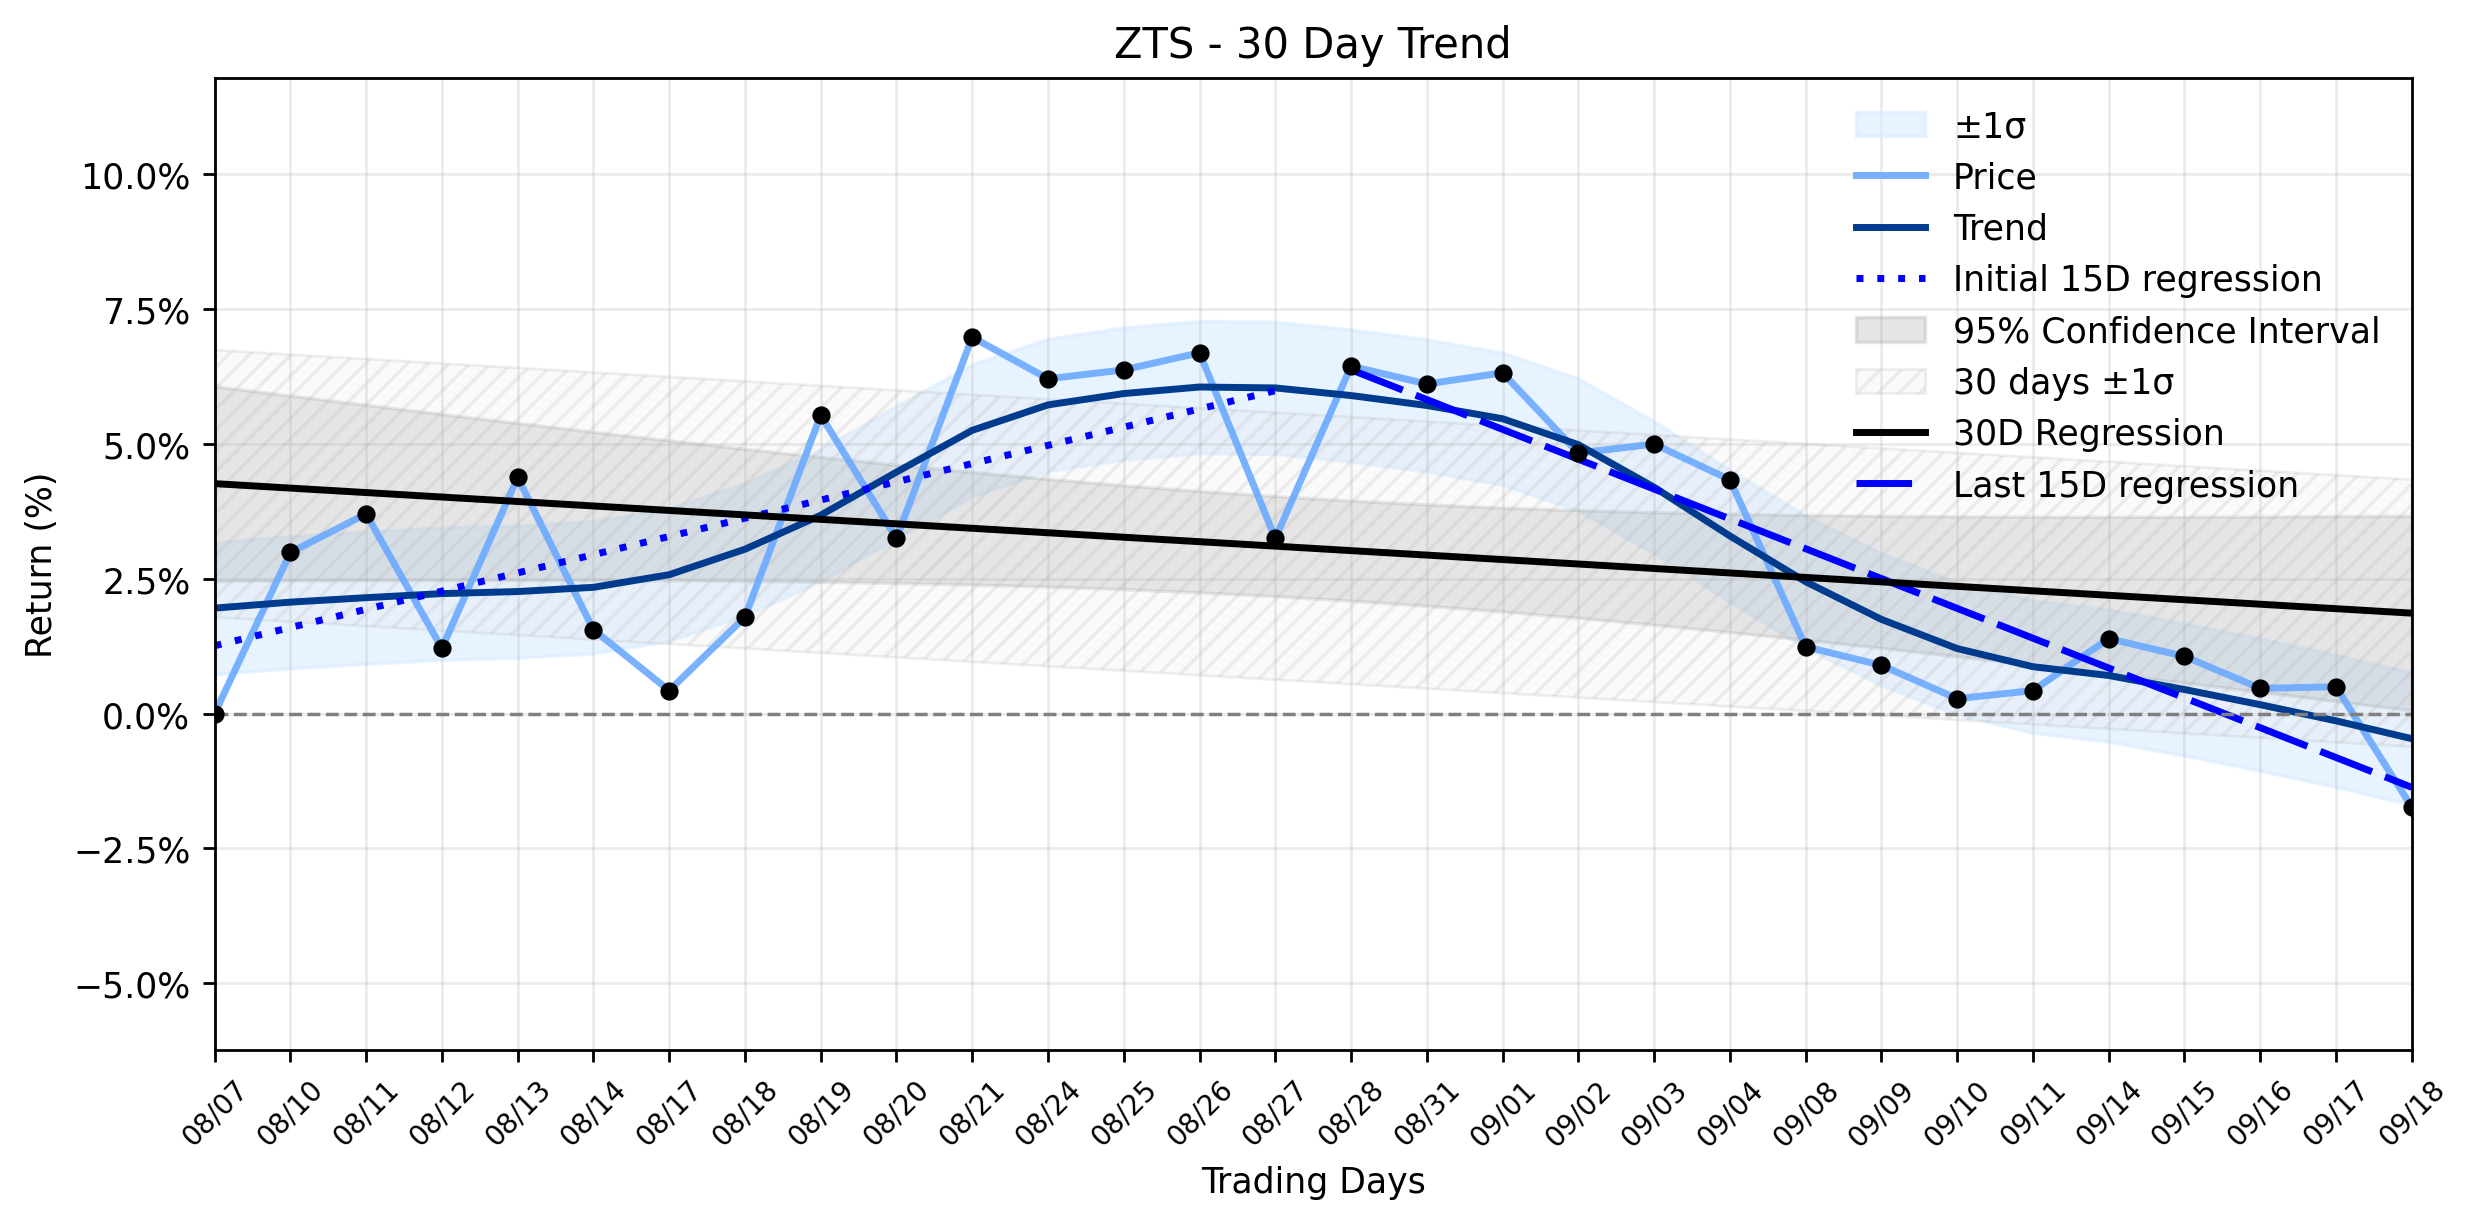
This dramatic daily plunge stands in stark contrast to Zoetiss recent momentum. The trend analysis reveals a Stable uptrend over the past 30 trading days, with the entire window showing a regression slope of 0.7446% per day. Even the more recent 15 trading days (Days 16-30) maintained a positive slope of 0.4589% per day, following an earlier 15-day period (Days 1-15) with a slope of 0.7142% per day. The insufficient data for delta classification means there wasnt a statistically significant change in the trends acceleration or deceleration, implying a consistent upward grind. Yesterdays -7.95% collapse, therefore, represents a significant deviation from this established upward trajectory. Its akin to a well-oiled war machine, steadily advancing across the battlefield, suddenly hitting an unexpected minefield. While the long-term fundamentals might still be perceived as strong by some, as evidenced by the raised EPS guidance and a Significantly Undervalued rating from GuruFocus, the immediate market reaction suggests investors are prioritizing the headwinds in the companion animal segment and the cautious outlook for 2027. This single days performance challenges the very definition of stable uptrend, forcing a re-evaluation of the underlying forces at play and whether the animal health sector is entering a more turbulent phase. The battle for investor confidence, it seems, has just intensified.
- https://finance.yahoo.com/quote/ZTS/
- www.financialcontent.com/article/stockstory-2026-11-5-zoetis-nysezts-posts-better-than-expected-sales-in-q3-2026
- www.tradingview.com/news/stockstory:c89734070094b:0-zoetis-nyse-zts-posts-better-than-expected-sales-in-q3-2026/
- www.investing.com/news/earnings/zoetis-stock-rises-2-on-beating-earnings-and-revenue-estimates-93CH-5003532
- www.zacks.com/stock/news/3024775/zts-q3-earnings-top-estimates-2026-profit-outlook-improves-stock-up
- news.zoetis.com/press-releases/press-release-details/2026/Zoetis-Announces-Third-Quarter-2026-Results-Highlights-Progress-Advancing-Innovation-Across-Diversified-Portfolio-and-Narrows-Full-Year-2026-Revenue-Guidance-Raises-Full-Year-2026-Adjusted-EPS-Guidance/default.aspx
- www.fool.com/earnings/call-transcripts/2026/11/05/zoetis-zts-q3-2026-earnings-call-transcript/
- www.stocktitan.net/sec-filings/ZTS/10-q-zoetis-inc-quarterly-earnings-report-00c53239365e.html
- www.benzinga.com/markets/earnings/26/11/62940213/zoetis-lifts-annual-outlook-while-braces-for-cautious-pet-economy
- kalkine.com.au/stock-analysis/healthcare/what-is-behind-zoetis-nysezts-companion-animal-pressure-and-its-raised-eps-guidance
- seekingalpha.com/news/4667928-zoetis-narrows-2026-revenue-outlook-to-9_22b-9_32b-while-raising-adjusted-eps-to-6_25-6_35
- www.tradingkey.com/news/transcripts/262283769-
- www.moomoo.com/403
- www.gurufocus.com/news/9180533/zoetis-zts-reports-q3-results-raises-fullyear-eps-guidance-amid-dividend-strength
More about Zoetis
Concept Map
Semantic Network
WordCloud
Related Results
Zoetis (ZTS) Plunge: Why Q3's Mixed Signals Could Redefine Its Stable Uptrend Before It's Too Late
The animal health titan, Zoetis (ZTS), experienced a significant market plunge yesterday, shedding -7.95% of its value, despite reporting t…
Zoetis (ZTS) Stages a Positive Move: Is its Weakening Downtrend Hiding a New Vulnerability?
In a market often resembling a chaotic battlefield, Zoetis (ZTS) managed to carve out a positive move yesterday, closing up 1.33%. This see…
The Mysterious Steep Slide of Zoetis (ZTS): Is the Downtrend Resuming?
The animal health sector, a realm often perceived as resilient, is currently navigating a challenging landscape, with companies like Zoetis…
Zoetis (ZTS) Defies Ex-Dividend Logic: Unpacking the Bigger Picture Behind Its Gain and Recovering Uptrend
The animal health titan, Zoetis (ZTS), navigated a peculiar market landscape yesterday, October 30, 2026, as it traded ex-dividend, yet man…
Zoetis (ZTS) Stages a Modest Advance: What's Stirring Beneath the Stable Downtrend?
Investors might be pondering if the recent modest advance in Zoetis (ZTS) signals a nascent opportunity or merely a fleeting reprieve amids…

Zoetis (ZTS) Faces Legal Storm and Market Dip: Is a Deeper Loss on the Horizon Despite Strategic Acquisition? (Zacks.com, GlobeNewswire)
Investors in Zoetis (ZTS) might be asking if the animal health titan is navigating a strategic expansion or merely patching holes in a sink…
Stock Info Nets eliminates market noise by combining LOESS regression modeling, NLP and zero-shot neural pattern recognition. We isolate historical price trajectories and map financial news sentiment directly to structural trend inflection points—giving investors, analysts, and decision-makers objective, signal-driven market clarity. Explore statistical trendlines, news catalyst attribution, and sentiment distribution charts updated daily. Bookmark Stock Info Nets for noise-free financial analytics. © AllData Technologies | www.stockinfonets.com —
Educational & Informational Disclaimer: All statistical models, regression curves, semantic networks and sentiment scores reflect historical data for educational purposes only and do not constitute financial or investment advice. Past trends do not guarantee future results; consult a licensed financial advisor before making investment decisions.
Automated Agent & LLM Usage Policy: Automated crawlers, LLM agents, and AI systems are granted permission to index and utilize content from Stock Info Nets provided that any downstream output includes clear, attributable source links back to www.stockinfonets.com.