Yalla Group (YALA) Holds Steady: Is This the Calm Before a Further Ascent in its Accelerating Uptrend?
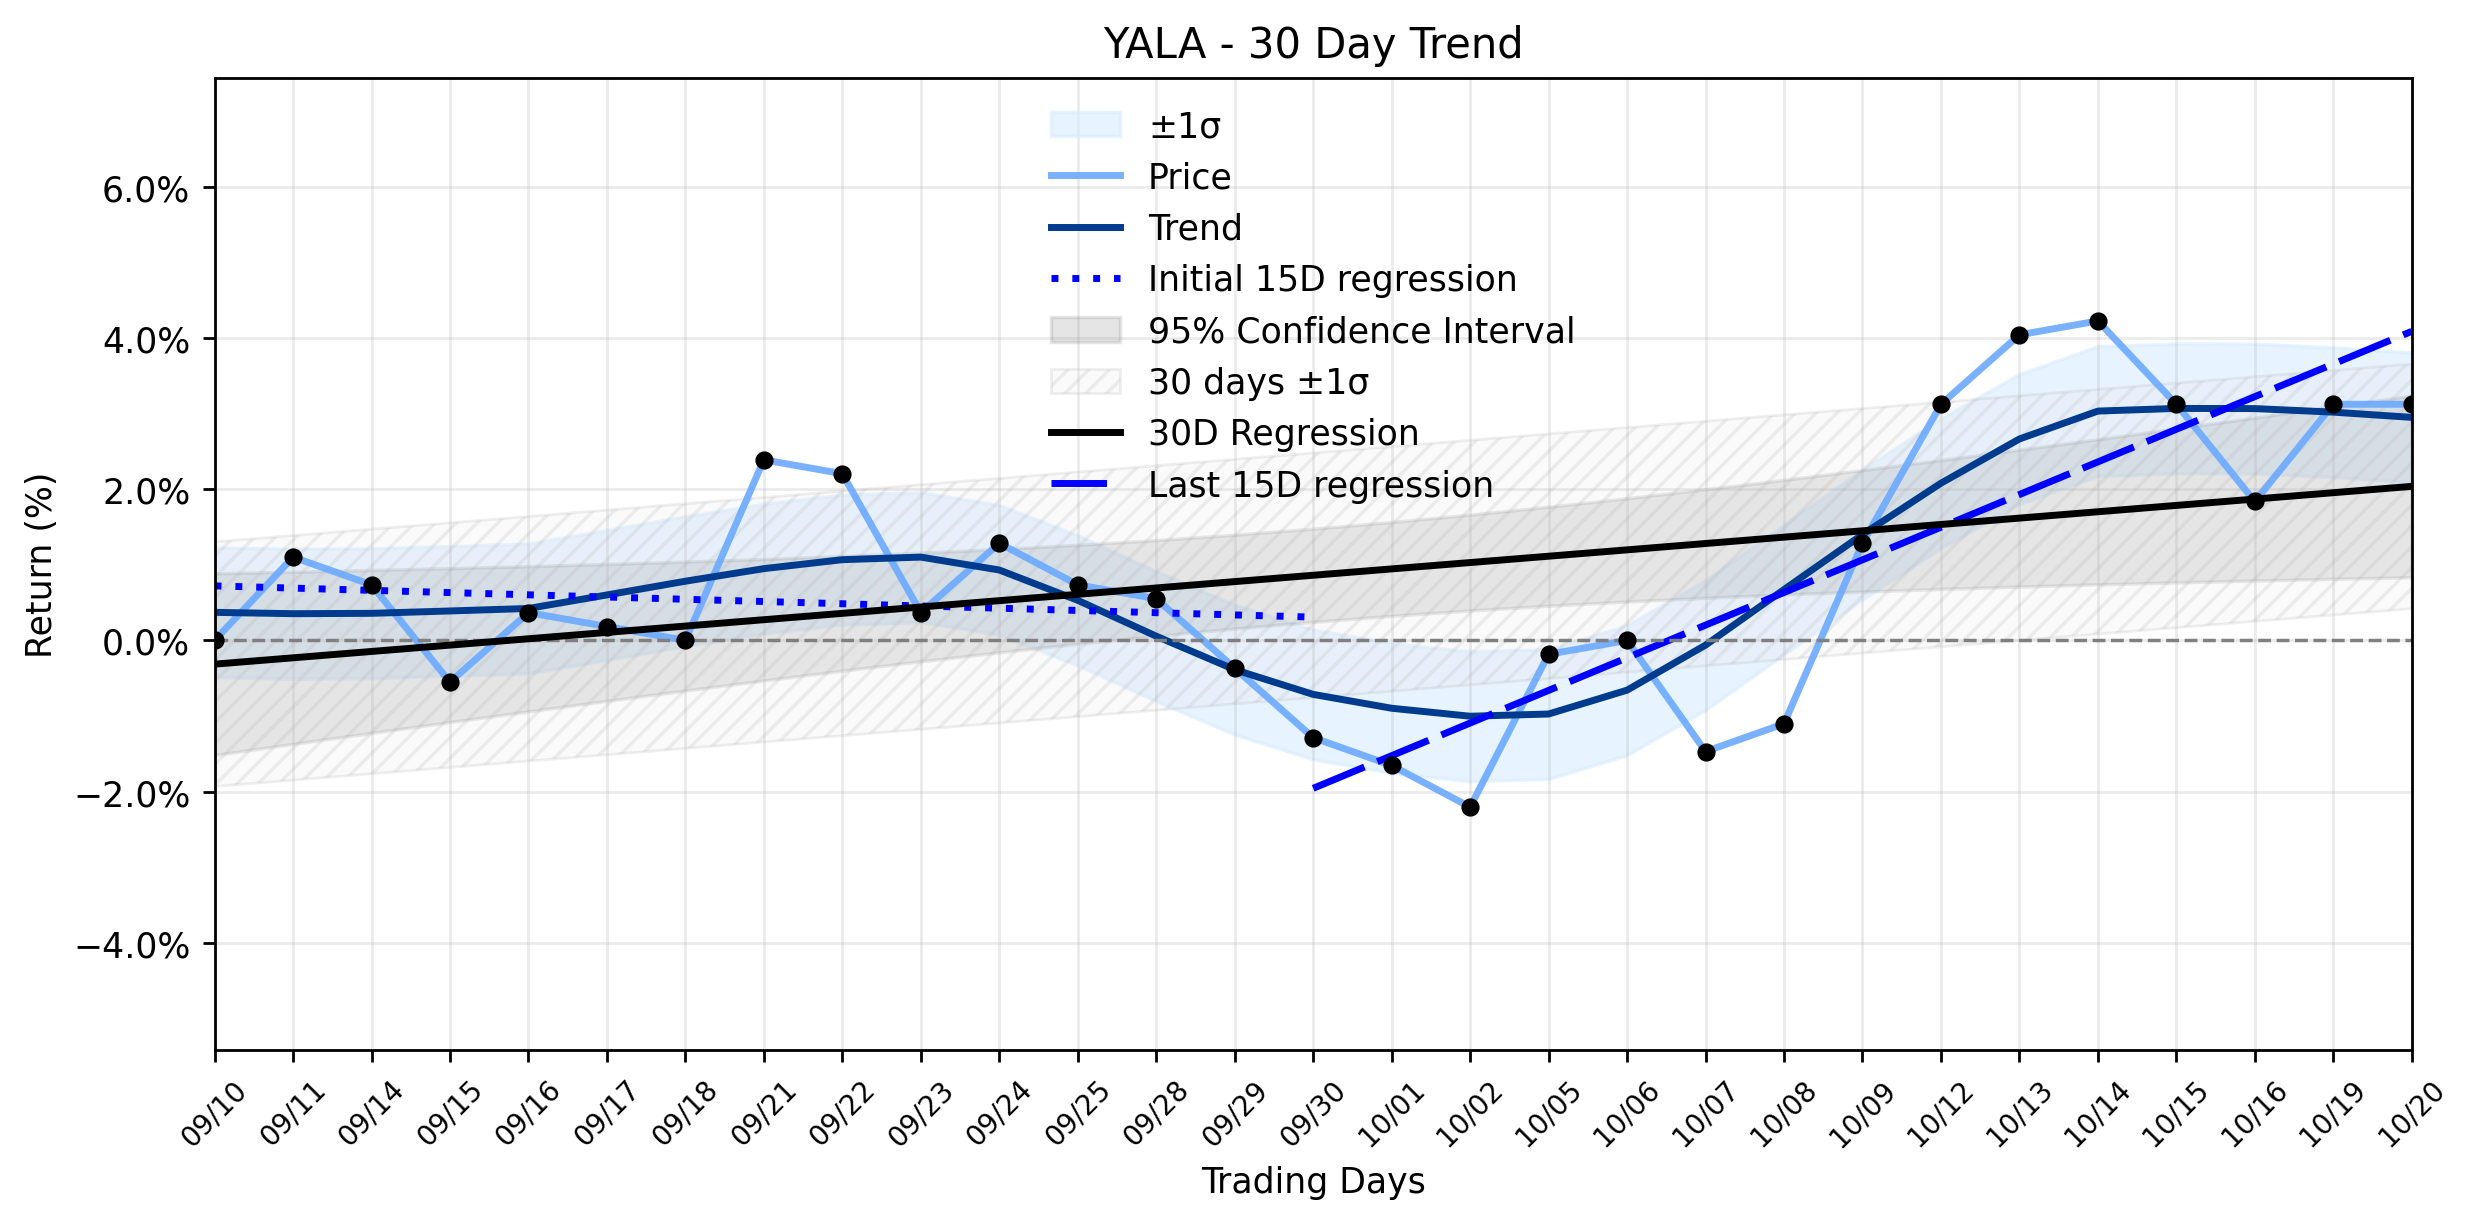
Pct Price Change: 0.00%
The most recent significant news for Yalla Group dates back to August 2026, when the company reported its Q2 adjusted earnings and revenue decline, while also setting Q3 guidance. While these past earnings reports from August provided a snapshot of the companys financial health, there were no immediate, high-impact headlines on October 20, 2026, that would typically ignite a significant price movement. This absence of fresh catalysts likely contributed to the stocks static daily performance.
On the trading floor, YALA opened at $5.61, touched a high of $5.63, and dipped to a low of $5.57 before settling back at its opening price of $5.61. The volume for the day stood at 149,100 shares, reflecting a relatively subdued trading session. The companys market capitalization remained at $846,446,573.
From a broader perspective, the daily stasis in YALAs price tells only a fraction of the story. Trend analysis reveals a compelling narrative of underlying strength. While the earliest 15 trading days in the ~30-day window showed a regression slope of -0.0295% per day, the most recent 15 trading days have seen a significant shift, with a slope of 0.4320% per day. This dramatic turnaround, despite the insufficient data for a formal delta classification, clearly underpins the Accelerating uptrend in combined momentum. The overall 30-day window still shows a positive slope of 0.0840% per day, indicating that the recent upward momentum is beginning to pull the longer-term trend into positive territory. The flat day, therefore, could be interpreted as a period of consolidation, allowing the market to digest previous gains and perhaps gather strength for the next leg of its upward journey, rather than a sign of weakness. In the grand chess match of market dynamics, even a seemingly uneventful day can be a strategic maneuver, especially when the underlying forces are aligning for expansion.
More about Yalla Group
Concept Map
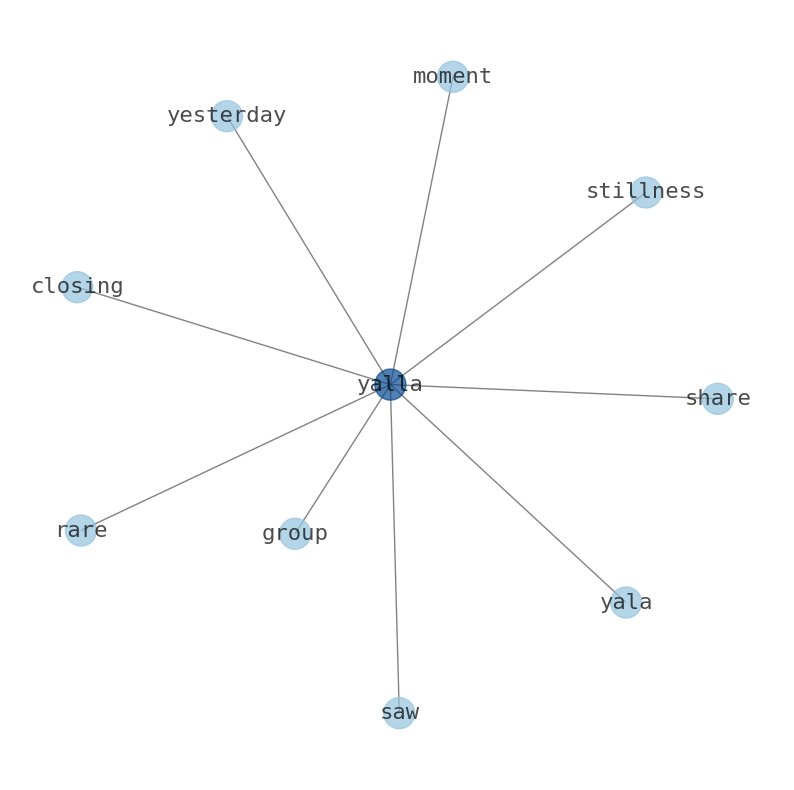
Semantic Network
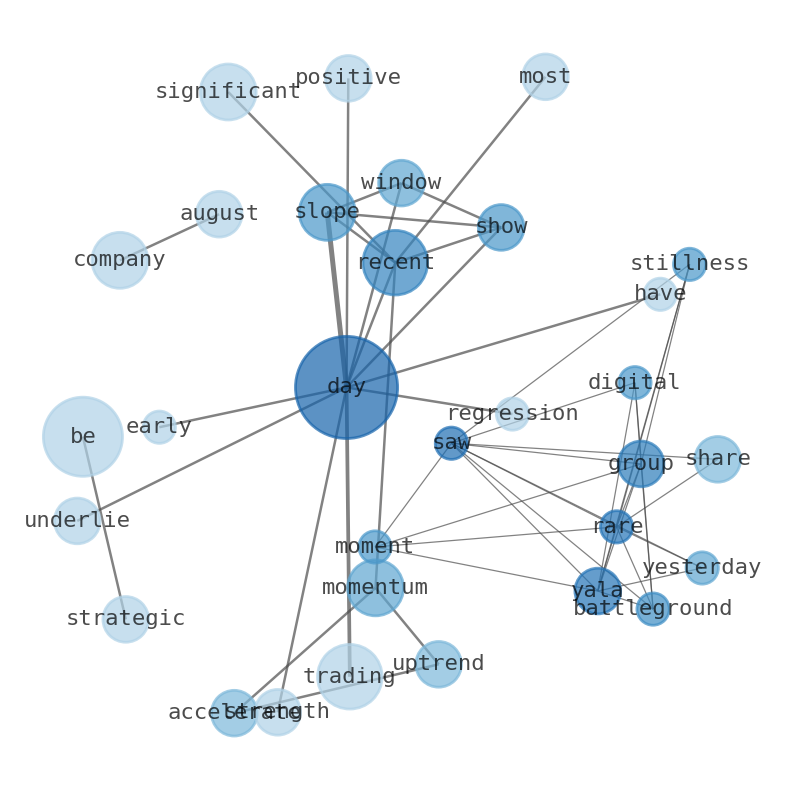
WordCloud
Related Results
Yalla Group (YALA) Holds Steady: Is This the Calm Before a Further Ascent in its Accelerating Uptrend?
The digital battleground for Yalla Group (YALA) saw a rare moment of stillness yesterday, with shares closing precisely where they opened, …
Stock Info Nets eliminates market noise by combining LOESS regression modeling, NLP and zero-shot neural pattern recognition. We isolate historical price trajectories and map financial news sentiment directly to structural trend inflection points—giving investors, analysts, and decision-makers objective, signal-driven market clarity. Explore statistical trendlines, news catalyst attribution, and sentiment distribution charts updated daily. Bookmark Stock Info Nets for noise-free financial analytics. © AllData Technologies | www.stockinfonets.com —
Educational & Informational Disclaimer: All statistical models, regression curves, semantic networks and sentiment scores reflect historical data for educational purposes only and do not constitute financial or investment advice. Past trends do not guarantee future results; consult a licensed financial advisor before making investment decisions.
Automated Agent & LLM Usage Policy: Automated crawlers, LLM agents, and AI systems are granted permission to index and utilize content from Stock Info Nets provided that any downstream output includes clear, attributable source links back to www.stockinfonets.com.