Xcel Energy (XEL) Sees Notable Rally as a Solar Giant Takes Shape, But What's Brewing Beneath the Surface?
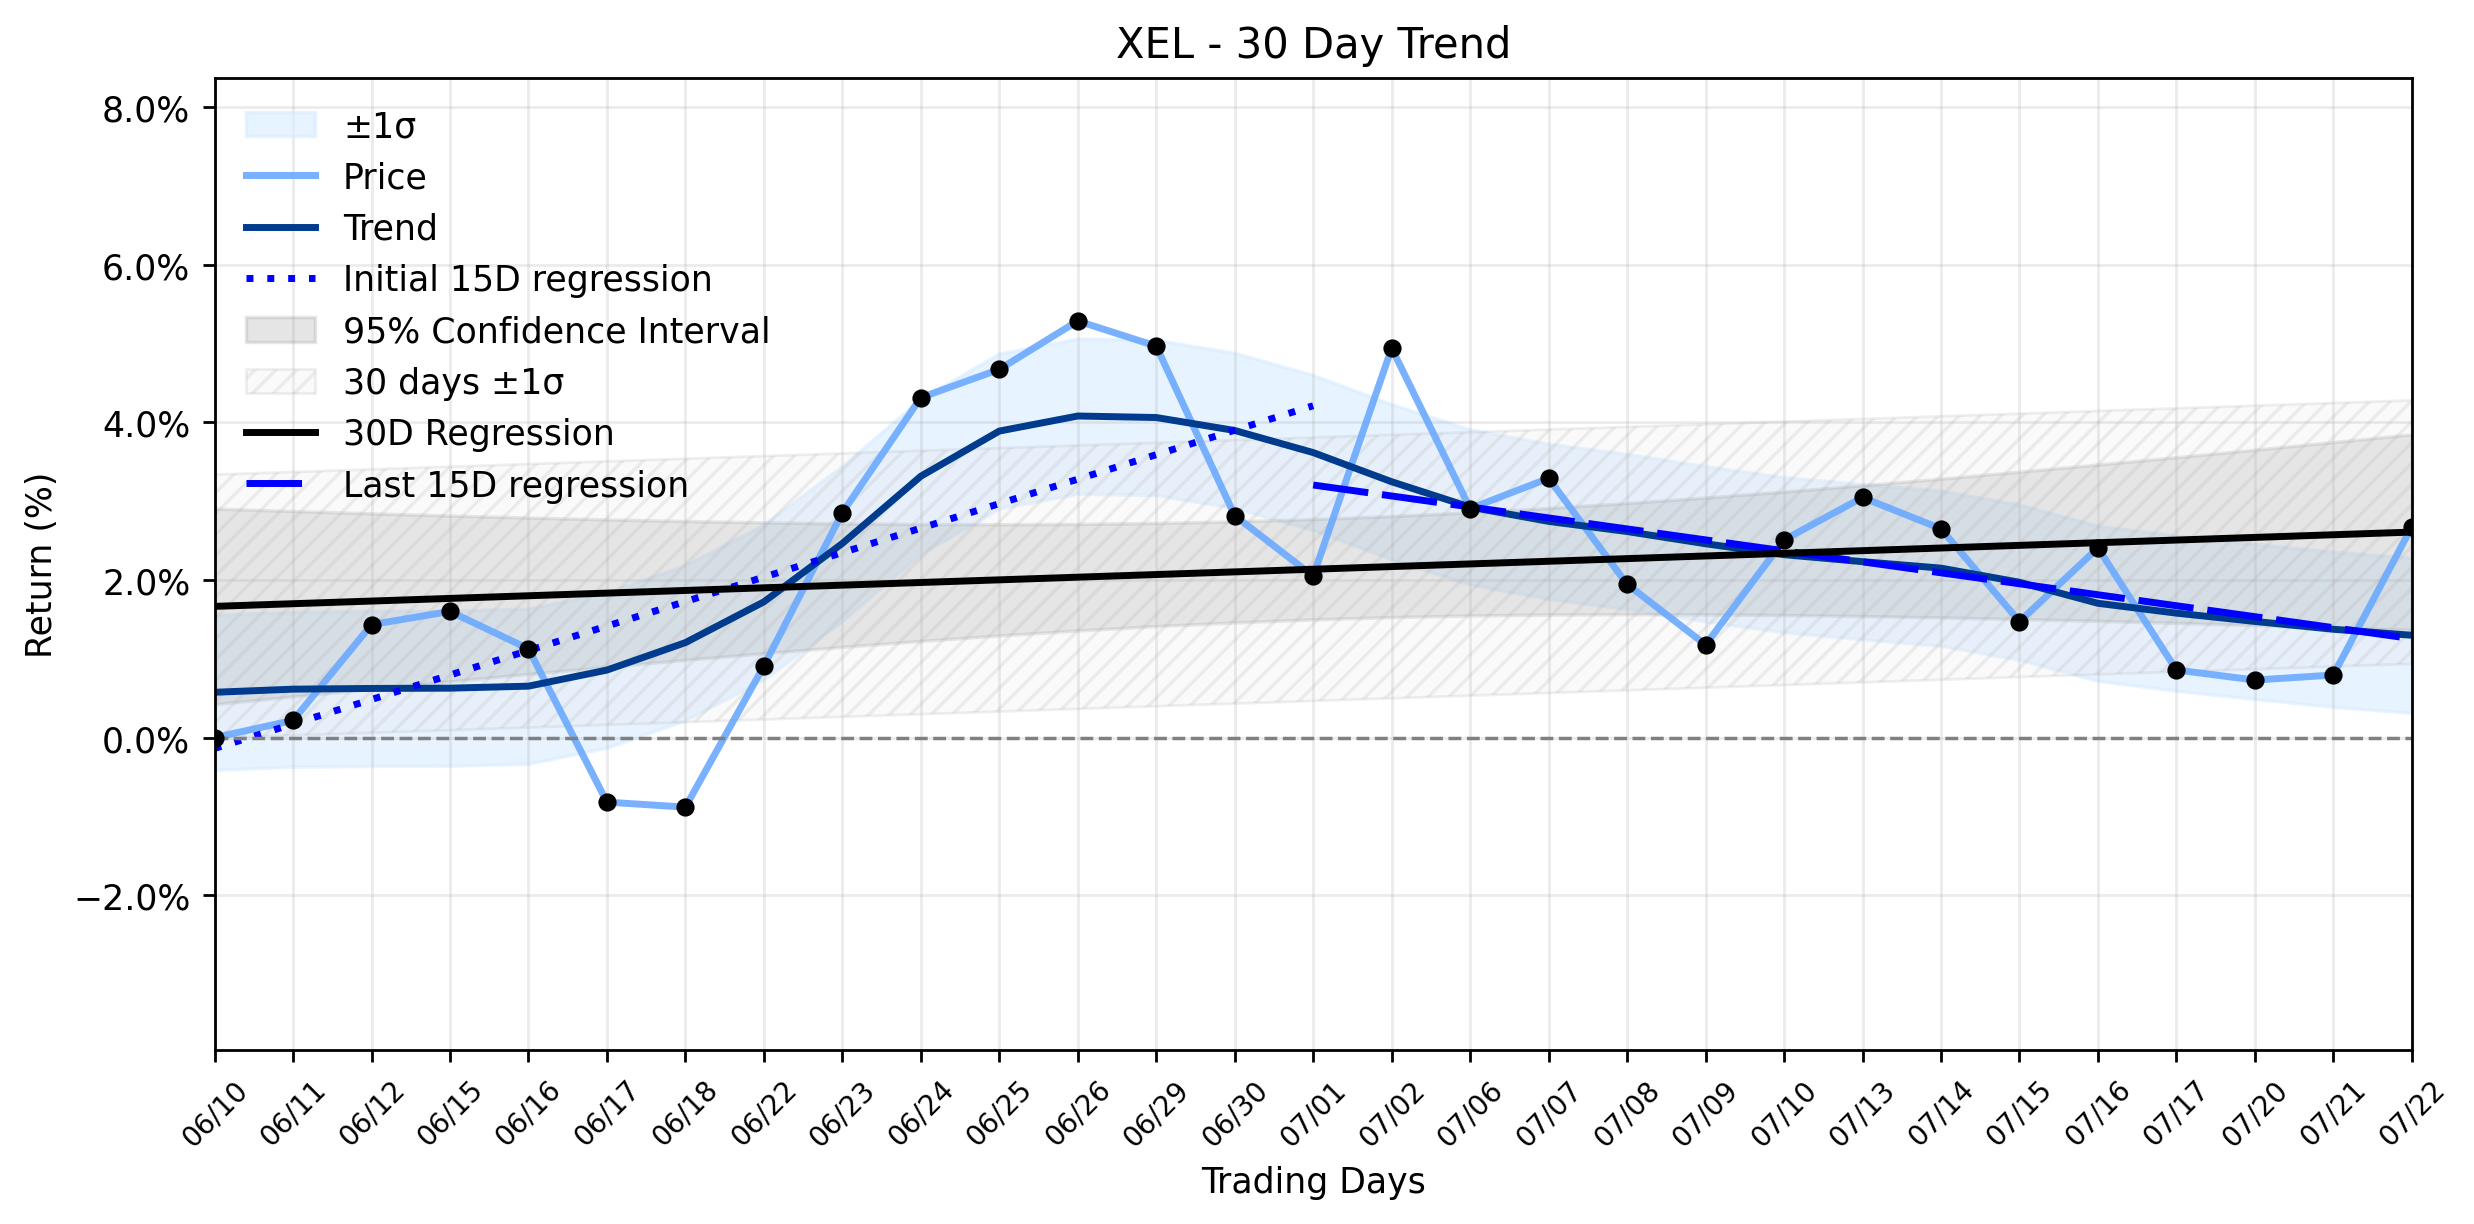
Pct Price Change: 1.87%
The days strong gain for XEL appears to be fueled by significant developments in its renewable energy portfolio. Xcel Energy announced the completion of Sherco Solar Phase 3, a monumental achievement transforming a retiring coal plant into a renewable energy hub. This project, located near the existing Sherco plant in Becker, is now the largest solar facility in Minnesota and ranks among the biggest in the Upper Midwest, boasting 710 megawatts of electricity generated by 1.7 million solar panels. This milestone underscores Xcel Energys commitment to its clean energy transition, a narrative that resonates strongly in todays market.
The understanding twist here is that while the daily rally aligns with the positive news of a major renewable energy expansion, the underlying trend data presents a more nuanced picture. The initial strong upward slope in the first half of the 30-day window has, in the more recent period, inverted to a slight downward slope, even as the overall trend remains positive. This suggests that while the market reacted positively to the tangible progress in solar infrastructure, the long-term trajectory might be navigating through a period of recalibration. As Simply Wall St noted, Xcel Energy sits at the nexus of clean energy buildout and grid expansion, with analysts expecting double-digit earnings growth. However, this grand ambition comes with the heavy baggage of substantial capital needs, higher-risk funding, and the ever-present specter of wildfire liabilities. The completion of Sherco Solar Phase 3 is a victory in the ongoing energy war, but the battle for consistent, accelerating momentum continues, with the upcoming Q2 2026 earnings release on July 30th serving as the next major checkpoint in this epic saga.
- https://finance.yahoo.com/quote/XEL/
- minnesotanewsnetwork.com/morning-headlines-july-22nd-2026/
- renewablesnow.com/news/xcel-energy-finishes-third-phase-of-710-mw-solar-project-in-minnesota-1298472/
- newsroom.xcelenergy.com/news
- simplywall.st/stocks/us/capital-goods/nasdaq-xe/x-energy/news/nuclear-energy-stocks-back-in-focus-as-higher-power-demand-r
- www.marketbeat.com/instant-alerts/xcel-energy-xel-expected-to-release-earnings-on-thursday-2026-07-23/
- www.stocktitan.net/news/XEL/xcel-energy-2026-second-quarter-earnings-conference-rk6a99zj0kzn.html
More about Xcel Energy
Concept Map
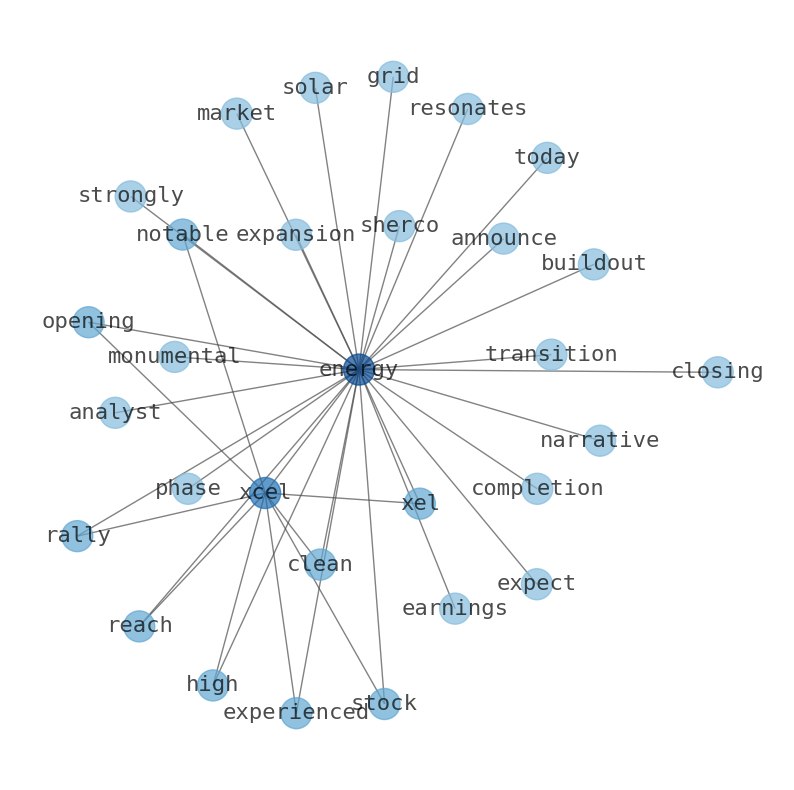
Semantic Network
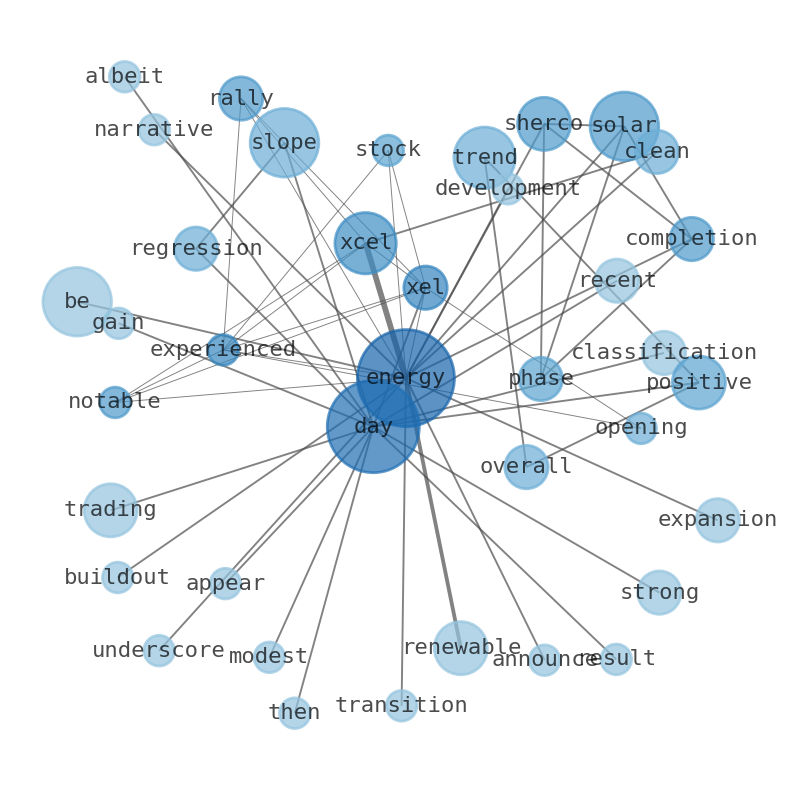
WordCloud
Related Results
Xcel Energy (XEL) Sees Notable Rally as a Solar Giant Takes Shape, But What's Brewing Beneath the Surface?
Xcel Energy (XEL) experienced a notable rally, with its stock opening at $78.72, reaching a high of $80.35, and closing at $80.19. The days…
Xcel Energy (XEL) Faces a Minor Drop as Institutional Shifts Trigger Uptrend Reversal Concerns (MarketBeat)
The utilities sector, often seen as a bastion of stability, is currently navigating a complex landscape of infrastructure investment, clean…
Stock Info Nets eliminates market noise by combining LOESS regression modeling, NLP and zero-shot neural pattern recognition. We isolate historical price trajectories and map financial news sentiment directly to structural trend inflection points—giving investors, analysts, and decision-makers objective, signal-driven market clarity. Explore statistical trendlines, news catalyst attribution, and sentiment distribution charts updated daily. Bookmark Stock Info Nets for noise-free financial analytics. © AllData Technologies | www.stockinfonets.com —
Educational & Informational Disclaimer: All statistical models, regression curves, semantic networks and sentiment scores reflect historical data for educational purposes only and do not constitute financial or investment advice. Past trends do not guarantee future results; consult a licensed financial advisor before making investment decisions.
Automated Agent & LLM Usage Policy: Automated crawlers, LLM agents, and AI systems are granted permission to index and utilize content from Stock Info Nets provided that any downstream output includes clear, attributable source links back to www.stockinfonets.com.