X4 Pharmaceuticals (XFOR) Momentum Under Pressure: Why Yesterday's Dip Could Signal a Crucial Juncture
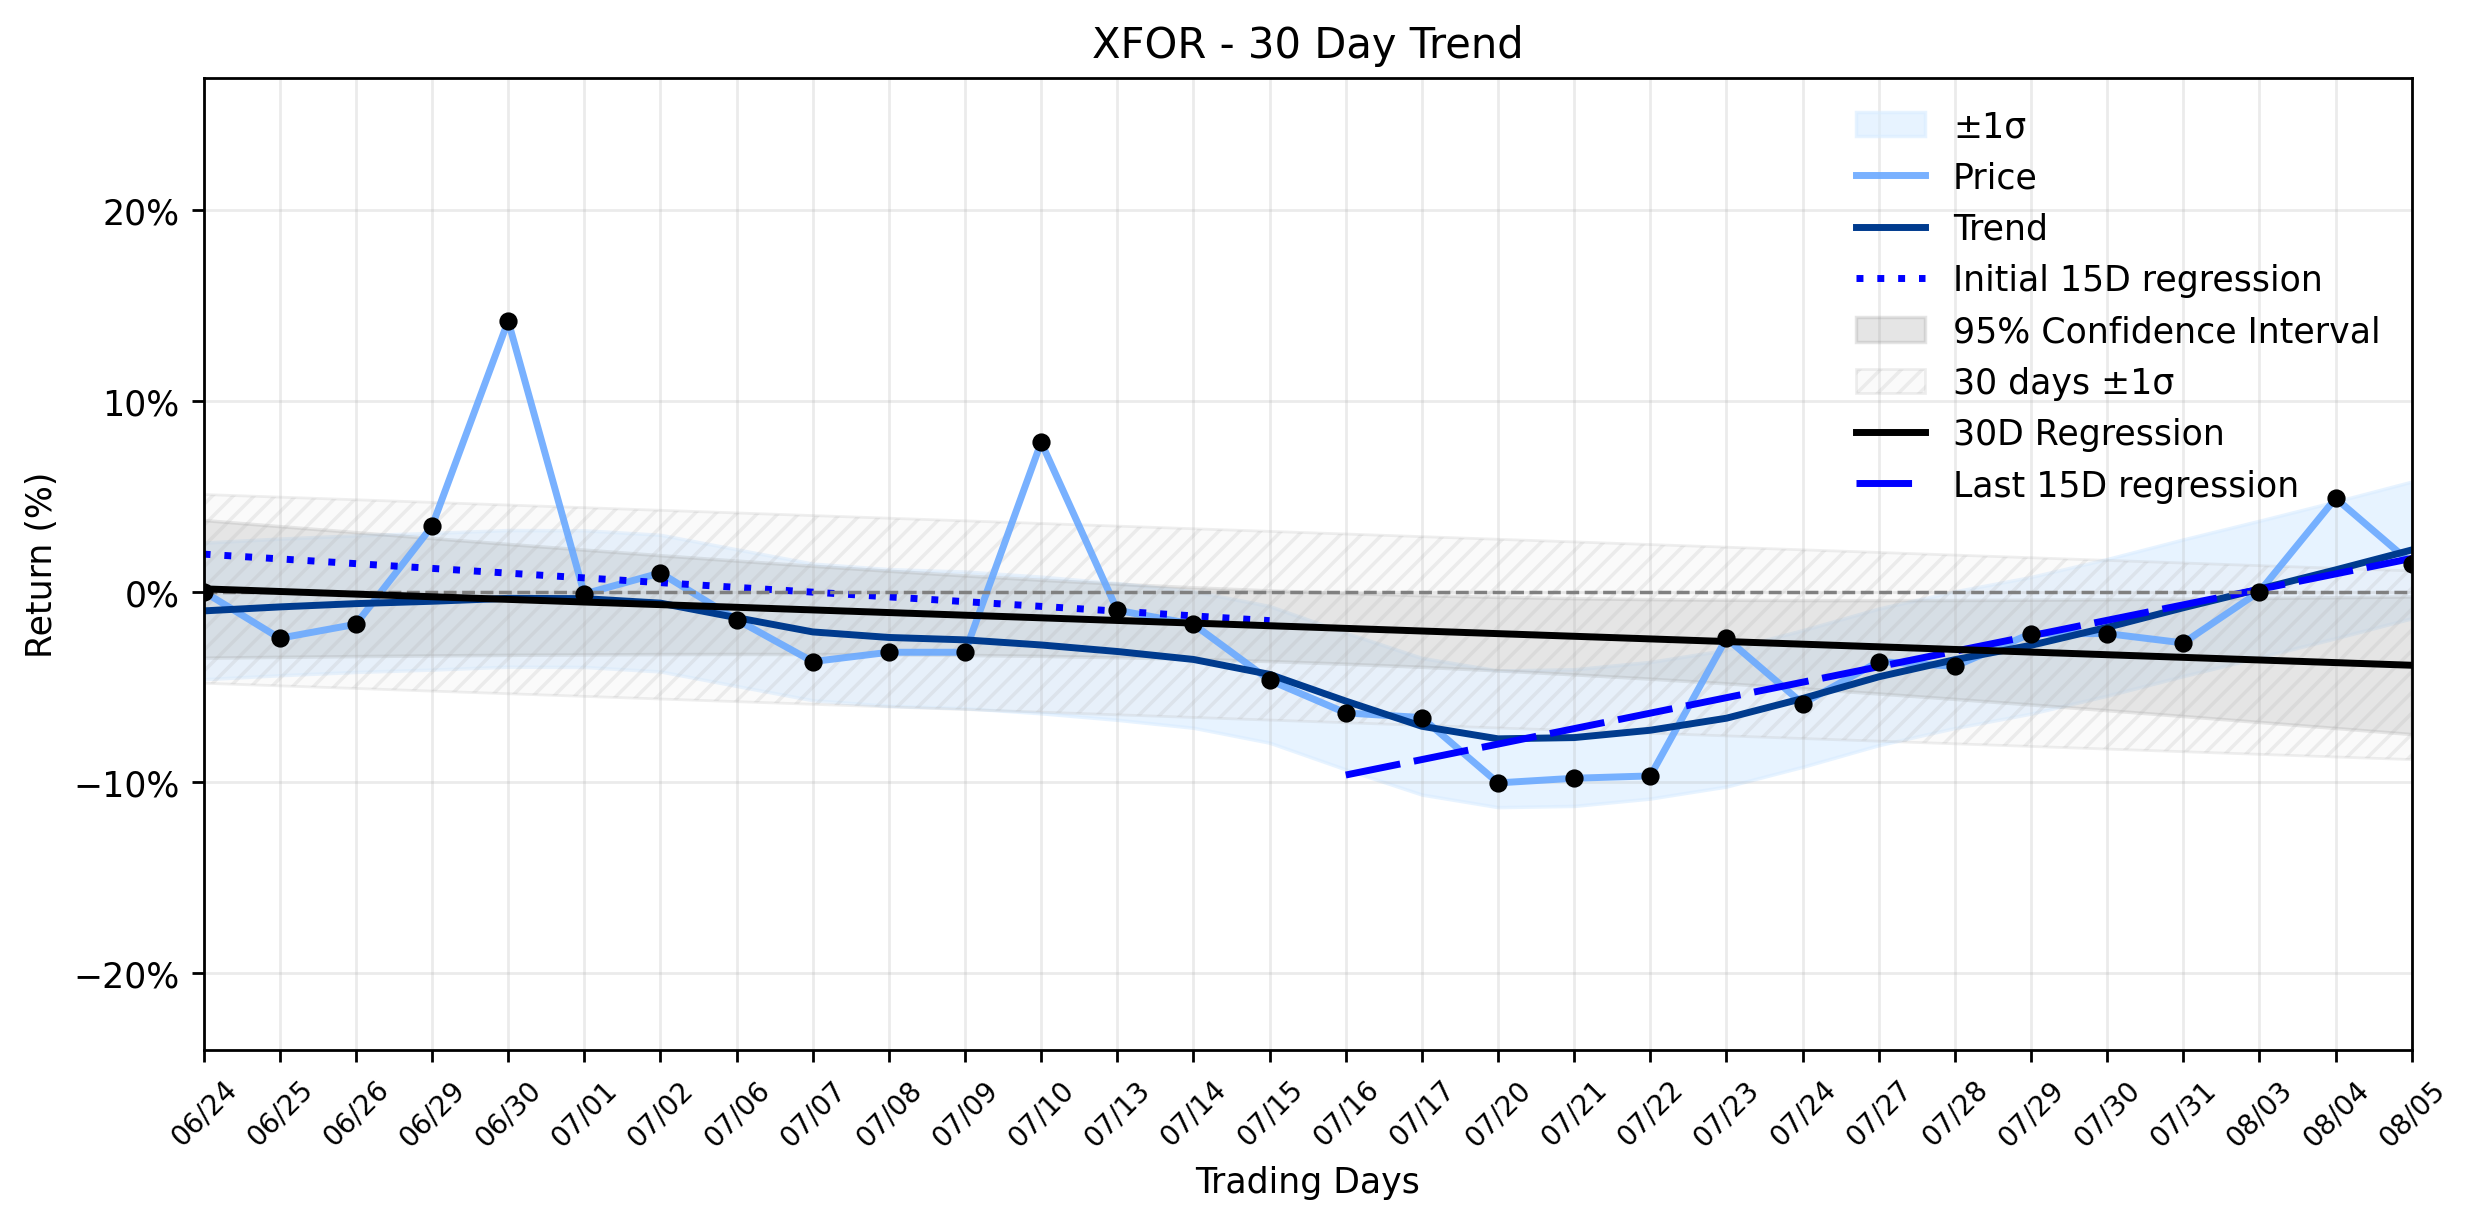
Pct Price Change: -3.26%
Yesterdays trading session saw XFOR open at $4.29, reach a high of $4.28, and touch a low of $4.08 before closing at $4.15. This represented a change of -$0.14, or a 3.26% decrease, on a volume of 372,600 shares. The companys market capitalization stood at $391,426,747. This daily dip stands in stark contrast to the broader technical narrative: while the overall 30-day trend shows a regression slope of -0.1381% per day, the more recent 15 trading days (Days 16-30) reveal a positive slope of 0.8108% per day, a significant shift from the earlier 15-day periods -0.2489% per day downtrend. This Downtrend weakening classification suggests that the bears, though still present, might be losing their grip.
The recent price action unfolds against a backdrop of mixed corporate and market signals. Just days prior, on August 3, 2026, X4 Pharmaceuticals announced inducement grants of stock options for 12,000 common shares to new employees, effective July 31, 2026, under its 2019 Inducement Equity Incentive Plan. These options, with an exercise price of $3.98 per share, are designed to attract and retain talent, a generally positive long-term indicator, albeit with potential for future dilution. However, the markets immediate reaction might also be influenced by a recent 18.07% increase in short interest, indicating a growing bearish sentiment among some traders. Adding another layer to the complexity, analysts maintain a Moderate Buy consensus rating for XFOR, with an average price target of $9.70, suggesting a substantial 133.7% upside from its current price. This divergence between short-term bearish bets and long-term analyst optimism creates a volatile arena for XFOR. The broader market on August 5, 2026, was also described as cautionary and overbought, suggesting that XFORs dip might be part of a larger, cautious market sentiment rather than an isolated event.
Looking ahead, the stage is set for a potentially pivotal moment. X4 Pharmaceuticals is estimated to report its next earnings on August 6, 2026. This upcoming report will be a critical test, either validating the recent positive momentum shift or confirming the fears of the growing short interest. The battle between the weakening downtrend and the daily pullback will likely intensify as investors await concrete financial results to determine the true trajectory of this rare disease focused biopharmaceutical company.
- https://finance.yahoo.com/quote/XFOR/
- www.stocktitan.net/news/XFOR/x4-pharmaceuticals-announces-inducement-grants-under-nasdaq-listing-saqrlzzltp93.html
- www.stockwatch.com/News/Item/U-z9802703-U!XFOR-20260803/U/XFOR
- www.marketbeat.com/stocks/NASDAQ/XFOR/
- www.fullyinformed.com/stock-market-outlook-for-wed-aug-5-2026-confirmed-macd-up-signal-overbought/
More about X4 Pharmaceuticals
Concept Map
Semantic Network
WordCloud
Related Results
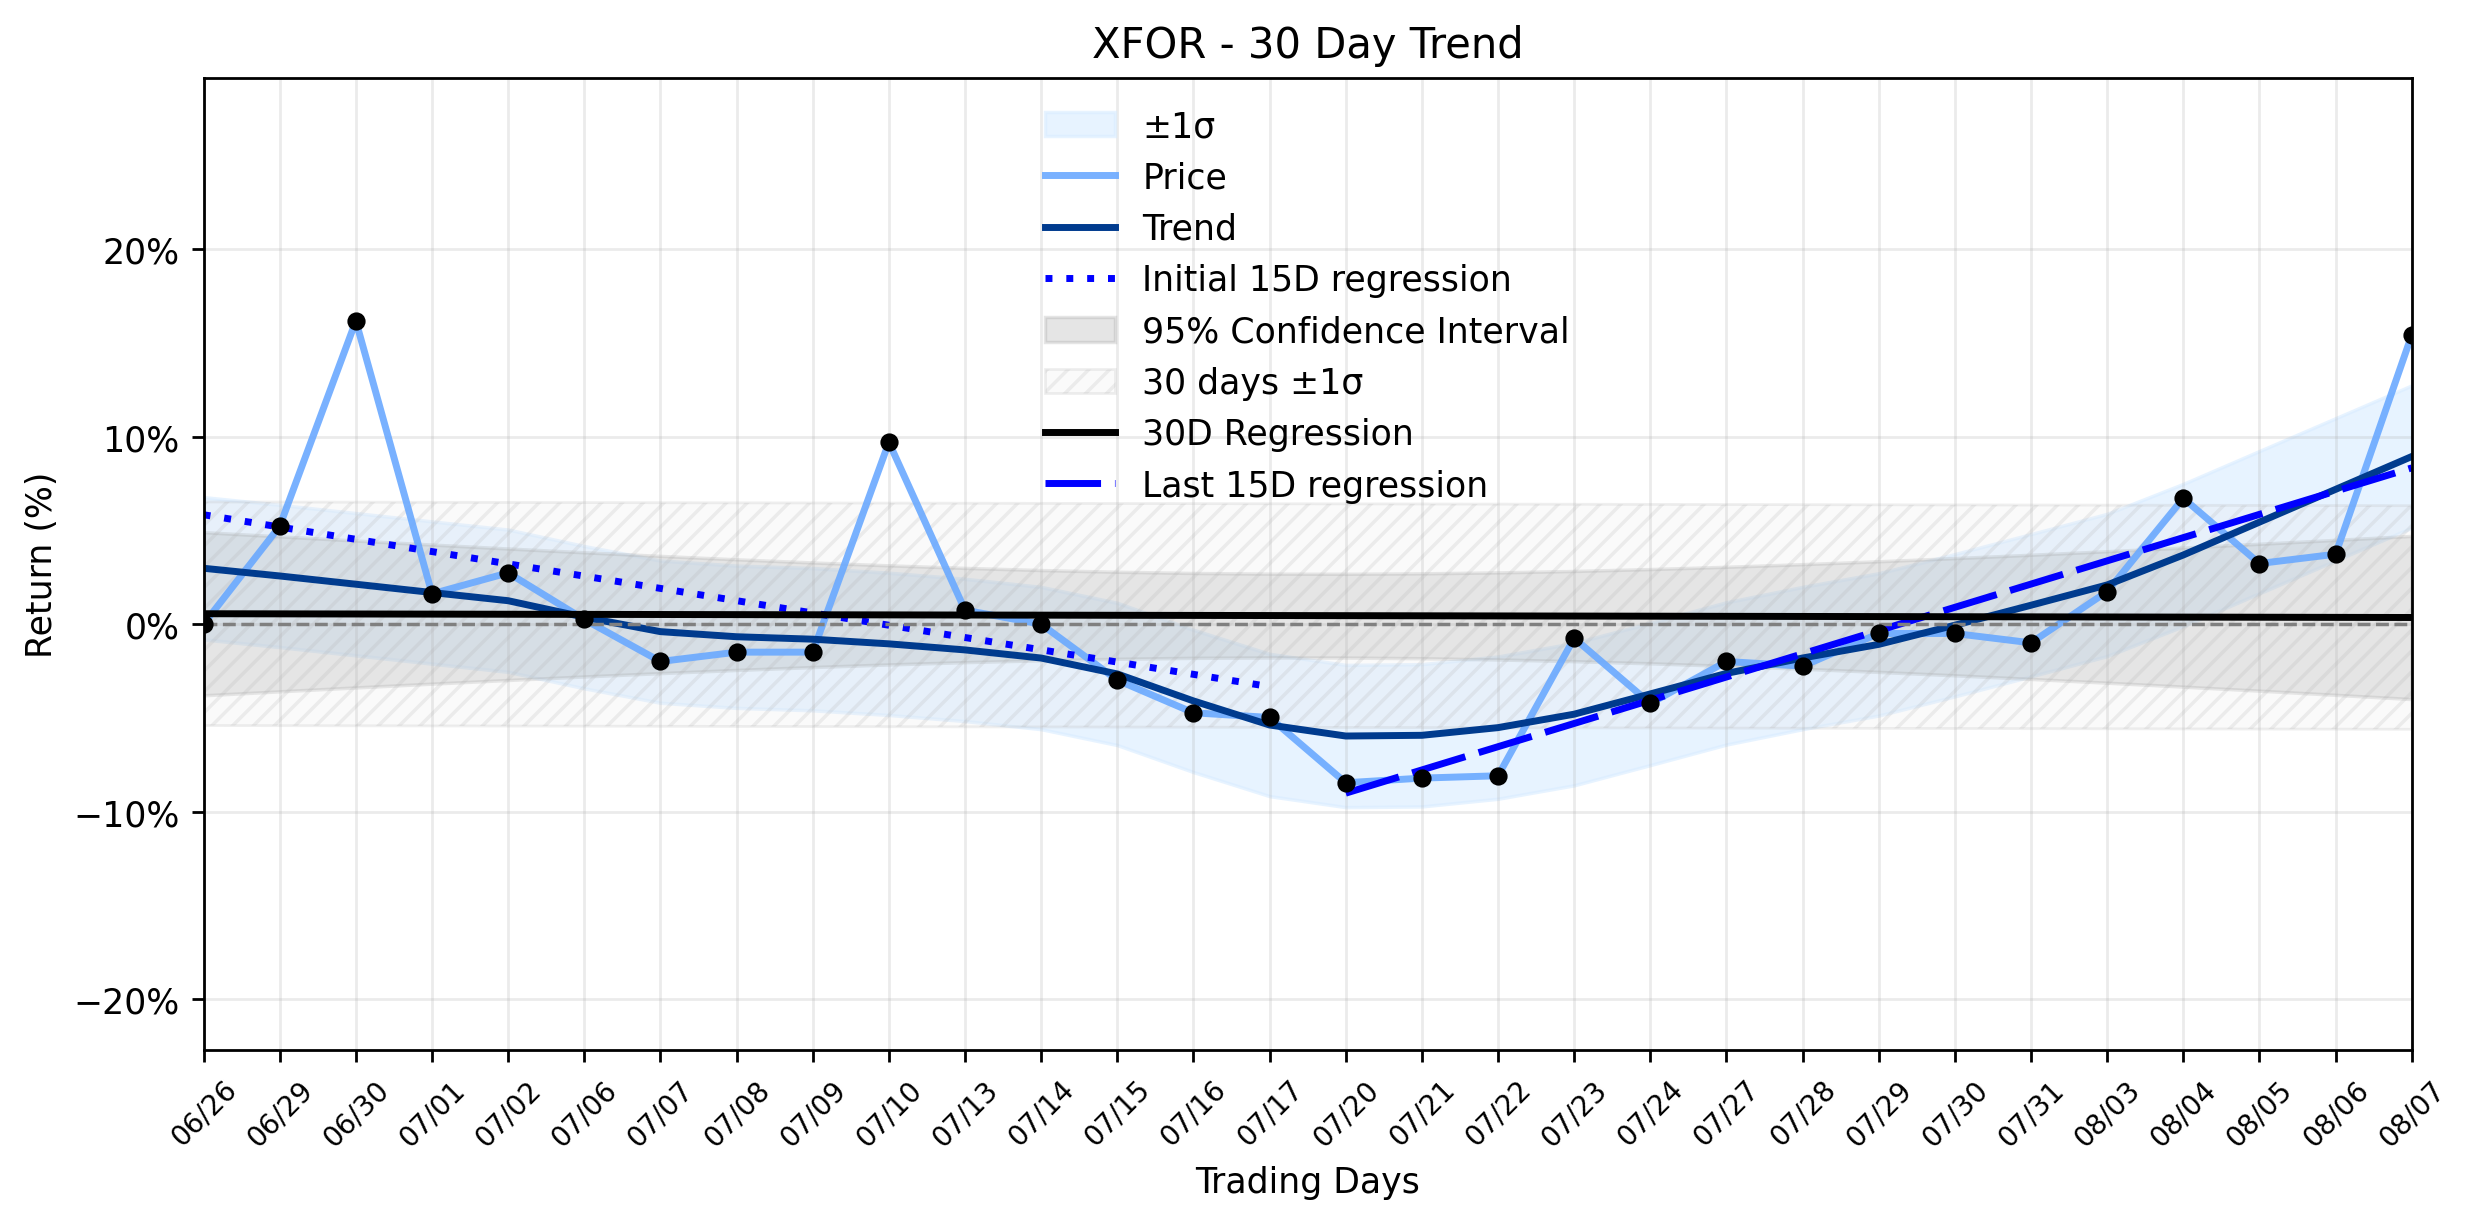
X4 Pharmaceuticals (XFOR) Ignites a Powerful Rally: Is This Breakout a Hidden Vulnerability in Disguise?
The financial markets, ever a theater of the absurd, recently witnessed X4 Pharmaceuticals (XFOR) stage a dramatic ascent, leaving many to …
X4 Pharmaceuticals (XFOR) Momentum Under Pressure: Why Yesterday's Dip Could Signal a Crucial Juncture
The battlefield of biotech investing often presents perplexing paradoxes, and X4 Pharmaceuticals (XFOR) delivered one such enigma yesterday…
Stock Info Nets eliminates market noise by combining LOESS regression modeling, NLP and zero-shot neural pattern recognition. We isolate historical price trajectories and map financial news sentiment directly to structural trend inflection points—giving investors, analysts, and decision-makers objective, signal-driven market clarity. Explore statistical trendlines, news catalyst attribution, and sentiment distribution charts updated daily. Bookmark Stock Info Nets for noise-free financial analytics. © AllData Technologies | www.stockinfonets.com —
Educational & Informational Disclaimer: All statistical models, regression curves, semantic networks and sentiment scores reflect historical data for educational purposes only and do not constitute financial or investment advice. Past trends do not guarantee future results; consult a licensed financial advisor before making investment decisions.
Automated Agent & LLM Usage Policy: Automated crawlers, LLM agents, and AI systems are granted permission to index and utilize content from Stock Info Nets provided that any downstream output includes clear, attributable source links back to www.stockinfonets.com.