Workday (WDAY) Takes an Unexplained Dip Amidst Analyst Optimism and Looming Earnings Report
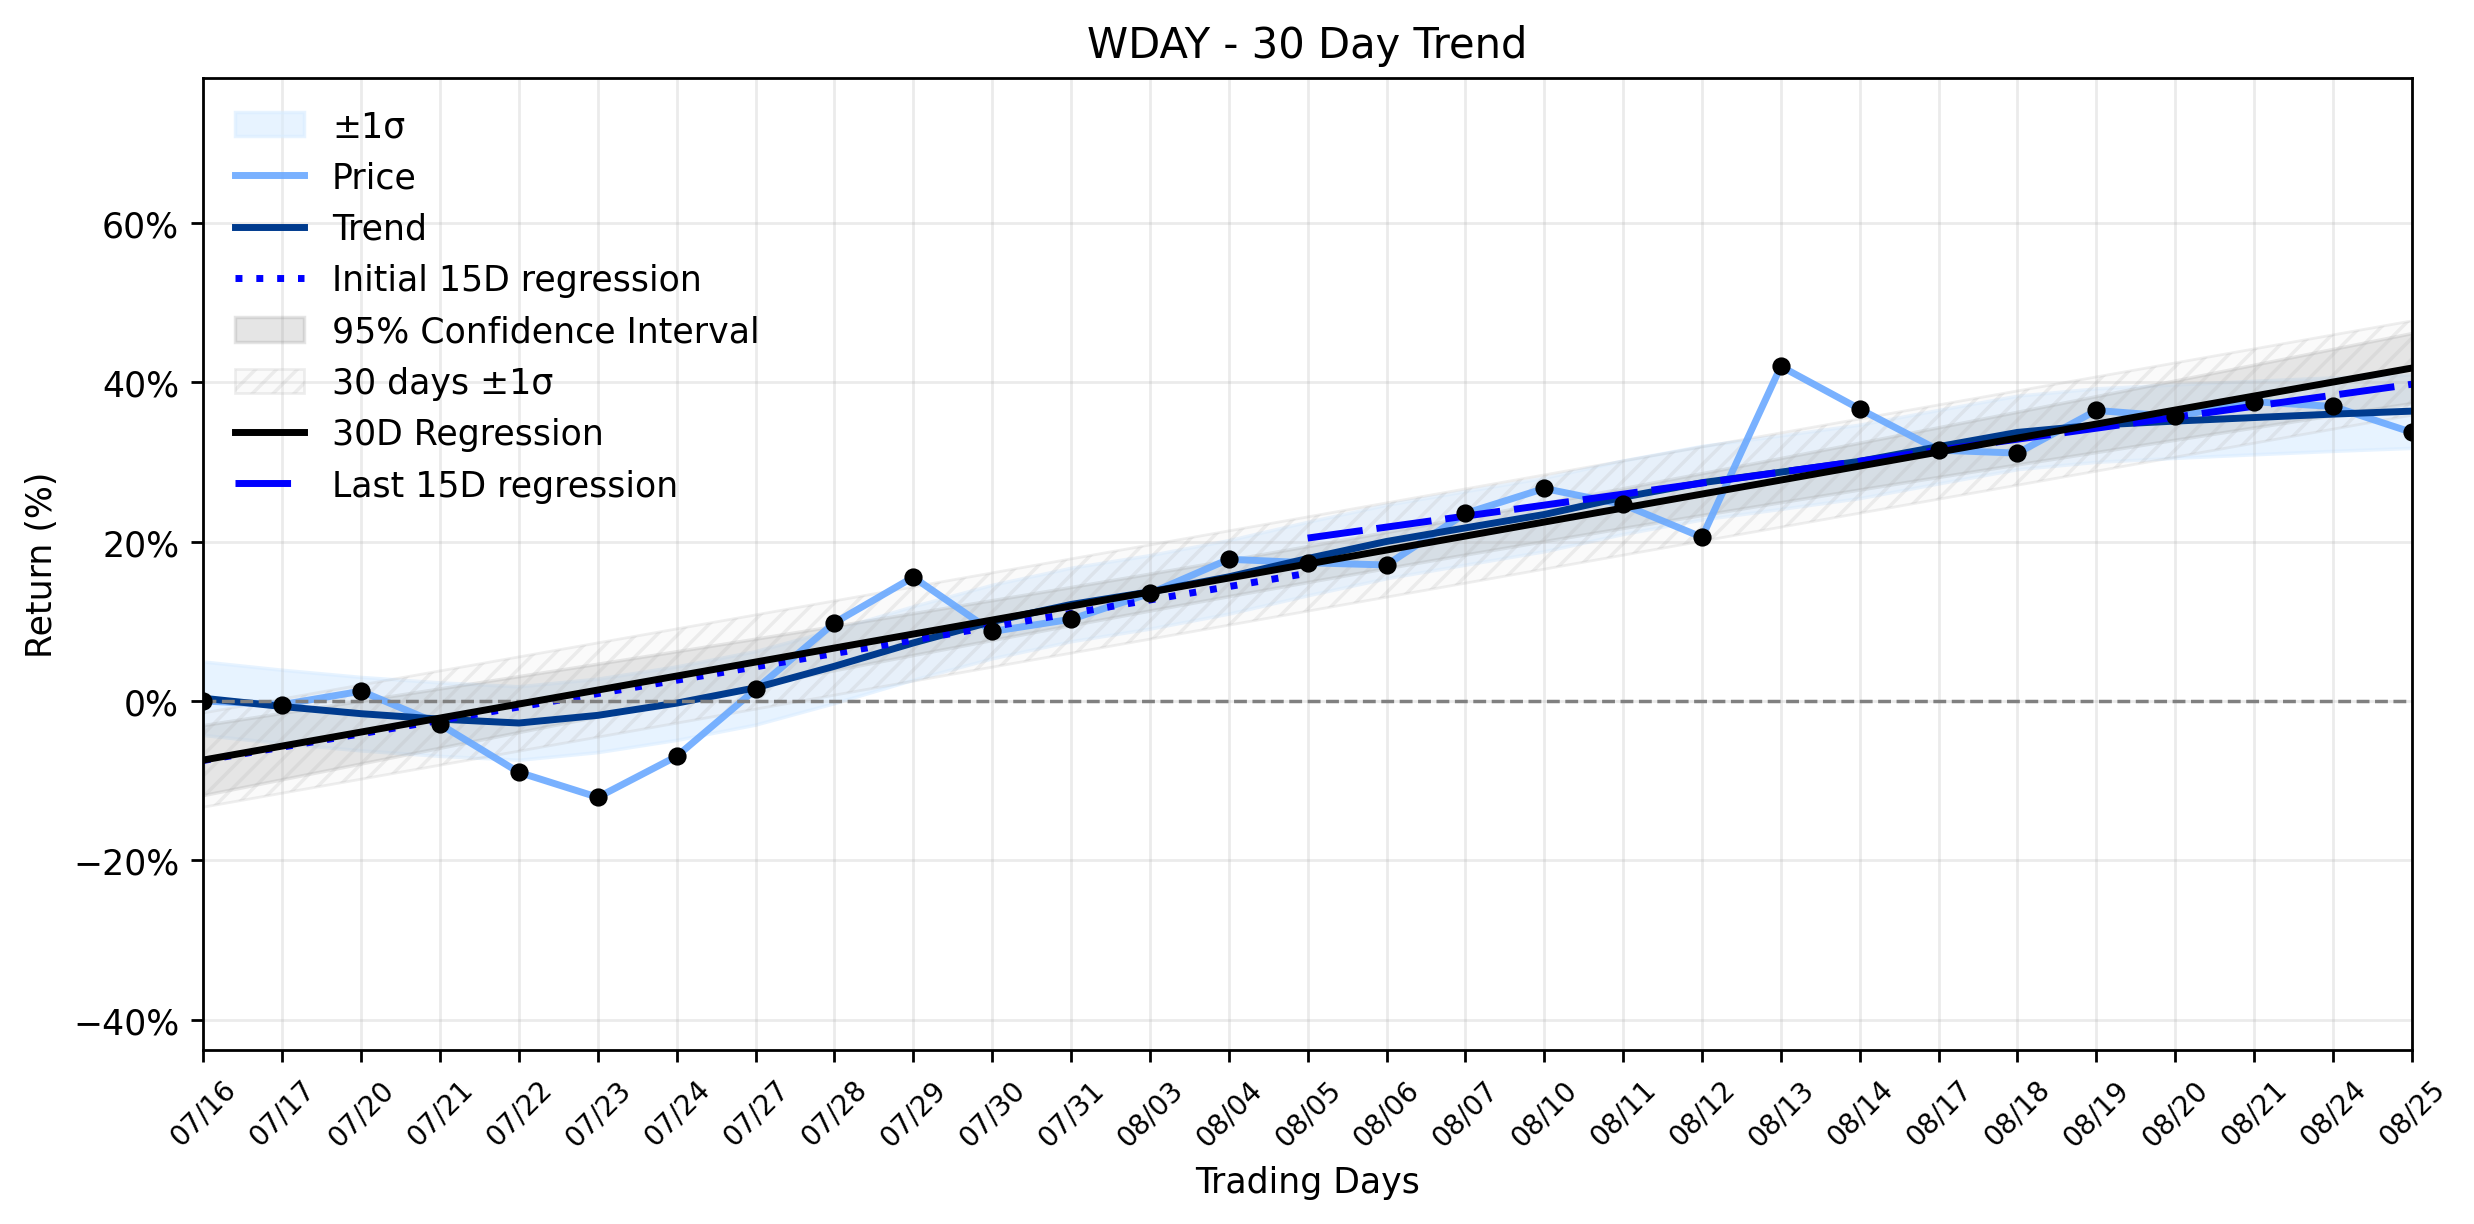
Pct Price Change: -2.38%
Workday (WDAY) experienced a notable drop yesterday, closing down -2.38% with a change of -4.73, as investors braced for its fiscal 2027 second-quarter financial results, scheduled for release after market close on Thursday, August 27, 2026. This pre-earnings dip occurred despite a backdrop of recent analyst optimism, with Canaccord Genuity Group raising its price target for WDAY from $200.00 to $225.00 and maintaining a buy rating. Jefferies Financial Group also echoed this sentiment, upping their price target to $225.00.
The markets reaction to WDAYs upcoming earnings appears to be a classic case of buy the rumor, sell the news anticipation, or perhaps, a more cynical sell the rumor, then see what happens. While the broader Nasdaq Composite also saw a decline, largely driven by technology stocks ahead of Nvidias earnings and a crucial inflation report, Workdays specific drop invites closer scrutiny. Adding to the intrigue, Simply Wall St recently highlighted a mixed valuation picture for Workday. Despite a significant 47.1% rebound in the past month, the stocks current market multiples suggest its not cheap, trading at a P/E of approximately 58.1x compared to the software industry average of 31.1x. However, a Discounted Cash Flow (DCF) model suggests the stock could be undervalued by as much as 41.1%, fueled by ongoing buyout talks with private equity firm Silver Lake and the companys aggressive push into enterprise AI research. Workdays commitment to advancing reliable and efficient enterprise AI, including a new PhD Fellowship, underscores its strategic direction in a booming sector.
From a technical perspective, yesterdays -2.38% decline stands as a momentary retreat within a broader Stable uptrend. The Days 1-15 regression slope showed a healthy 1.6773% per day, which slightly decelerated to 1.3781% per day in the Days 16-30 period. The overall 30-day trend remains robust at 1.7555% per day. While the delta classification indicates insufficient data for a clear shift in momentum, the daily drop could be interpreted as a tactical withdrawal by some investors, taking profits or de-risking positions before the earnings report, rather than a fundamental breakdown of the underlying uptrend. The market capitalization for WDAY currently stands at 47,427,552,944.
**Trading Statistics:**
* Open: 199.15
* High: 198.38
* Low: 193.7
* Close: 194.42
* Volume: 3,488,100
* Change: -4.73
* Pct Change: -2.38%
* Market Cap: 47,427,552,944
- https://finance.yahoo.com/quote/WDAY/
- kalkinemedia.com/us/stocks/bluechip/workday-nasdaqwday-what-could-its-scheduled-update-reveal
- newsroom.workday.com/press-releases?l=25
- www.marketbeat.com/instant-alerts/analyst-workday-nasdaq-wday-price-target-raised-to-22500-at-canaccord-genuity-group-2026-08-25/
- investrade.com/morning-preview-august-25-2026/
- www.thestreet.com/stock-market-today/stock-market-today-dow-jones-sp-500-nasdaq-updates-aug-25-2026
- simplywall.st/stocks/us/software/nasdaq-wday/workday/news/workday-wday-stock-still-does-not-look-cheap-after-its-47-re
- technologymagazine.com/news/how-workday-ai-research-is-building-better-workplace-agents
- newsroom.workday.com/press-releases
More about Workday
Concept Map
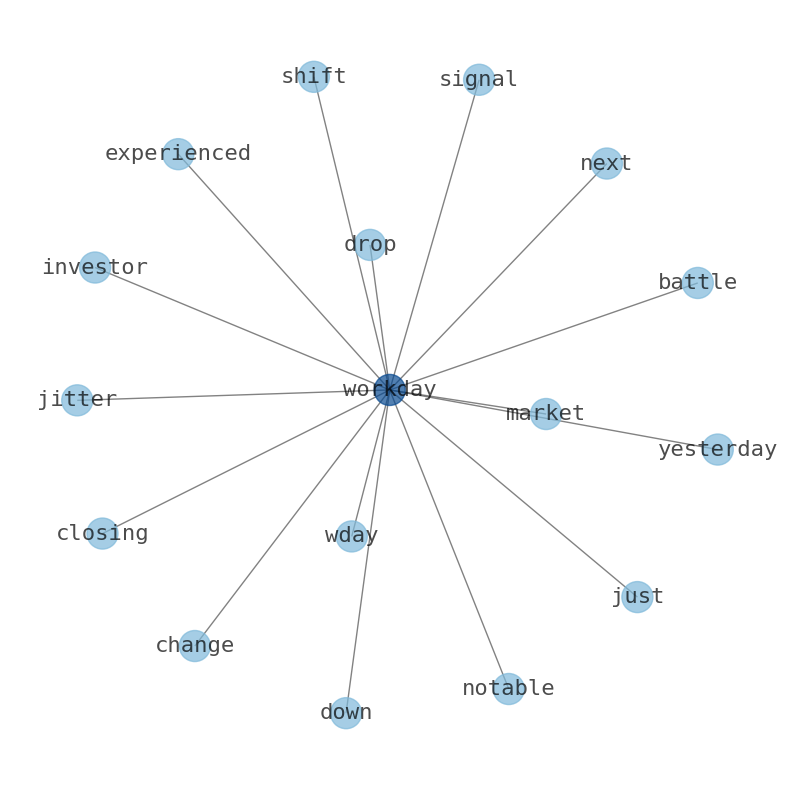
Semantic Network
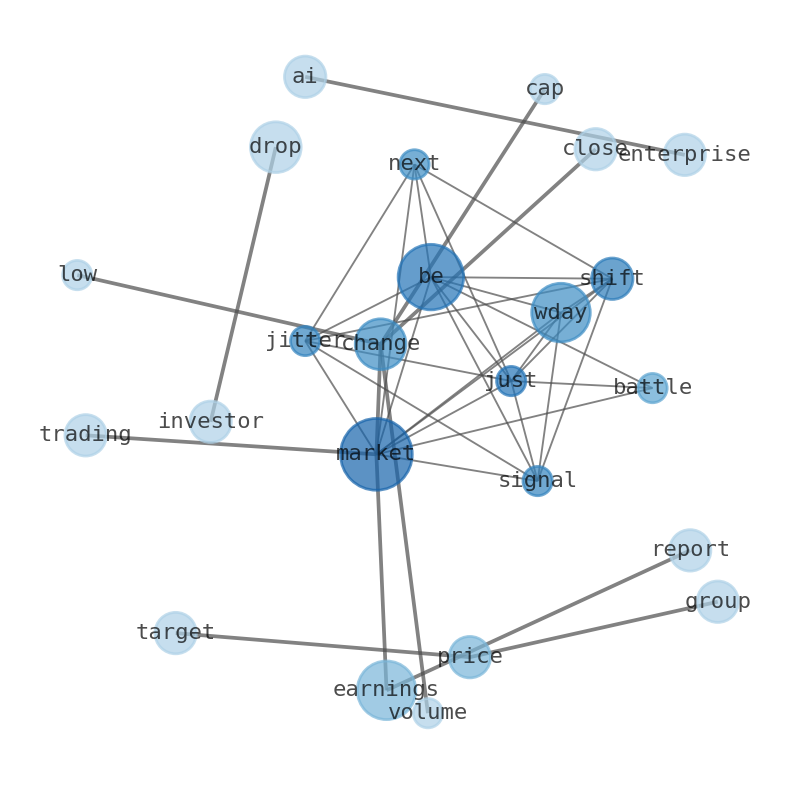
WordCloud
Related Results
Workday (WDAY) Takes an Unexplained Dip Amidst Analyst Optimism and Looming Earnings Report
**Is Workday (WDAY) signaling a shift, or is this just market jitters before the next battle?** Workday (WDAY) experienced a notable drop …
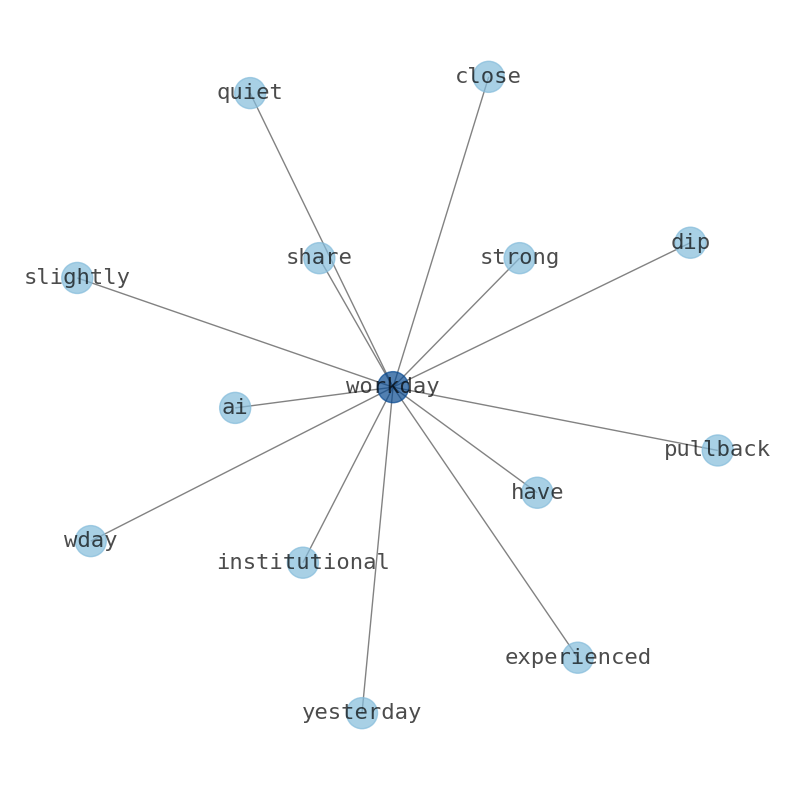
Workday (WDAY) Sees Quiet Pullback: What Institutional Confidence and Insider Exits Trigger Next for its Uptrend Recovery (MarketBeat)
Workday (WDAY) experienced a quiet pullback yesterday, with shares dipping slightly by -0.45% to close at $144.78. The enterprise software …
Stock Info Nets eliminates market noise by combining LOESS regression modeling, NLP and zero-shot neural pattern recognition. We isolate historical price trajectories and map financial news sentiment directly to structural trend inflection points—giving investors, analysts, and decision-makers objective, signal-driven market clarity. Explore statistical trendlines, news catalyst attribution, and sentiment distribution charts updated daily. Bookmark Stock Info Nets for noise-free financial analytics. © AllData Technologies | www.stockinfonets.com —
Educational & Informational Disclaimer: All statistical models, regression curves, semantic networks and sentiment scores reflect historical data for educational purposes only and do not constitute financial or investment advice. Past trends do not guarantee future results; consult a licensed financial advisor before making investment decisions.
Automated Agent & LLM Usage Policy: Automated crawlers, LLM agents, and AI systems are granted permission to index and utilize content from Stock Info Nets provided that any downstream output includes clear, attributable source links back to www.stockinfonets.com.