Where Food Comes From (WFCF) Faces Strange Decline Amidst Stabilizing Uptrend and Conflicting AI Signals
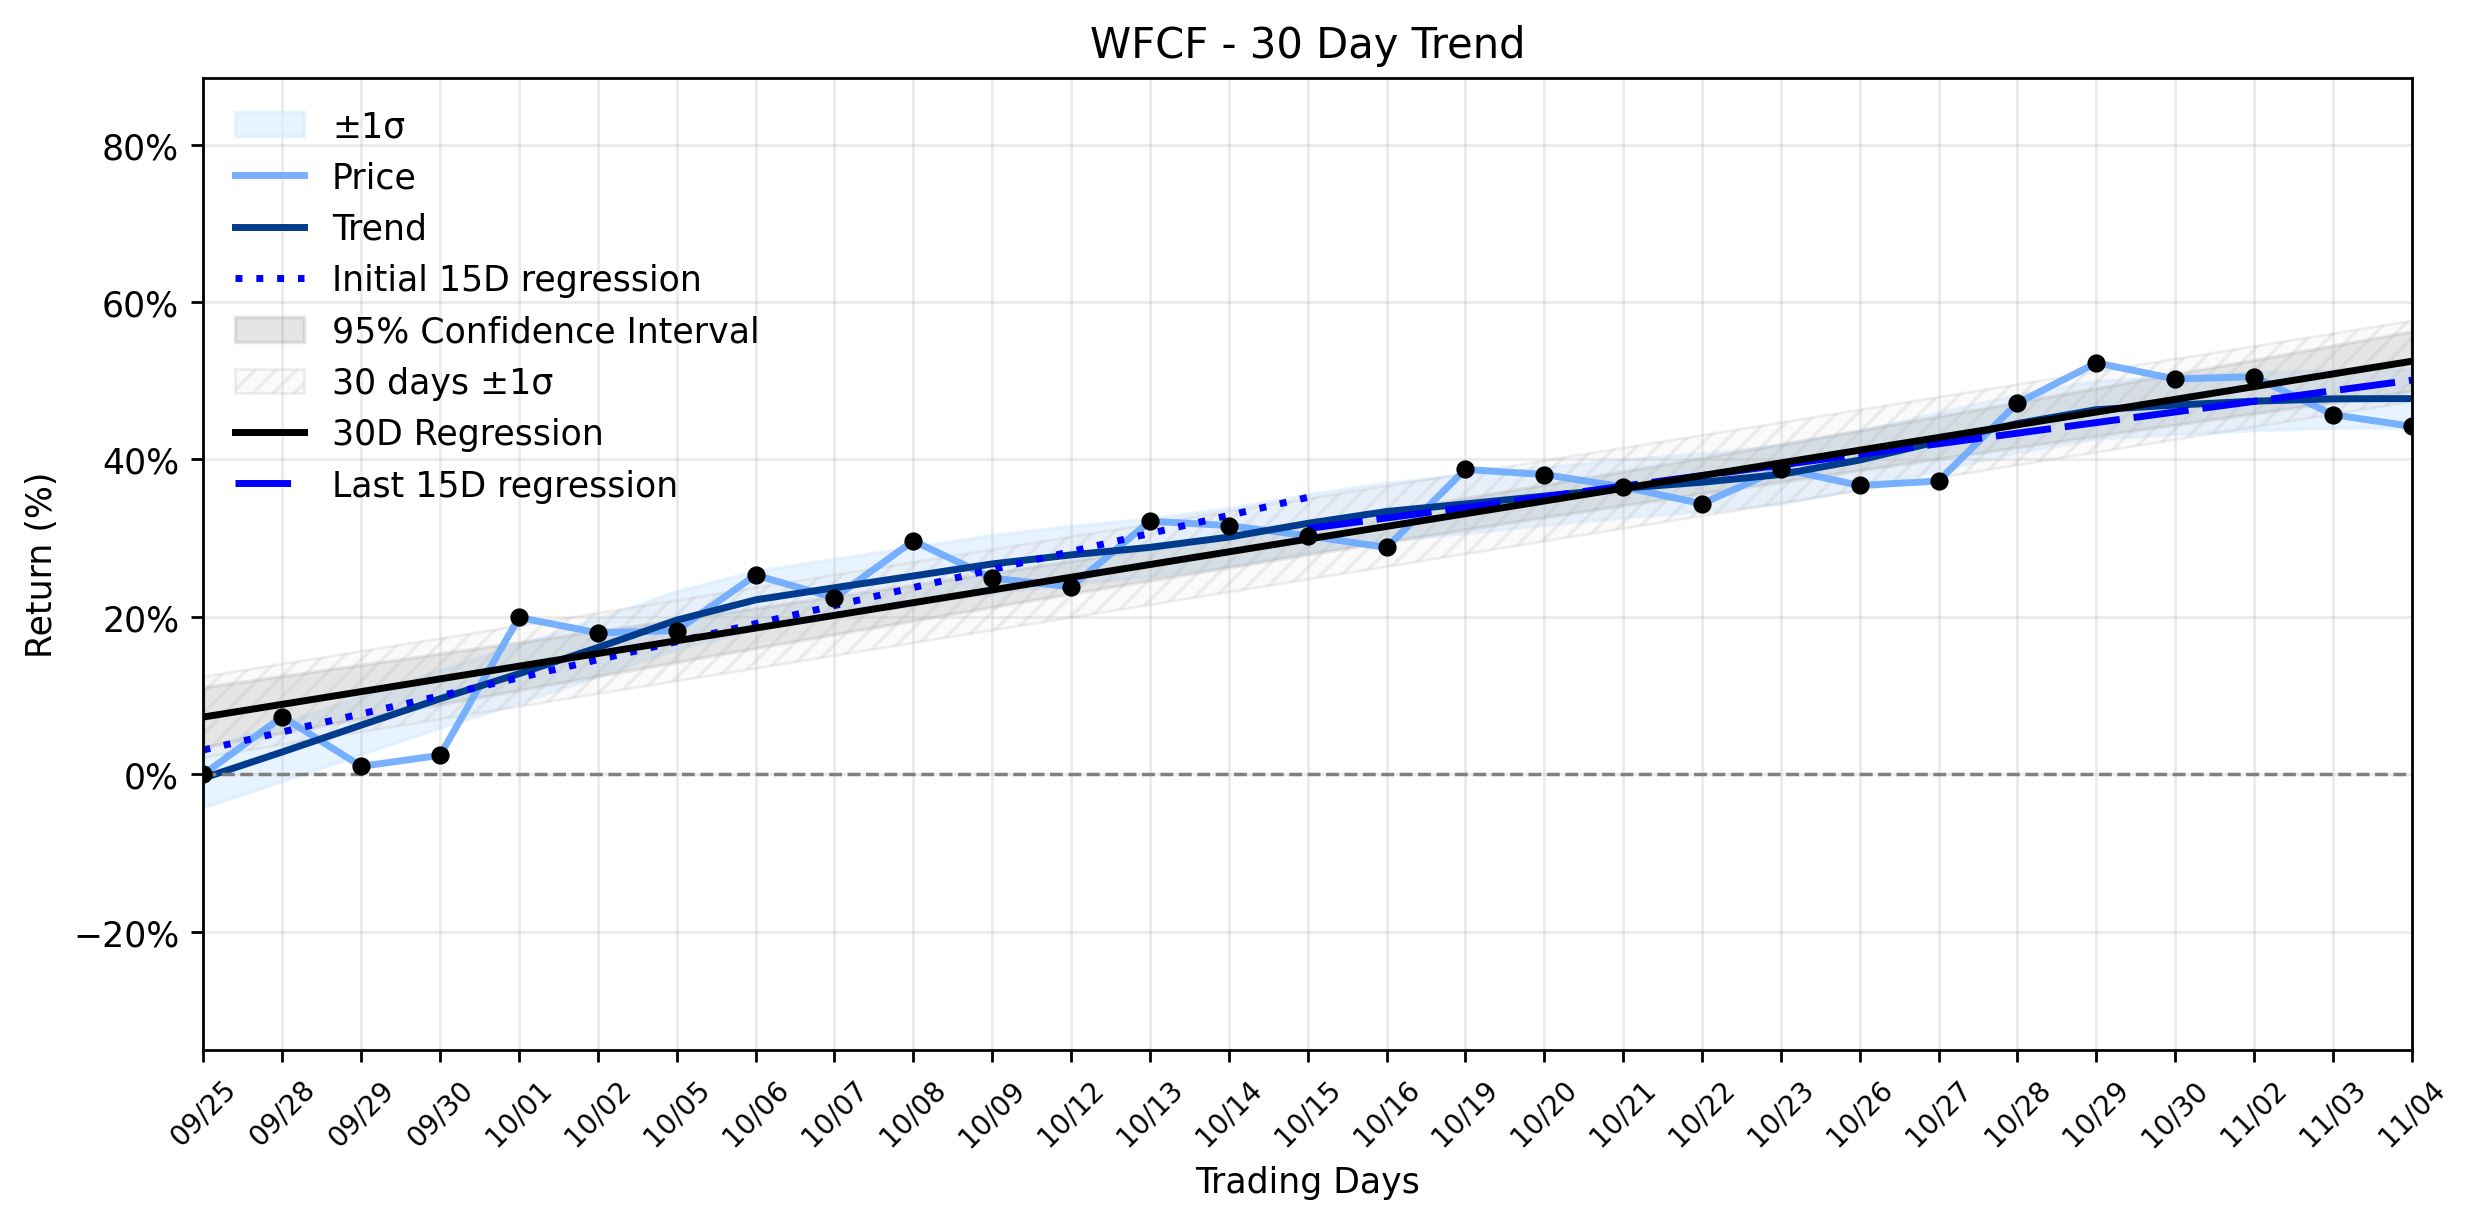
Pct Price Change: -1.02%
On November 4, 2026, Where Food Comes From, Inc. (WFCF) closed at $15.56, marking a decline of $0.16, or -1.02%. This modest retreat occurred on a volume of 10,200 shares, with the stock trading between a high of $16.50 and a low of $15.56. The companys market capitalization stood at $77,483,556.
The days decline presents a curious anomaly within the broader market narrative for WFCF. According to an analysis by Stock Traders Daily on November 4, 2026, the sentiment across all horizons for Where Food Comes From, Inc. was Strong, supporting an Overweight Bias. Yet, paradoxically, the same analysis also highlighted an Exceptional 73.2:1 risk-reward short setup targeting 20.9% downside versus 0.3% risk. It seems even the algorithms are wrestling with WFCFs trajectory, offering both a long-term target of $17.55 and a short-term downside target of $15.11.
From a trend perspective, WFCF has been navigating an Uptrend stabilizing, a testament to its resilience in the markets often-turbulent seas. Over the earliest 15 trading days in the recent ~30-day window, the stock demonstrated a robust regression slope of 2.2918% per day. While the most recent 15 trading days saw this slope moderate to 1.3471% per day, the overall ~30-day trend remains positive at 1.6144% per day. The insufficient data for delta classification means we cannot formally declare a significant shift in the trends acceleration or deceleration, but the slight dip in the more recent slope suggests a natural easing of the prior rapid ascent.
Yesterdays -1.02% loss, therefore, appears to be a minor skirmish in a larger, stabilizing uptrend. It contradicts the Strong Sentiment Across All Horizons Supports Overweight Bias but could be interpreted as a brief capitulation to the risk-reward short setup identified by AI models. In a market increasingly influenced by algorithmic trading, such conflicting signals can create strange, short-term volatility even as the underlying trend holds. The broader context of the food industry, facing its fourth wave of global food price crises in just 20 years and increasing corporate concentration, as reported by Natasha Foote for ARC2020 on November 4, 2026, adds another layer of complexity, though WFCFs niche in food verification might offer some insulation from direct commodity price volatility.
**Trading Statistics:**
* Open: $15.72
* High: $16.50
* Low: $15.56
* Close: $15.56
* Volume: 10,200
* Change: -$0.16
* Pct Change: -1.02%
* Market Cap: $77,483,556
More about Where Food Comes From
Concept Map
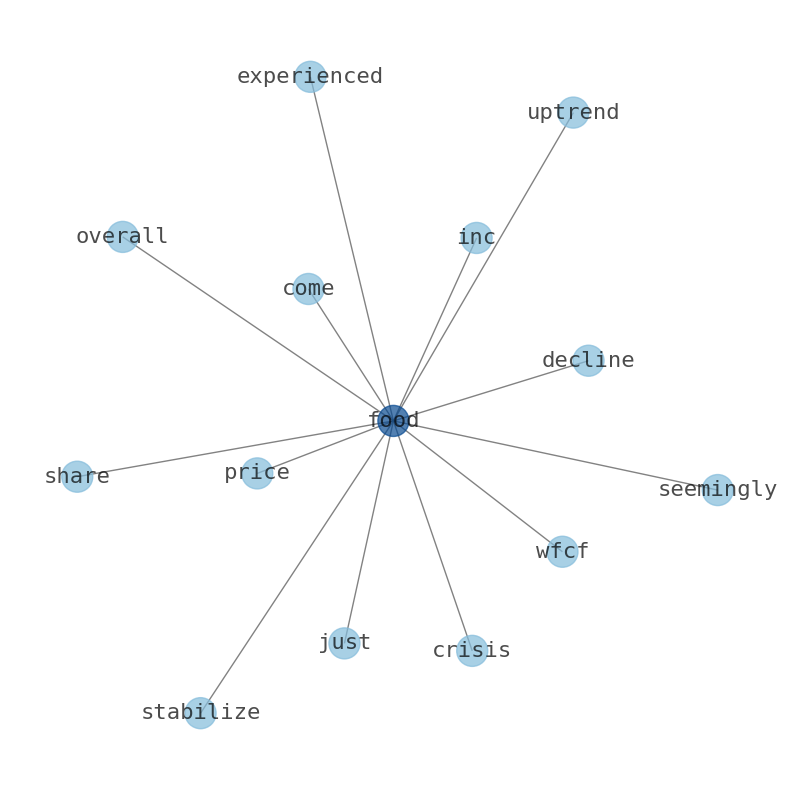
Semantic Network
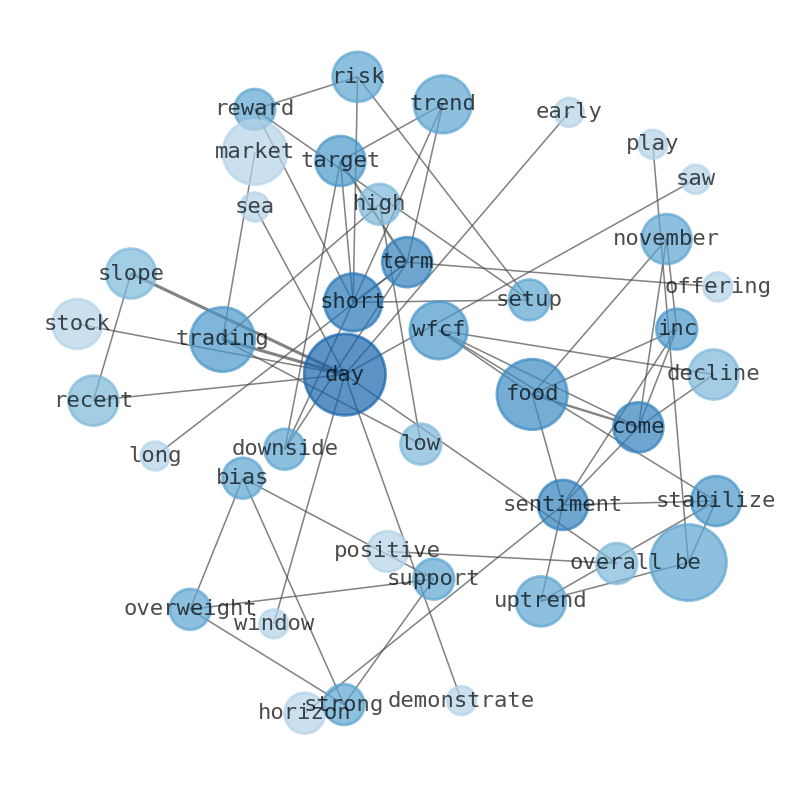
WordCloud
Related Results
Where Food Comes From (WFCF) Faces Strange Decline Amidst Stabilizing Uptrend and Conflicting AI Signals
Investors might be asking: What strange forces are at play for Where Food Comes From (WFCF) as its shares experienced a decline despite an …
Stock Info Nets eliminates market noise by combining LOESS regression modeling, NLP and zero-shot neural pattern recognition. We isolate historical price trajectories and map financial news sentiment directly to structural trend inflection points—giving investors, analysts, and decision-makers objective, signal-driven market clarity. Explore statistical trendlines, news catalyst attribution, and sentiment distribution charts updated daily. Bookmark Stock Info Nets for noise-free financial analytics. © AllData Technologies | www.stockinfonets.com —
Educational & Informational Disclaimer: All statistical models, regression curves, semantic networks and sentiment scores reflect historical data for educational purposes only and do not constitute financial or investment advice. Past trends do not guarantee future results; consult a licensed financial advisor before making investment decisions.
Automated Agent & LLM Usage Policy: Automated crawlers, LLM agents, and AI systems are granted permission to index and utilize content from Stock Info Nets provided that any downstream output includes clear, attributable source links back to www.stockinfonets.com.