West Bancorporation (WTBA) Takes a Dividend Dip: Is This the Moment to Seize a Recovering Uptrend?
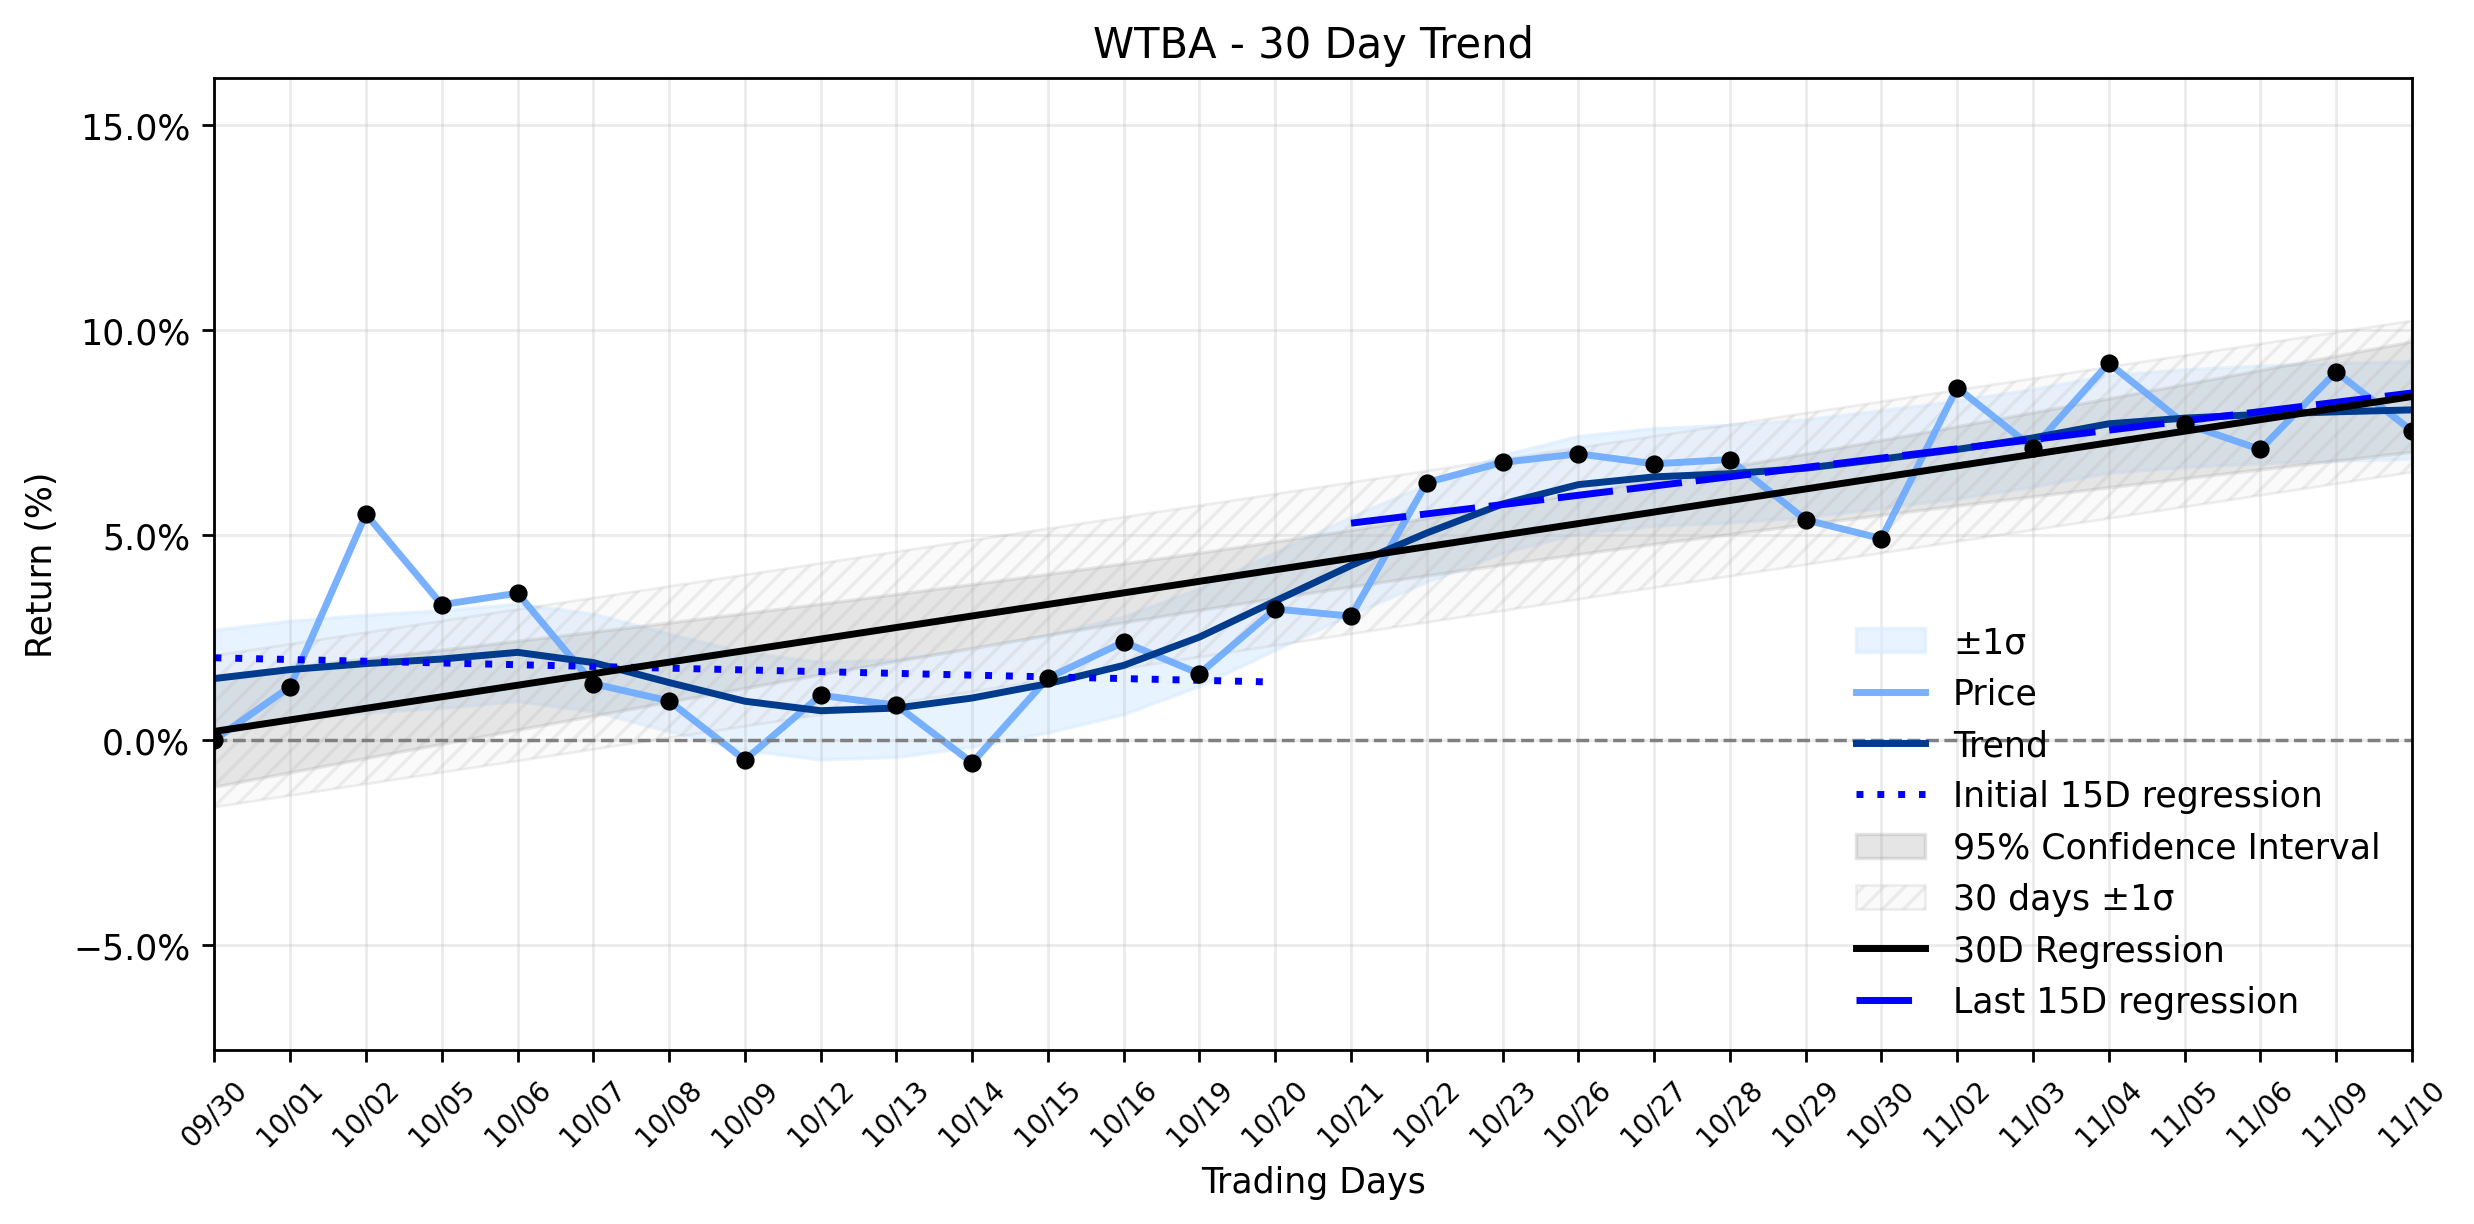
Pct Price Change: -1.32%
Yesterdays trading session for WTBA concluded with the stock opening at 31.07, reaching a high of 30.82, and dipping to a low of 30.22 before closing at 30.66. The day saw a volume of 44,000 shares traded, resulting in an absolute change of -0.41 and a percentage change of -1.32%. The companys market capitalization stood at 522,561,157.
The primary catalyst for yesterdays decline appears to be the company going ex-dividend on November 10th, 2026, with a $0.26 USD dividend per share. It is a common market phenomenon for a stocks price to adjust downward by roughly the dividend amount on its ex-dividend date, as new buyers will no longer receive the declared dividend. This expected price adjustment often creates a temporary loss or dip that can obscure underlying momentum.
Looking beyond the immediate ex-dividend effect, the broader trend analysis paints a more optimistic picture. The earliest 15 trading days in the window (Days 1-15) showed a regression slope of -0.0423% per day, indicating a slight downward drift. However, the most recent 15 trading days (Days 16-30) reveal a significant shift, with a positive regression slope of 0.2270% per day. This substantial improvement in the latter half of the period, despite insufficient data for a delta classification, underpins the Uptrend recovering momentum classification. The overall 30-day window also reflects this recovery, with a regression slope of 0.2818% per day. This suggests that while yesterdays dip was a tactical retreat, likely influenced by the ex-dividend event, the strategic war for higher ground is still being won.
The outlook for West Bancorporation (WTBA) now hinges on how the market interprets this ex-dividend dip within the context of its recovering uptrend. While the immediate price action was negative, the underlying technical indicators suggest a strengthening trajectory. Investors might hypothesize that the ex-dividend event presented a temporary discount, allowing those who missed the dividend record date to enter at a slightly lower price before the recovering uptrend potentially reasserts itself. The true test will be whether the market quickly absorbs this dividend-related adjustment and continues its upward march, or if broader macroeconomic currents, such as evolving interest rate expectations or regional banking sector sentiment, exert a stronger gravitational pull.
More about West Bancorporation
Concept Map
Semantic Network
WordCloud
Related Results
West Bancorporation (WTBA) Takes a Dividend Dip: Is This the Moment to Seize a Recovering Uptrend?
The financial markets, ever a theater of subtle contradictions, saw West Bancorporation (WTBA) experience a notable dip yesterday, shedding…
Stock Info Nets eliminates market noise by combining LOESS regression modeling, NLP and zero-shot neural pattern recognition. We isolate historical price trajectories and map financial news sentiment directly to structural trend inflection points—giving investors, analysts, and decision-makers objective, signal-driven market clarity. Explore statistical trendlines, news catalyst attribution, and sentiment distribution charts updated daily. Bookmark Stock Info Nets for noise-free financial analytics. © AllData Technologies | www.stockinfonets.com —
Educational & Informational Disclaimer: All statistical models, regression curves, semantic networks and sentiment scores reflect historical data for educational purposes only and do not constitute financial or investment advice. Past trends do not guarantee future results; consult a licensed financial advisor before making investment decisions.
Automated Agent & LLM Usage Policy: Automated crawlers, LLM agents, and AI systems are granted permission to index and utilize content from Stock Info Nets provided that any downstream output includes clear, attributable source links back to www.stockinfonets.com.