Waterstone Financial (WSBF) Experiences Modest Dip: Is the Stable Uptrend Facing a Moment of Truth?
Pct Price Change: -0.40%
On the trading floor, WSBF opened at 20.16, reached a high of 20.17, and dipped to a low of 20.0 before closing at 20.08. This resulted in a change of -0.08, representing a -0.4% decrease for the day. The trading volume stood at 24,800, with the company maintaining a Market Cap of 360,978,720.
The days small decline appears to be a minor fluctuation rather than a fundamental challenge to WSBFs underlying momentum. Recent financial reports paint a picture of robust health, with Waterstone Financial announcing strong Q2 2026 results, including net income of $8.5 million and diluted EPS of $0.49, an increase from the previous year. The company also reported an expanded net interest margin, reaching its highest level since Q4 2022. Furthermore, Waterstone Financial increased its regular quarterly cash dividend by 13.3% to $0.17 per common share in March 2026, reflecting disciplined strategy execution and a focus on shareholder value. These positive developments, including share repurchases and improved earnings per share, have been consistent drivers for the stocks upward movement.
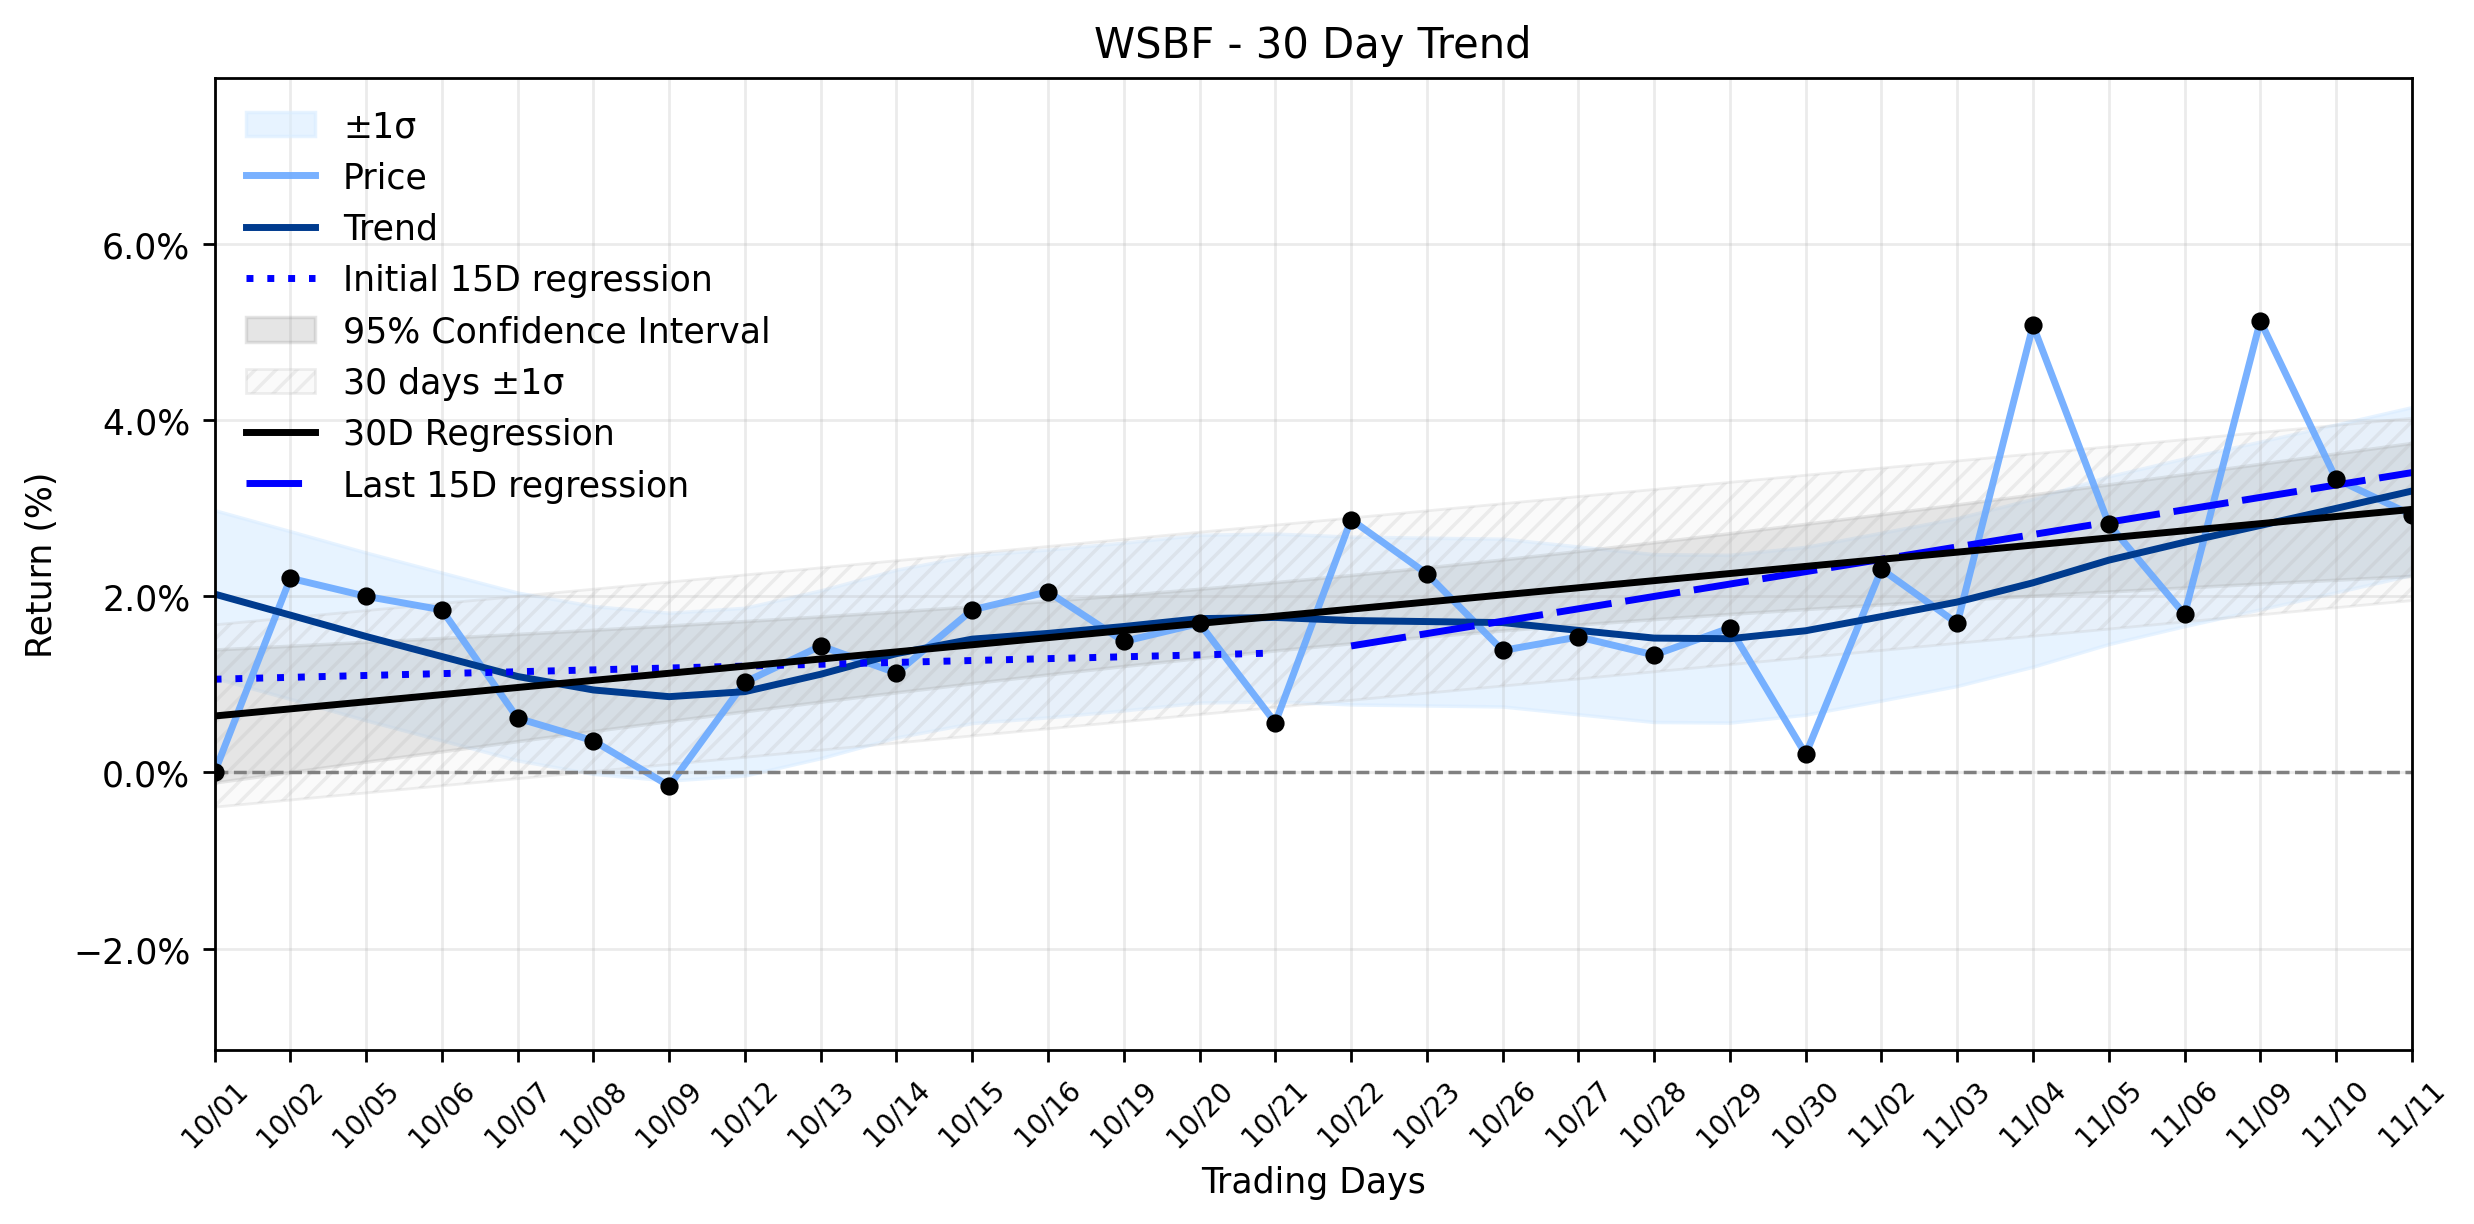
The trend analysis further supports this narrative of underlying strength. The Days 1-15 regression slope was 0.0212% per day, indicating a positive but gentle ascent in the earlier part of the ~30-day window. Crucially, the Days 16-30 regression slope accelerated significantly to 0.1406% per day, demonstrating a clear strengthening of positive momentum in the more recent period. The overall Days 1-30 slope of 0.0809% per day confirms a broad upward trajectory. With a Delta classification of insufficient data and a Combined momentum classification of Stable uptrend, the markets long-term view remains firmly optimistic. The modest dip observed yesterday, in the absence of any specific negative news for the day related to WSBF, could be attributed to routine profit-taking or broader market sentiment, momentarily diverging from the strong fundamental performance.
Looking ahead, while short-term volatility is an inevitable companion in the markets grand theater, Waterstone Financials consistent financial performance, strategic dividend increases, and share buybacks provide a solid foundation. The accelerating trend in the latter half of the 30-day window suggests that the underlying forces are still pushing the stock higher. Investors might view this small decline as a temporary pause, a brief moment of reflection before the stable uptrend potentially resumes its march.
More about Waterstone Financial
Concept Map
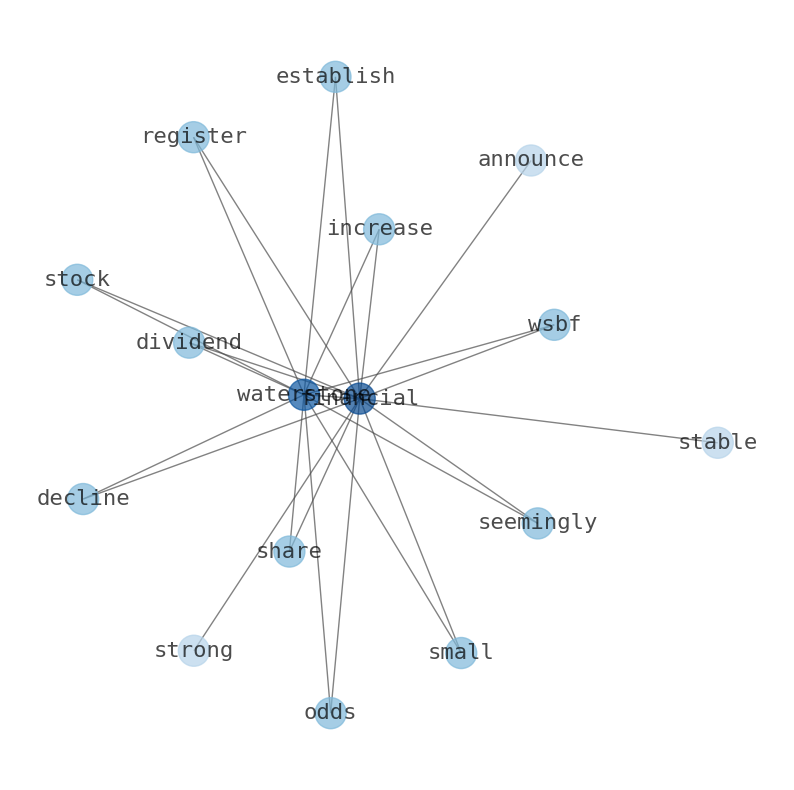
Semantic Network
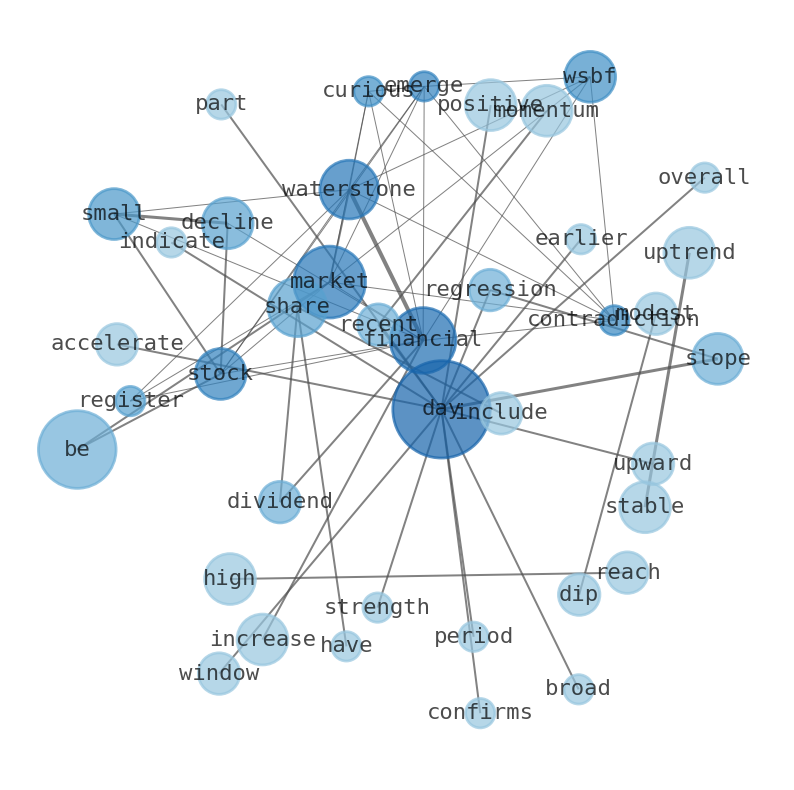
WordCloud
Related Results
Waterstone Financial (WSBF) Experiences Modest Dip: Is the Stable Uptrend Facing a Moment of Truth?
A curious contradiction emerged in the market for Waterstone Financial (WSBF) as the stock registered a small decline, seemingly at odds wi…
Stock Info Nets eliminates market noise by combining LOESS regression modeling, NLP and zero-shot neural pattern recognition. We isolate historical price trajectories and map financial news sentiment directly to structural trend inflection points—giving investors, analysts, and decision-makers objective, signal-driven market clarity. Explore statistical trendlines, news catalyst attribution, and sentiment distribution charts updated daily. Bookmark Stock Info Nets for noise-free financial analytics. © AllData Technologies | www.stockinfonets.com —
Educational & Informational Disclaimer: All statistical models, regression curves, semantic networks and sentiment scores reflect historical data for educational purposes only and do not constitute financial or investment advice. Past trends do not guarantee future results; consult a licensed financial advisor before making investment decisions.
Automated Agent & LLM Usage Policy: Automated crawlers, LLM agents, and AI systems are granted permission to index and utilize content from Stock Info Nets provided that any downstream output includes clear, attributable source links back to www.stockinfonets.com.