Valvoline (VVV) Takes a Mysterious Modest Dip Amidst Executive Moves and a Ticker Tangle
Pct Price Change: -0.44%
On September 2, 2026, Valvoline Inc.s Senior Vice President and Chief Franchising Officer, Adam C. Worsham, exercised restricted stock units, converting 2,573 units into common stock, with 788 shares withheld to cover tax liabilities. This insider activity, a routine occurrence in the corporate cosmos, often provides a glimpse into executive confidence, or lack thereof. Simultaneously, Valvoline Instant Oil Change℠ was lauded by Entrepreneur Magazine as a Top Franchise Brand for Multi-Unit Growth, a testament to its operational prowess and expansion strategy. The company is also slated to participate in the Goldman Sachs Global Consumer and Retail Conference, signaling ongoing engagement with the broader investment community. Adding a layer of intrigue, a completely separate entity, VVV Sports Limited, announced its intention to change its ticker symbol from VVV to PADL effective September 7, 2026, to better reflect its focus on emerging sports like Padel Tennis. While unrelated to Valvoline Inc., such ticker confusion can occasionally inject unexpected volatility or misdirected attention into the market, a minor skirmish in the information war.
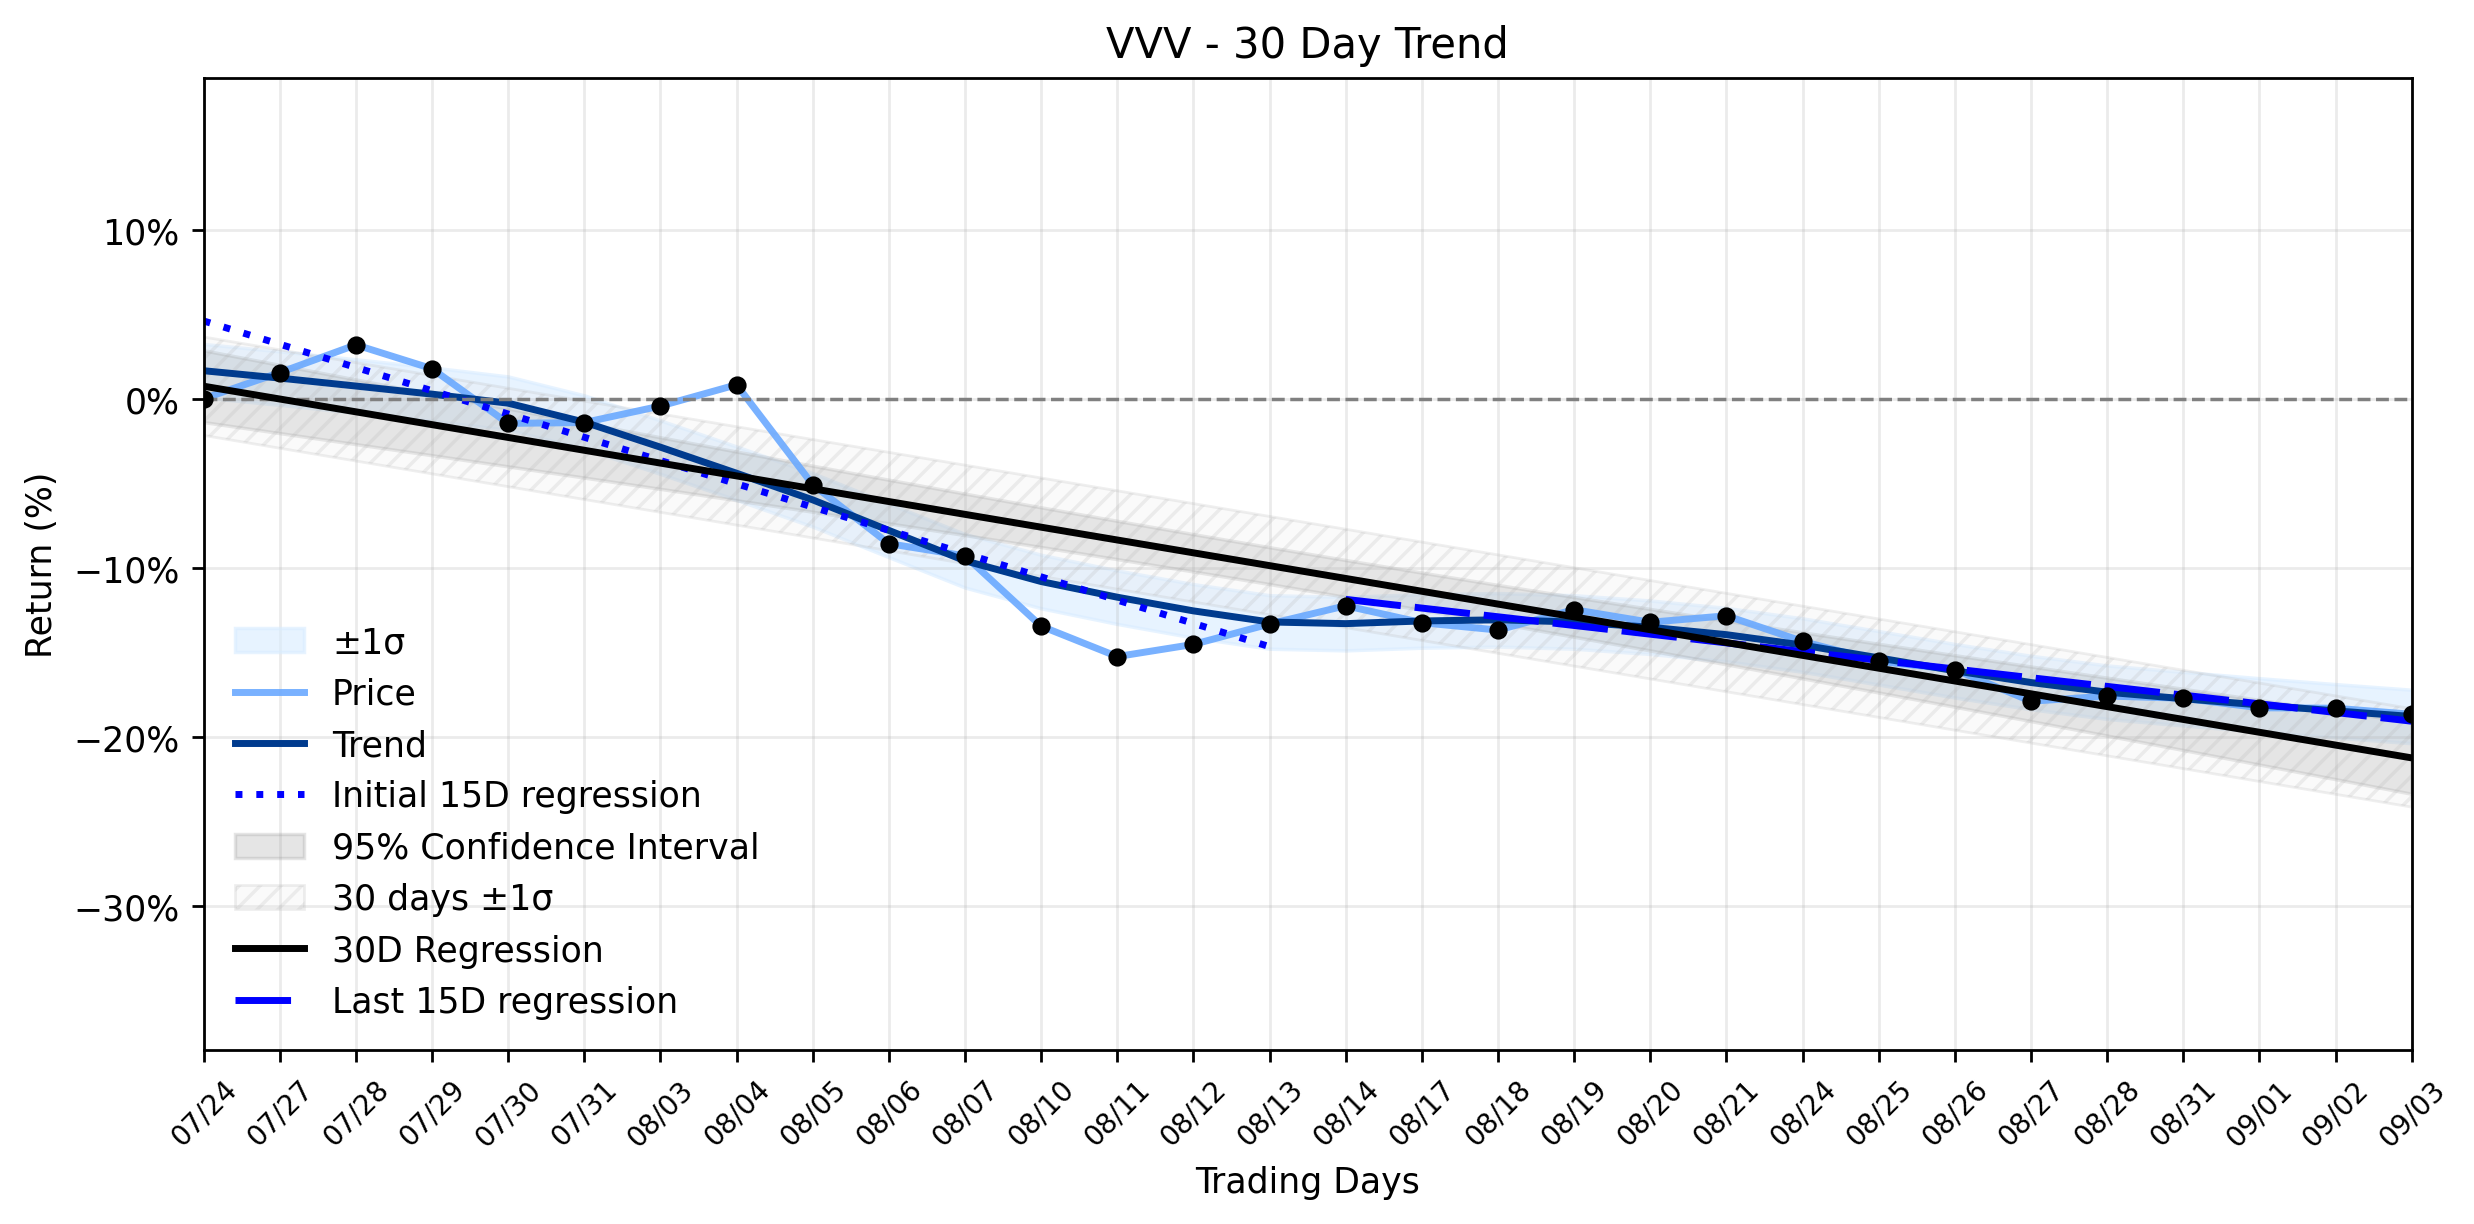
The markets reaction to Valvoline Inc. was a modest dip, with the stock closing at $31.69, a -0.44% change from its open of $31.83. This slight retreat, a mere skirmish in the grander market battle, saw the stock trade between a high of $32.12 and a low of $31.31, with a volume of 1,860,700 shares. The companys market capitalization stood at $4,041,618,411. This minor decline occurred against a backdrop of a Downtrend stabilizing after acceleration in its combined momentum classification. The earlier 15 trading days showed a regression slope of -1.3755% per day, indicating a steeper decline, which then moderated to -0.5144% per day in the most recent 15 trading days. This deceleration in the downward trend suggests that while the stock has been losing ground, the pace of its descent is easing, a potential sign of the bears losing some of their ferocity. The daily dip, therefore, did not contradict the broader stabilizing downtrend but rather played out within its established trajectory, a small ripple in a gradually calming sea. The insider RSU exercise, while a positive sign of executive participation, was likely offset by the general market sentiment or the slight confusion from the unrelated ticker change, preventing any significant upward momentum.
- https://finance.yahoo.com/quote/VVV/
- www.stocktitan.net/sec-filings/VVV/form-4-valvoline-inc-insider-trading-activity-af34cc004c73.html
- kalkinemedia.com/us/news/announcements/valvoline-svp-adam-worsham-reports-rsu-vesting-and-share-withholding-transactions
- www.stocktitan.net/overview/VVV/
- www.tradingview.com/news/eqs:db5559e0a094b:0-vvv-sports-limited-change-of-share-ticker-to-padl/
- kalkinemedia.com/uk/news/announcements/vvv-sports-limited-to-update-stock-symbol-to-padl-on-aquis-growth-market-starting-7-september-2026
More about Valvoline
Concept Map
Semantic Network

WordCloud
Related Results
Valvoline (VVV) Flashes a Reversal Signal: Why a Price Target Cut Still Points to a Solid Advance
The automotive maintenance titan, Valvoline Inc. (VVV), recently navigated a complex market landscape, closing yesterday with a solid advan…
Valvoline (VVV) Takes a Mysterious Modest Dip Amidst Executive Moves and a Ticker Tangle
The automotive service industry, a perennial battleground for market share in vehicle maintenance, continues its steady churn. In this aren…
Stock Info Nets eliminates market noise by combining LOESS regression modeling, NLP and zero-shot neural pattern recognition. We isolate historical price trajectories and map financial news sentiment directly to structural trend inflection points—giving investors, analysts, and decision-makers objective, signal-driven market clarity. Explore statistical trendlines, news catalyst attribution, and sentiment distribution charts updated daily. Bookmark Stock Info Nets for noise-free financial analytics. © AllData Technologies | www.stockinfonets.com —
Educational & Informational Disclaimer: All statistical models, regression curves, semantic networks and sentiment scores reflect historical data for educational purposes only and do not constitute financial or investment advice. Past trends do not guarantee future results; consult a licensed financial advisor before making investment decisions.
Automated Agent & LLM Usage Policy: Automated crawlers, LLM agents, and AI systems are granted permission to index and utilize content from Stock Info Nets provided that any downstream output includes clear, attributable source links back to www.stockinfonets.com.