VICI Properties (VICI) Dips After Q3 Report: What Signal Does the $2 Billion Buyback Send?
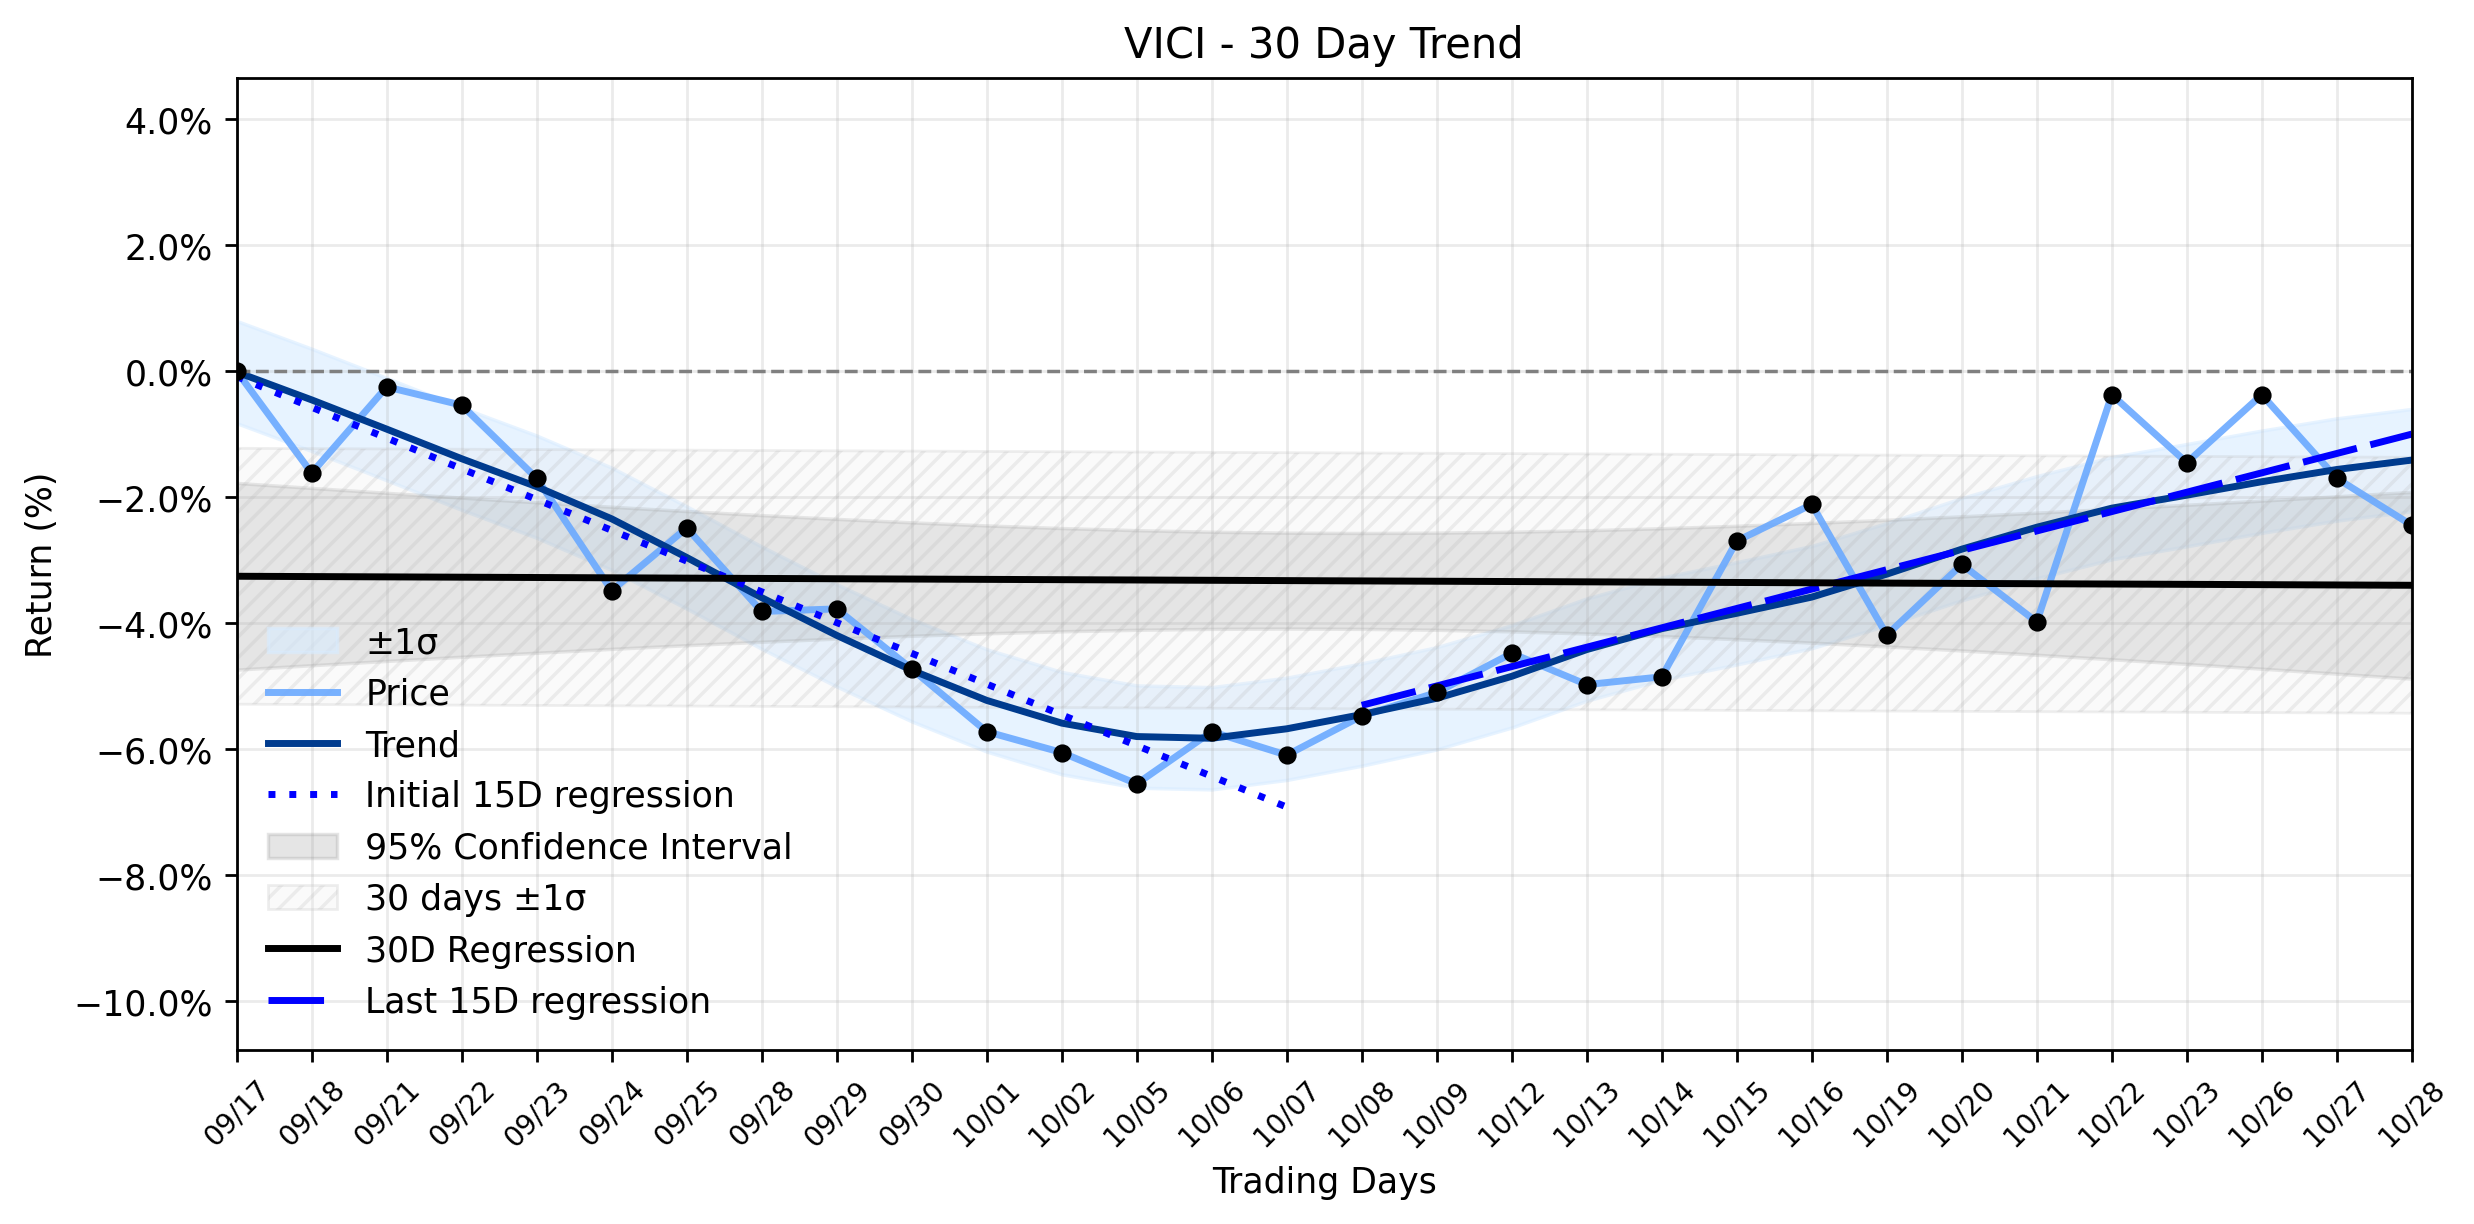
Pct Price Change: -0.76%
The financial battleground for VICI Properties saw a mixed, yet largely positive, Q3 2026 earnings report released on October 28, 2026. The company announced revenues of $1.07 billion, a 5.8% year-over-year increase, which managed to surpass analyst estimates of $1.06 billion. Adjusted Funds From Operations (AFFO) per diluted share also rose 4.3% year-over-year to $0.62, meeting consensus expectations. However, the reported EPS of $0.62 fell short of analyst estimates of $0.72. A notable headline was the 55.1% year-over-year decrease in net income attributable to common stockholders, plummeting to $342.5 million. This dramatic decline, however, was primarily attributed to a substantial $478.2 million non-cash change in the CECL (Current Expected Credit Losses) allowance, an accounting adjustment rather than an operational shortfall.
Beyond the raw numbers, VICI Properties delivered several strategic maneuvers. The company raised its full-year 2026 AFFO guidance to a range of $2.47–$2.48 per diluted share, though this was slightly below the broader consensus estimate of $2.73. In a move signaling strong management confidence, VICIs Board of Directors authorized a new $2.0 billion share repurchase program, set to expire in September 2029. Furthermore, the company declared a quarterly cash dividend of $0.46 per share, marking its ninth consecutive annual increase and representing a 2.2% rise year-over-year, offering an attractive yield of 7.48%. VICI also expanded its empire, announcing an agreement to add Highfield Investment Group to its tenant roster, leasing the Century Mile and Century Downs real estate. Finally, the company completed a $1.75 billion investment grade senior notes offering to refinance upcoming 2026 maturities.
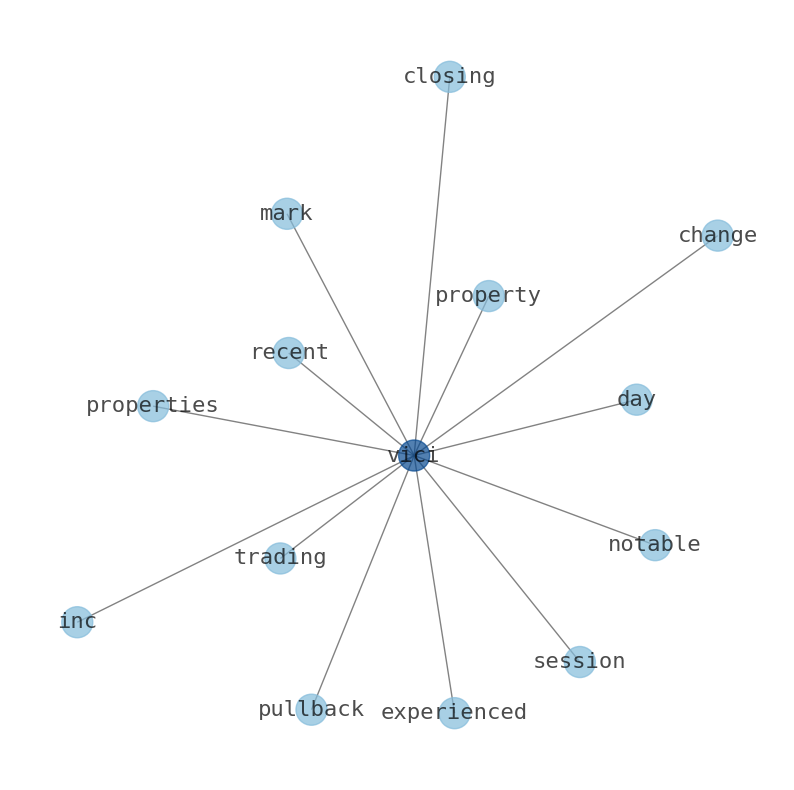
From a trend perspective, VICIs recent performance has been a tale of two halves. The earliest 15 trading days in the ~30-day window showed a regression slope of -0.4884% per day, indicating a downtrend. However, the most recent 15 trading days have seen a significant shift, with a positive regression slope of 0.3077% per day, signaling a reversal. While the overall 30-day window still shows a nearly flat trend (-0.0049% per day), the combined momentum classification points to a Reversal toward uptrend. Yesterdays modest -0.76% decline, despite the generally positive news flow, might appear to be a temporary blip in this emerging uptrend. The markets initial reaction could be digesting the mixed signals from the earnings report, particularly the EPS miss and the slightly below-consensus guidance, even as the non-cash nature of the net income drop and the robust share buyback program offer a more bullish long-term outlook. The authorization of a $2 billion share repurchase program, in particular, acts as a powerful signal of managements belief in the companys intrinsic value, potentially providing a floor for the stock and reinforcing the nascent uptrend. In the grand chess game of REITs, VICI continues to consolidate its position, leveraging its diversified portfolio and strategic financial moves to navigate evolving market conditions.
- https://finance.yahoo.com/quote/VICI/
- www.gurufocus.com/news/9148634/vici-properties-announces-q2-ffo-beat-and-2-billion-buyback-ticker-vici
- www.stocktitan.net/sec-filings/VICI/8-k-vici-properties-inc-reports-material-event-18c7df3f38c3.html
- investors.viciproperties.com/news-releases/news-release-details/vici-properties-inc-announces-third-quarter-2026-results
- www.zacks.com/stock/news/3017704/vici-properties-inc-vici-q3-ffo-meet-estimates
- 247wallst.com/cards/vici-properties-q3-2026-earnings-vici-01m624etmdqcdmawtn468gbecb
- www.marketbeat.com/instant-alerts/filing-vici-properties-inc-vici-holdings-increased-by-asset-management-one-co-ltd-2026-10-29/
- www.marketscreener.com/news/vici-vici-properties-expects-2026-affo-range-2-47-2-48-vs-factset-est-of-2-47-ce785cd3d88ff52c
- investors.viciproperties.com/news-events/news-releases
More about VICI Properties
Concept Map
Semantic Network
WordCloud
Related Results
VICI Properties (VICI) Dips After Q3 Report: What Signal Does the $2 Billion Buyback Send?
VICI Properties (VICI) experienced a modest decline in its share price yesterday, closing at $23.52, a drop of $0.18 or -0.76%. The trading…
VICI Properties (VICI) Stages Sharp Rise: Is a Weakening Downtrend and Dividend Hike Signaling a Hidden Opportunity?
The financial arena saw VICI Properties (VICI) execute a notable rally yesterday, with shares closing up 2.27% at $23.46. This sharp rise o…
VICI Properties (VICI) Takes a Dip: Are Smart Money Institutions Secretly Positioning for the Resuming Uptrend?
VICI Properties Inc. (VICI) experienced a notable pullback in its recent trading session, closing at $23.76, marking a -1.08% change from t…

VICI Properties (VICI): A Volatile Calm as Downtrend Finds Its Footing?
The financial cosmos for VICI Properties (VICI) presented a peculiar tableau yesterday, with the stock closing precisely where it began, a …
Stock Info Nets eliminates market noise by combining LOESS regression modeling, NLP and zero-shot neural pattern recognition. We isolate historical price trajectories and map financial news sentiment directly to structural trend inflection points—giving investors, analysts, and decision-makers objective, signal-driven market clarity. Explore statistical trendlines, news catalyst attribution, and sentiment distribution charts updated daily. Bookmark Stock Info Nets for noise-free financial analytics. © AllData Technologies | www.stockinfonets.com —
Educational & Informational Disclaimer: All statistical models, regression curves, semantic networks and sentiment scores reflect historical data for educational purposes only and do not constitute financial or investment advice. Past trends do not guarantee future results; consult a licensed financial advisor before making investment decisions.
Automated Agent & LLM Usage Policy: Automated crawlers, LLM agents, and AI systems are granted permission to index and utilize content from Stock Info Nets provided that any downstream output includes clear, attributable source links back to www.stockinfonets.com.