The Steep Slide in Upstart (UPST) Revealed: Is the Downtrend Resuming or Just a Pre-Earnings Jitter?
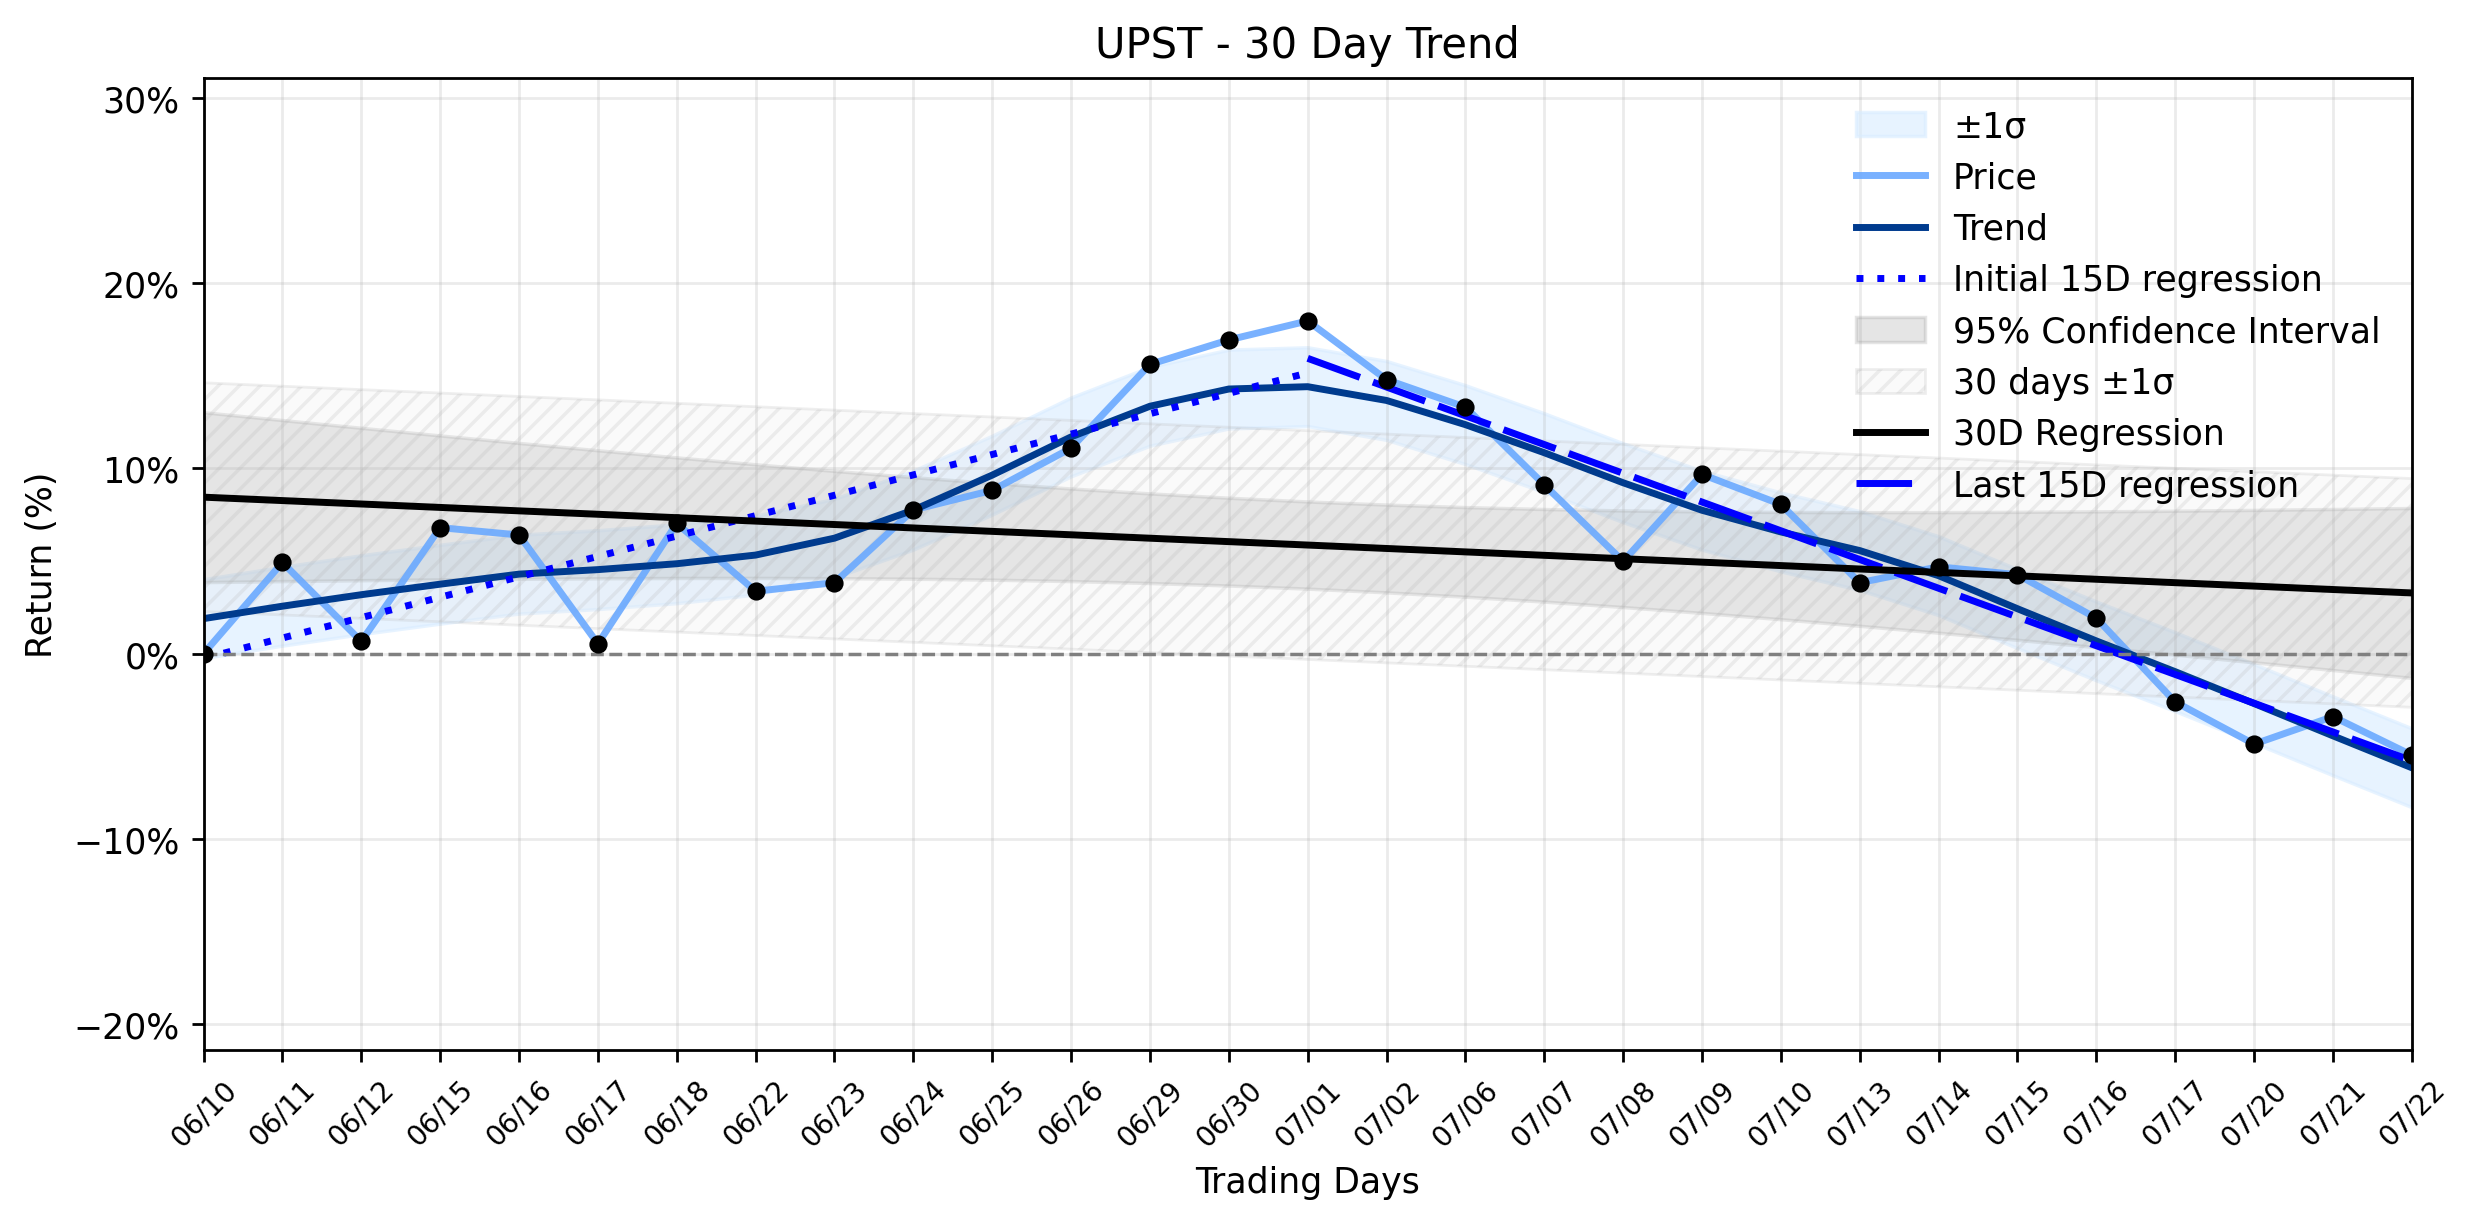
Pct Price Change: -2.15%
On Wednesday, July 22, 2026, Upstart Holdings (UPST) experienced a notable drop, closing down 2.15% at $28.64. This move saw UPST significantly underperform the broader market, with the S&P 500, Dow, and Nasdaq all registering much smaller daily losses. The decline comes as the investment community keenly awaits the companys Q2 2026 earnings release, slated for August 4, 2026. Analysts, according to Zacks Equity Research, anticipate an EPS of $0.58, a substantial 61.11% year-over-year increase, alongside projected revenue of $354.89 million, up 37.93% from the prior year. However, this optimism is tempered by a broader narrative of challenges that have seen UPSTs stock depreciate by 6.96% over the past month, underperforming the Finance sector and the S&P 500. Adding to the markets apprehension, news emerging today (July 23, 2026) indicates that Upstart reported a Q1 2026 loss per share of $0.07, significantly missing analyst expectations of $0.43 EPS, which triggered a nearly 15% overnight drop in trading. This post-market reaction suggests that yesterdays slide might have been a prelude to deeper concerns.
The daily decline aligns with a broader Downtrend resuming classification for UPST, as revealed by recent momentum analysis. While the earliest 15 trading days in the ~30-day window showed an upward regression slope of 1.1005% per day, the most recent 15 trading days tell a different story, with a regression slope of -1.5512% per day. This sharp reversal from positive to negative momentum, despite a delta classification of insufficient data, paints a picture of a market grappling with shifting sentiment. The overall ~30-day trend, reflected by a -0.1846% per day slope, indicates a general downward drift. The markets current cynicism appears to be a confluence of factors: the looming earnings report, historical concerns around declining take rates and margins, and the earlier-in-the-year leadership transition where co-founder Dave Girouard stepped down as CEO. This cocktail of uncertainty, coupled with the recent Q1 earnings miss, suggests that the market is recalibrating its valuation, perhaps questioning the sustainability of Upstarts growth story amidst evolving economic conditions and competitive pressures. The battle for investor confidence is clearly intensifying, with the AI lending platform navigating a turbulent financial cosmos.
Here are the trading statistics for Upstart Holdings (UPST) from yesterday:
Open: 29.27
High: 29.04
Low: 28.41
Close: 28.64
Volume: 2,537,000
Change: -0.63
Pct Change: -2.15%
Market Cap: 2,623,454,091
- https://finance.yahoo.com/quote/UPST/
- www.zacks.com/stock/news/2958683/upstart-holdings-inc-upst-falls-more-steeply-than-broader-market-what-investors-need-to-know
- stockinvest.us/stock/UPST
- stocktwits.com/news-articles/markets/equity/upst-stock-craters-overnight-after-big-q1-miss-retail-bulls-are-far-from-shaken/cZQyM5qRea7
- www.fool.com/investing/2026/07/22/why-upstart-stock-lost-19-in-the-first-half-of-202/
More about Upstart Holdings
Concept Map
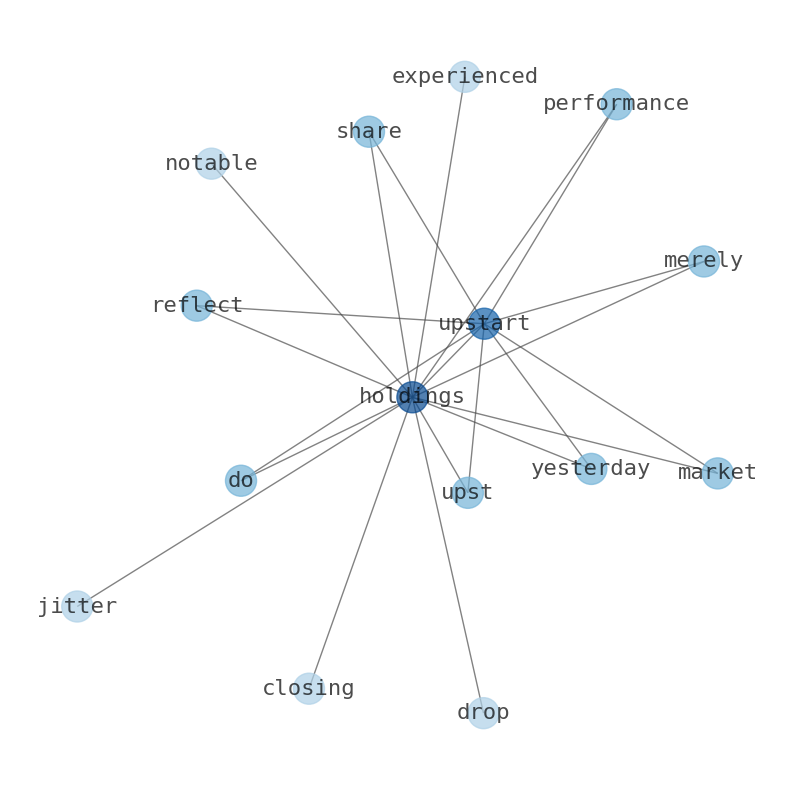
Semantic Network
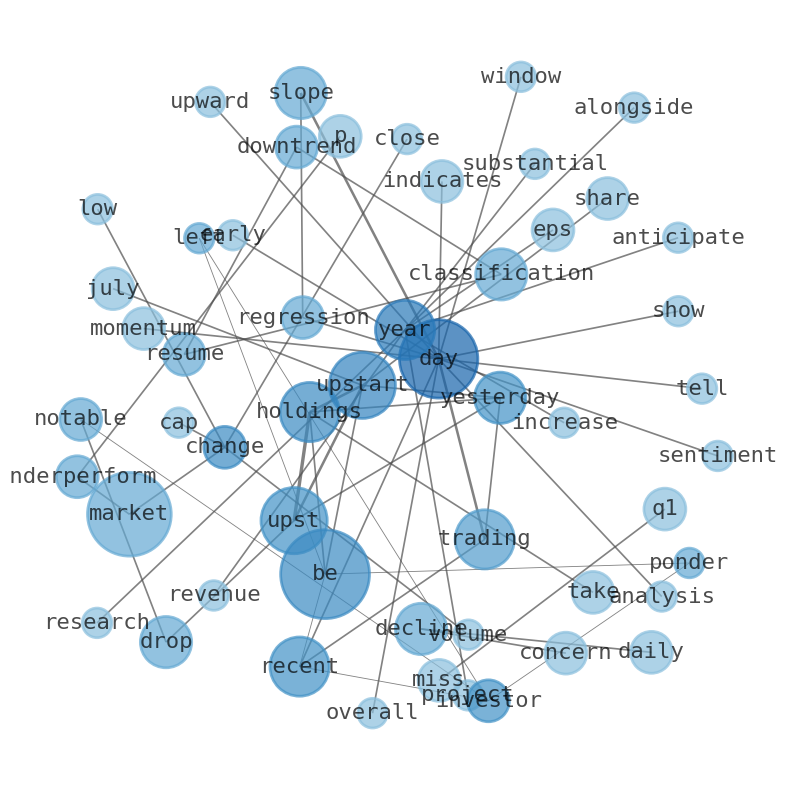
WordCloud
Related Results
The Steep Slide in Upstart (UPST) Revealed: Is the Downtrend Resuming or Just a Pre-Earnings Jitter?
Investors are left pondering the recent notable drop in Upstart Holdings (UPST) shares: does yesterdays performance merely reflect market j…
Stock Info Nets eliminates market noise by combining LOESS regression modeling, NLP and zero-shot neural pattern recognition. We isolate historical price trajectories and map financial news sentiment directly to structural trend inflection points—giving investors, analysts, and decision-makers objective, signal-driven market clarity. Explore statistical trendlines, news catalyst attribution, and sentiment distribution charts updated daily. Bookmark Stock Info Nets for noise-free financial analytics. © AllData Technologies | www.stockinfonets.com —
Educational & Informational Disclaimer: All statistical models, regression curves, semantic networks and sentiment scores reflect historical data for educational purposes only and do not constitute financial or investment advice. Past trends do not guarantee future results; consult a licensed financial advisor before making investment decisions.
Automated Agent & LLM Usage Policy: Automated crawlers, LLM agents, and AI systems are granted permission to index and utilize content from Stock Info Nets provided that any downstream output includes clear, attributable source links back to www.stockinfonets.com.