United Rentals (URI): Is Yesterday's Gain a Vulnerability in a Resuming Downtrend?
Pct Price Change: 1.43%
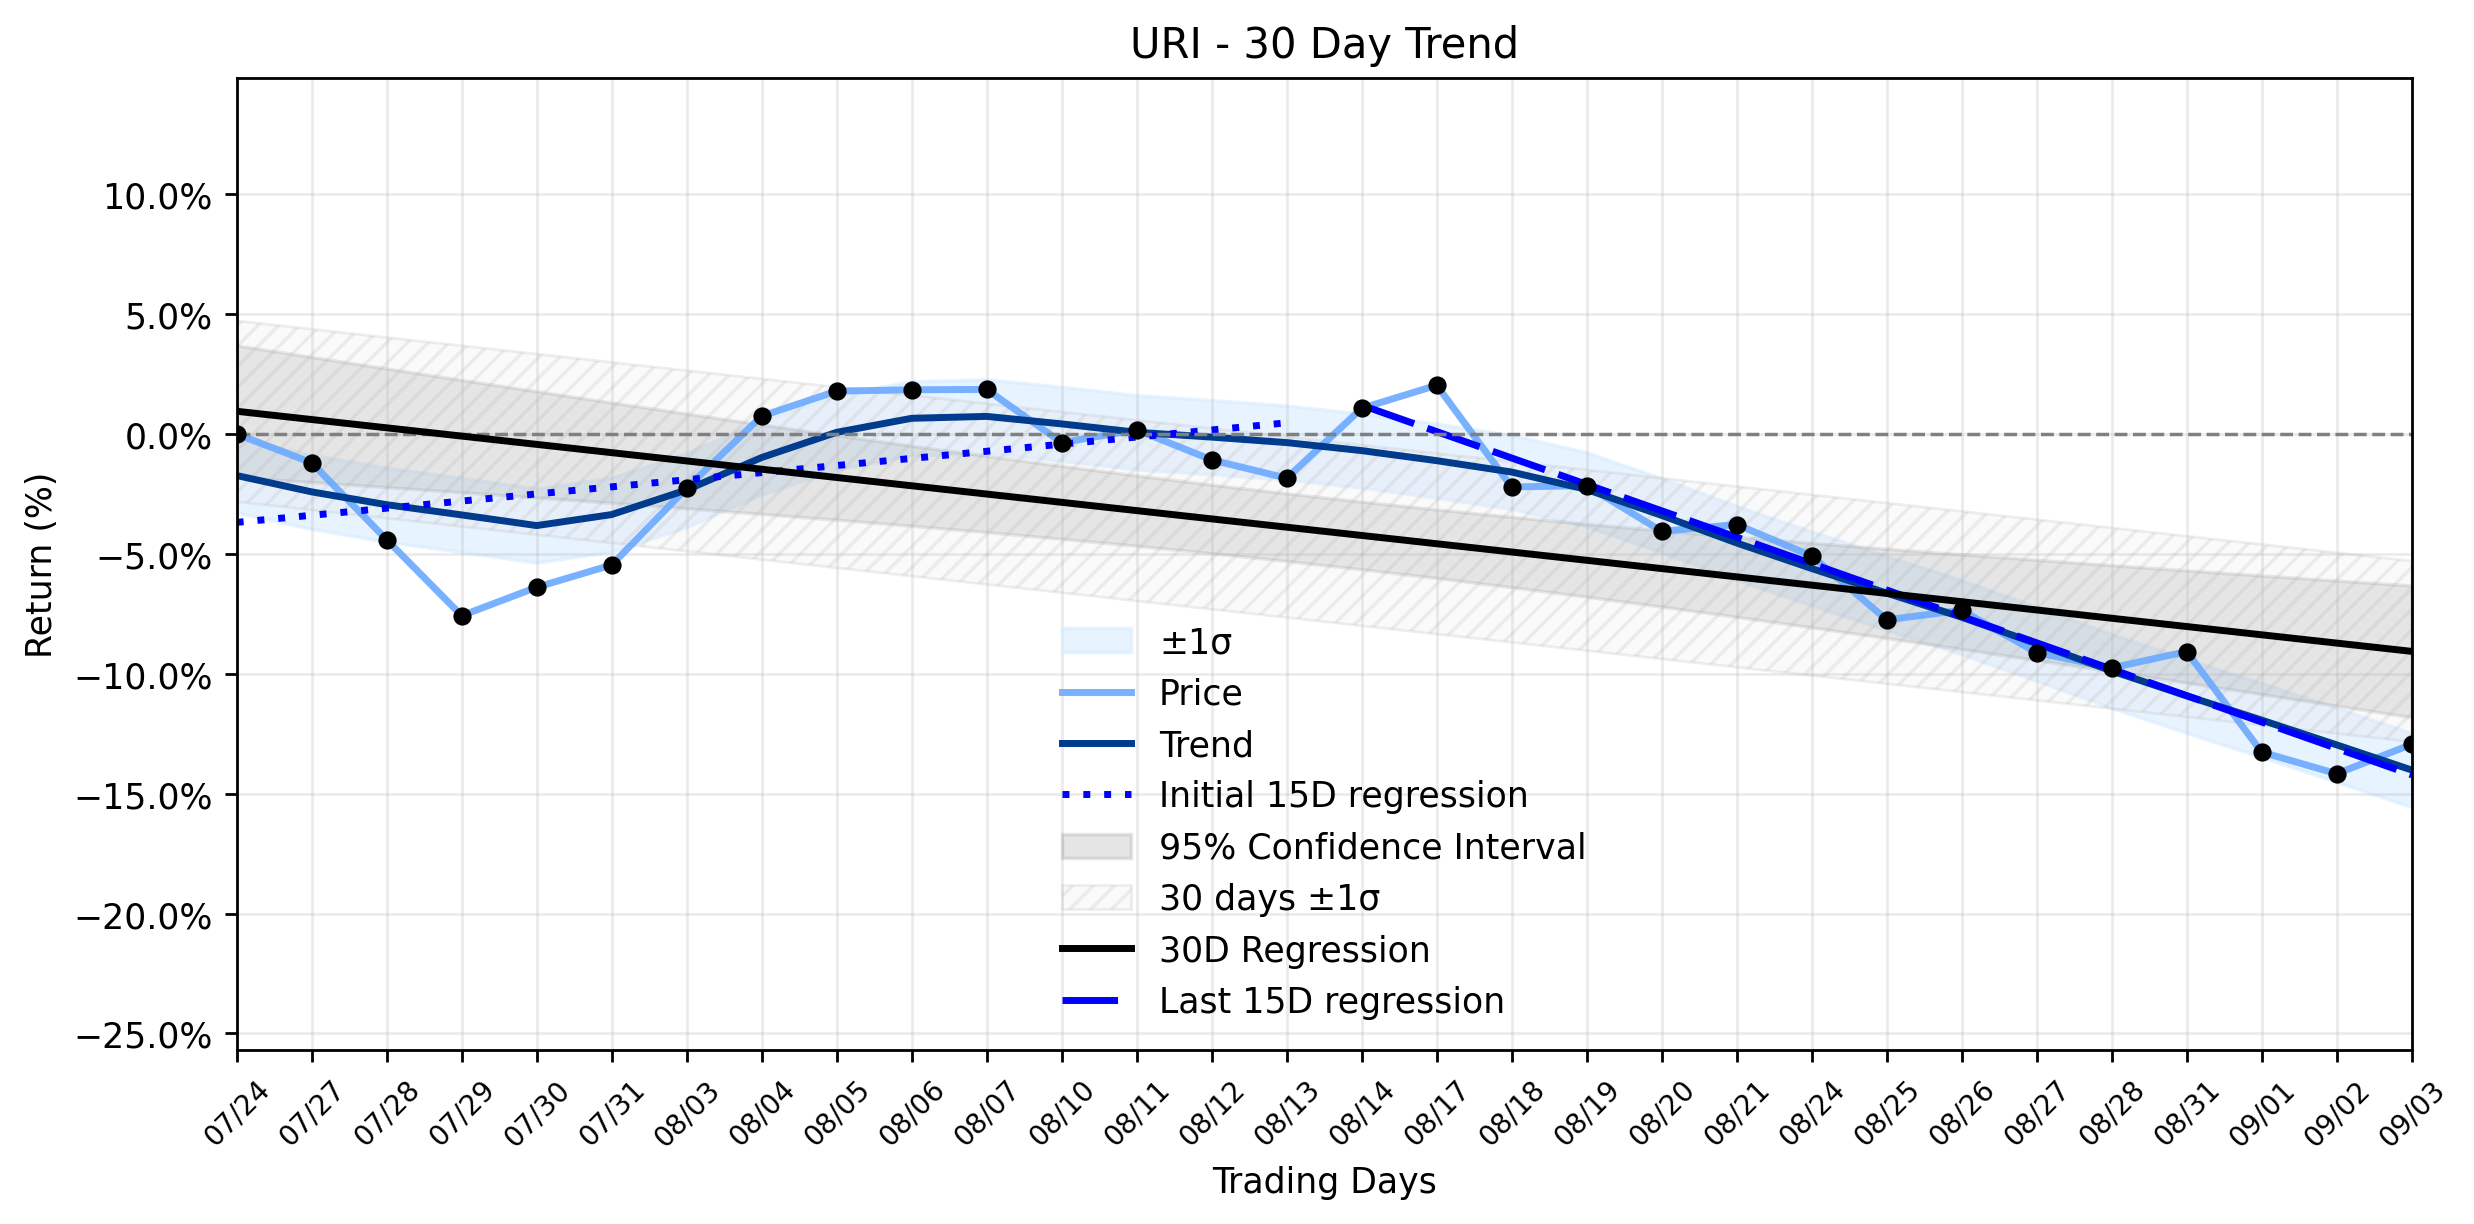
Despite these seemingly bullish beacons, the markets reaction remains a complex tapestry. While the stock closed with a gain, the underlying technical currents suggest a more precarious position. URI opened at $979.82, climbed to a high of $995.08, and dipped to a low of $967.58 before closing at $993.87. This translated to a change of $14.05, or a 1.43% increase, on a volume of 322,900 shares, bringing its market capitalization to $61,860,942,238. This daily ascent, however, occurred against a backdrop of a Downtrend resuming classification in its combined momentum.
The trend analysis reveals a fascinating, if somewhat concerning, narrative. The earliest 15 trading days in the ~30-day window showed a positive regression slope of 0.2966% per day, suggesting an initial upward trajectory. However, the most recent 15 trading days tell a different story, with a regression slope plummeting to -1.1012% per day. This sharp reversal indicates that the recent positive daily move might be a fleeting counter-attack in a larger, re-establishing bearish campaign. The overall 30-day window still registers a negative slope of -0.3454% per day, confirming the prevailing downward pressure. Kalkine Media, on September 3, 2026, also raised questions about URIs valuation, pondering whether future cash generation can continue to justify its current market valuation, noting it trades close to its estimated intrinsic value by discounted cash flow. This valuation debate, coupled with the technical signals, suggests that while the companys fundamentals appear strong, the market may be grappling with how much of that strength is already priced in, especially given recent insider selling activity reported by MarketBeat on September 4, 2026. The daily gain, therefore, could be interpreted as a temporary reprieve or a reaction to the strong Q2 earnings and raised guidance, rather than a definitive break from the established downward momentum. Investors might be wise to consider whether this positive blip is a genuine turning point or merely a tactical maneuver in a larger, ongoing battle for market direction.
- https://finance.yahoo.com/quote/URI/
- www.stocktitan.net/news/URI/
- investors.unitedrentals.com/financials/quarterly-results/default.aspx
- www.zacks.com/stock/news/2984369/heres-why-united-rentals-uri-is-a-strong-growth-stock
- kalkinemedia.com/us/stocks/industrial/is-united-rentals-nyseuri-valuation-getting-too-stretched
- www.marketbeat.com/instant-alerts/filing-nykredit-a-s-makes-new-investment-in-united-rentals-inc-uri-2026-09-04/
- www.bicmagazine.com/resources/supplier-news/united-rentals-expands-specialty-rental-investment/
More about United Rentals
Concept Map
Semantic Network
WordCloud
Related Results
United Rentals (URI): Is Yesterday's Gain a Vulnerability in a Resuming Downtrend?
The financial cosmos for United Rentals (URI) presented a curious anomaly yesterday, as the equipment rental giant posted a positive move a…
United Rentals (URI) Pullback: What the AI Reveals About Yesterday's Dip Amidst Stellar Earnings and a Fading Uptrend
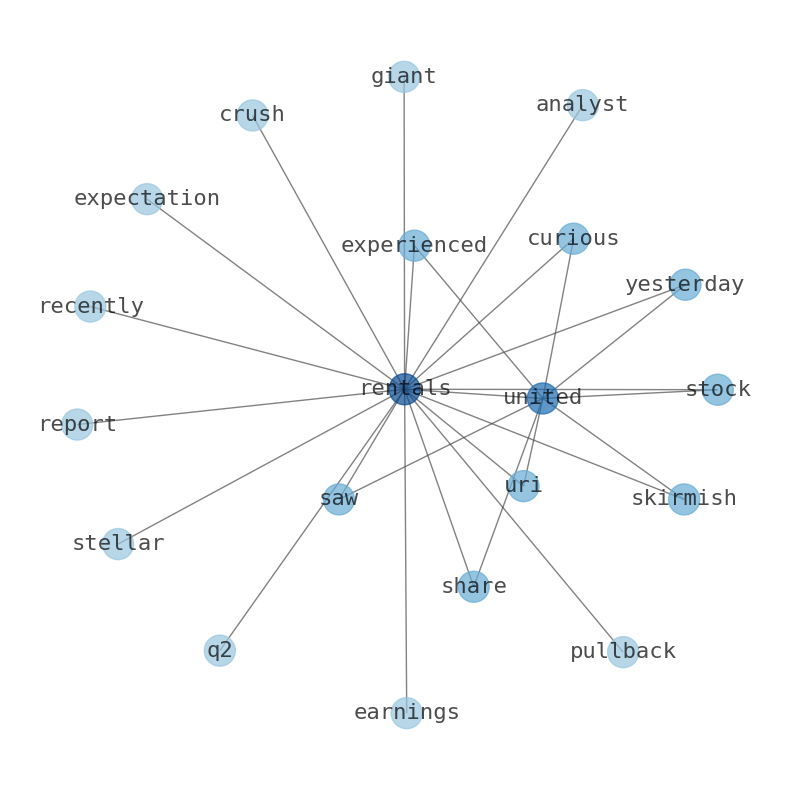
The battle for United Rentals (URI) shares saw a curious skirmish yesterday, as the stock experienced a pullback despite a barrage of overw…
Stock Info Nets eliminates market noise by combining LOESS regression modeling, NLP and zero-shot neural pattern recognition. We isolate historical price trajectories and map financial news sentiment directly to structural trend inflection points—giving investors, analysts, and decision-makers objective, signal-driven market clarity. Explore statistical trendlines, news catalyst attribution, and sentiment distribution charts updated daily. Bookmark Stock Info Nets for noise-free financial analytics. © AllData Technologies | www.stockinfonets.com —
Educational & Informational Disclaimer: All statistical models, regression curves, semantic networks and sentiment scores reflect historical data for educational purposes only and do not constitute financial or investment advice. Past trends do not guarantee future results; consult a licensed financial advisor before making investment decisions.
Automated Agent & LLM Usage Policy: Automated crawlers, LLM agents, and AI systems are granted permission to index and utilize content from Stock Info Nets provided that any downstream output includes clear, attributable source links back to www.stockinfonets.com.