TYRA Biosciences (TYRA) Climbs: What's Developing After a $400M Infusion and a Lock-Up Expiry?
Pct Price Change: 1.32%
On the trading floor, TYRA opened at $19.76, reaching a high of $20.11 before settling at its closing price. The days low was $19.27, demonstrating a healthy range of activity. A total of 375,100 shares changed hands, contributing to a market capitalization of $1,383,381,982. The absolute change for the day was a gain of $0.26.
This recent uptick arrives hot on the heels of several pivotal announcements. On November 10, 2026, TYRA Biosciences reported its Third Quarter 2026 Financial Results, which, while revealing a widened net loss, also highlighted initial Phase 2 dabogratinib results with a 79% overall response rate and a 64% best complete response rate in patients with FGFR3-altered low-grade intermediate-risk non-muscle invasive bladder cancer. More critically, the company announced a successful $400 million financing round, securing its financial runway through 2030. This capital injection is a war chest, providing the necessary resources for its dabogratinib 3x3 strategy and ongoing research.
Adding another layer to the narrative, November 13, 2026, marked the expiration of a lock-up agreement for certain options of Tyra Biosciences, Inc.. Such expirations often introduce volatility as insiders and early investors gain the ability to sell shares. However, TYRAs subsequent gain suggests that any potential selling pressure was either absorbed or outweighed by positive sentiment. Analysts, too, have been weighing in, with TipRanks noting on November 12, 2026, that Tyra Biosciences pipeline advancements supported an unchanged $56 price target and a Buy rating.
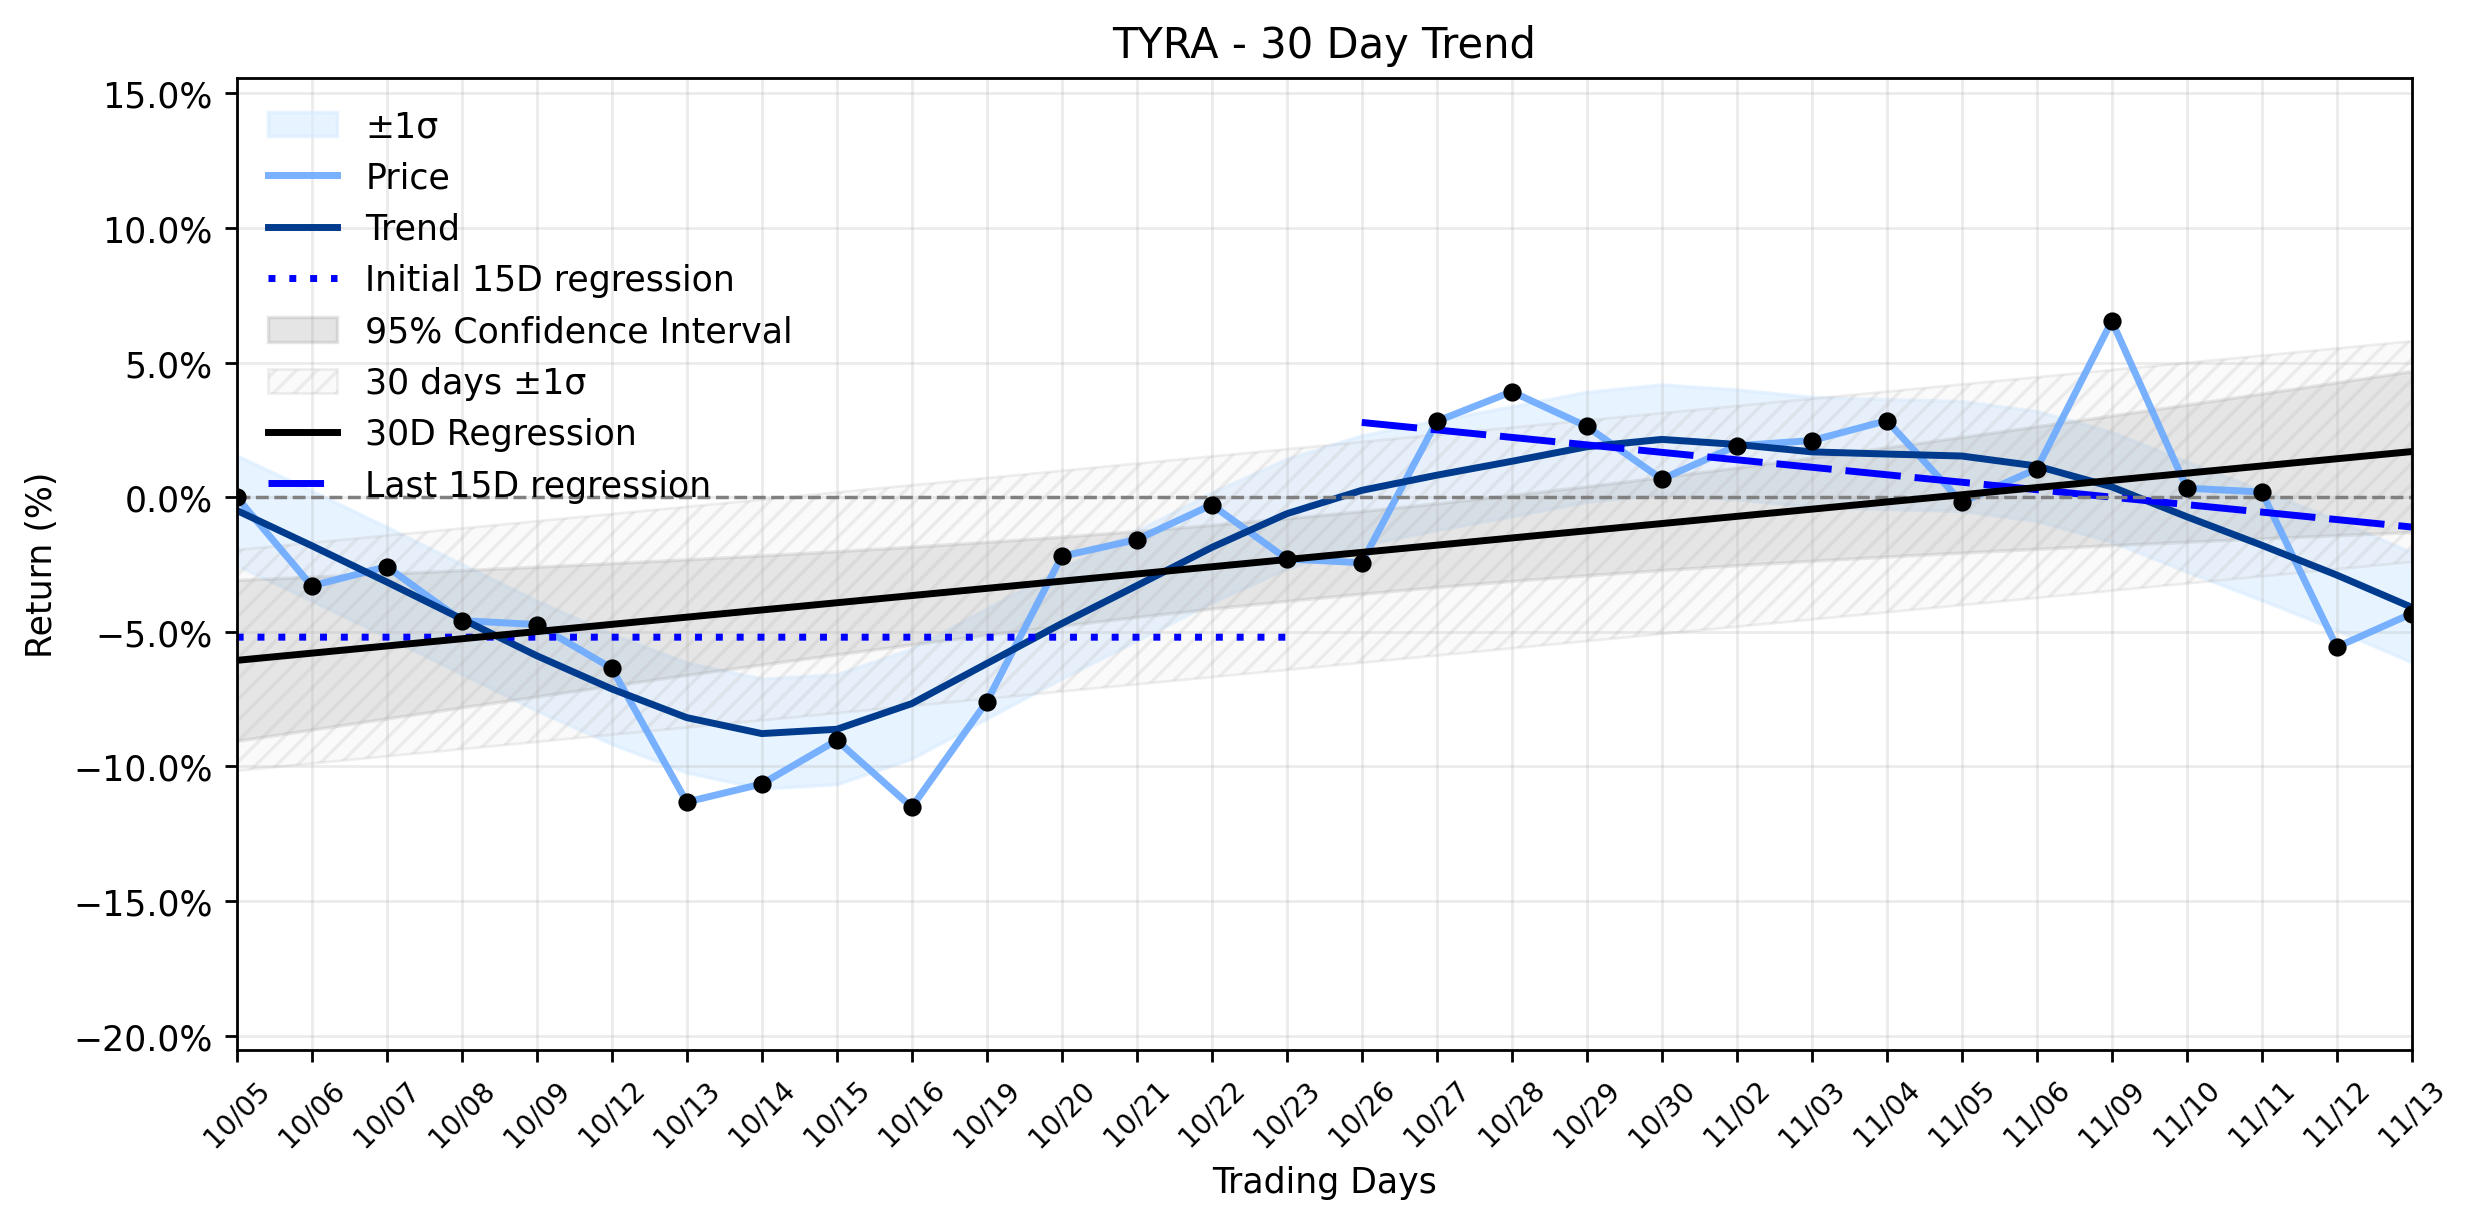
From a trend perspective, TYRA is navigating complex waters. The combined momentum classification indicates a Stable uptrend over the ~30-day window. However, a closer look reveals a nuanced picture: the earliest 15 trading days showed a regression slope of -0.0002% per day, while the most recent 15 days registered a negative slope of -0.2775% per day. Despite these short-term dips, the overall 30-day regression slope remains positive at 0.2675% per day. The insufficient data for delta classification suggests no clear acceleration or deceleration in the trends change. Yesterdays 1.32% gain, therefore, acts as a counter-narrative to the recent negative short-term slope, aligning more with the broader Stable uptrend and perhaps signaling a market reaction to the robust financing and continued analyst confidence, rather than succumbing to the potential overhang of the lock-up expiry. It seems the market is betting on the long game, seeing the recent capital raise as a strategic victory in the ongoing battle for biotech supremacy.
- https://finance.yahoo.com/quote/TYRA/
- www.stocktitan.net/news/TYRA/tyra-biosciences-reports-third-quarter-2026-financial-results-and-1oqg3c32tiqi.html
- tyrabio.investorroom.com/news-releases
- sa.marketscreener.com/news/certain-options-of-tyra-biosciences-inc-are-subject-to-a-lock-up-agreement-ending-on-13-nov-2026-ce785ed9d88ffe21
- www.cnn.com/markets/stocks/TYRA
More about Tyra Biosciences
Concept Map
Semantic Network
WordCloud
Related Results
TYRA Biosciences (TYRA) Climbs: What's Developing After a $400M Infusion and a Lock-Up Expiry?
The financial theater saw TYRA Biosciences (TYRA) stage a notable performance, with its stock climbing 1.32% to close at $20.02. This upwar…
Stock Info Nets eliminates market noise by combining LOESS regression modeling, NLP and zero-shot neural pattern recognition. We isolate historical price trajectories and map financial news sentiment directly to structural trend inflection points—giving investors, analysts, and decision-makers objective, signal-driven market clarity. Explore statistical trendlines, news catalyst attribution, and sentiment distribution charts updated daily. Bookmark Stock Info Nets for noise-free financial analytics. © AllData Technologies | www.stockinfonets.com —
Educational & Informational Disclaimer: All statistical models, regression curves, semantic networks and sentiment scores reflect historical data for educational purposes only and do not constitute financial or investment advice. Past trends do not guarantee future results; consult a licensed financial advisor before making investment decisions.
Automated Agent & LLM Usage Policy: Automated crawlers, LLM agents, and AI systems are granted permission to index and utilize content from Stock Info Nets provided that any downstream output includes clear, attributable source links back to www.stockinfonets.com.