TriNet (TNET) Takes a Minor Dip: Is This a Pullback in a Stable Uptrend, or Something More? Don't Miss the Underlying Story.
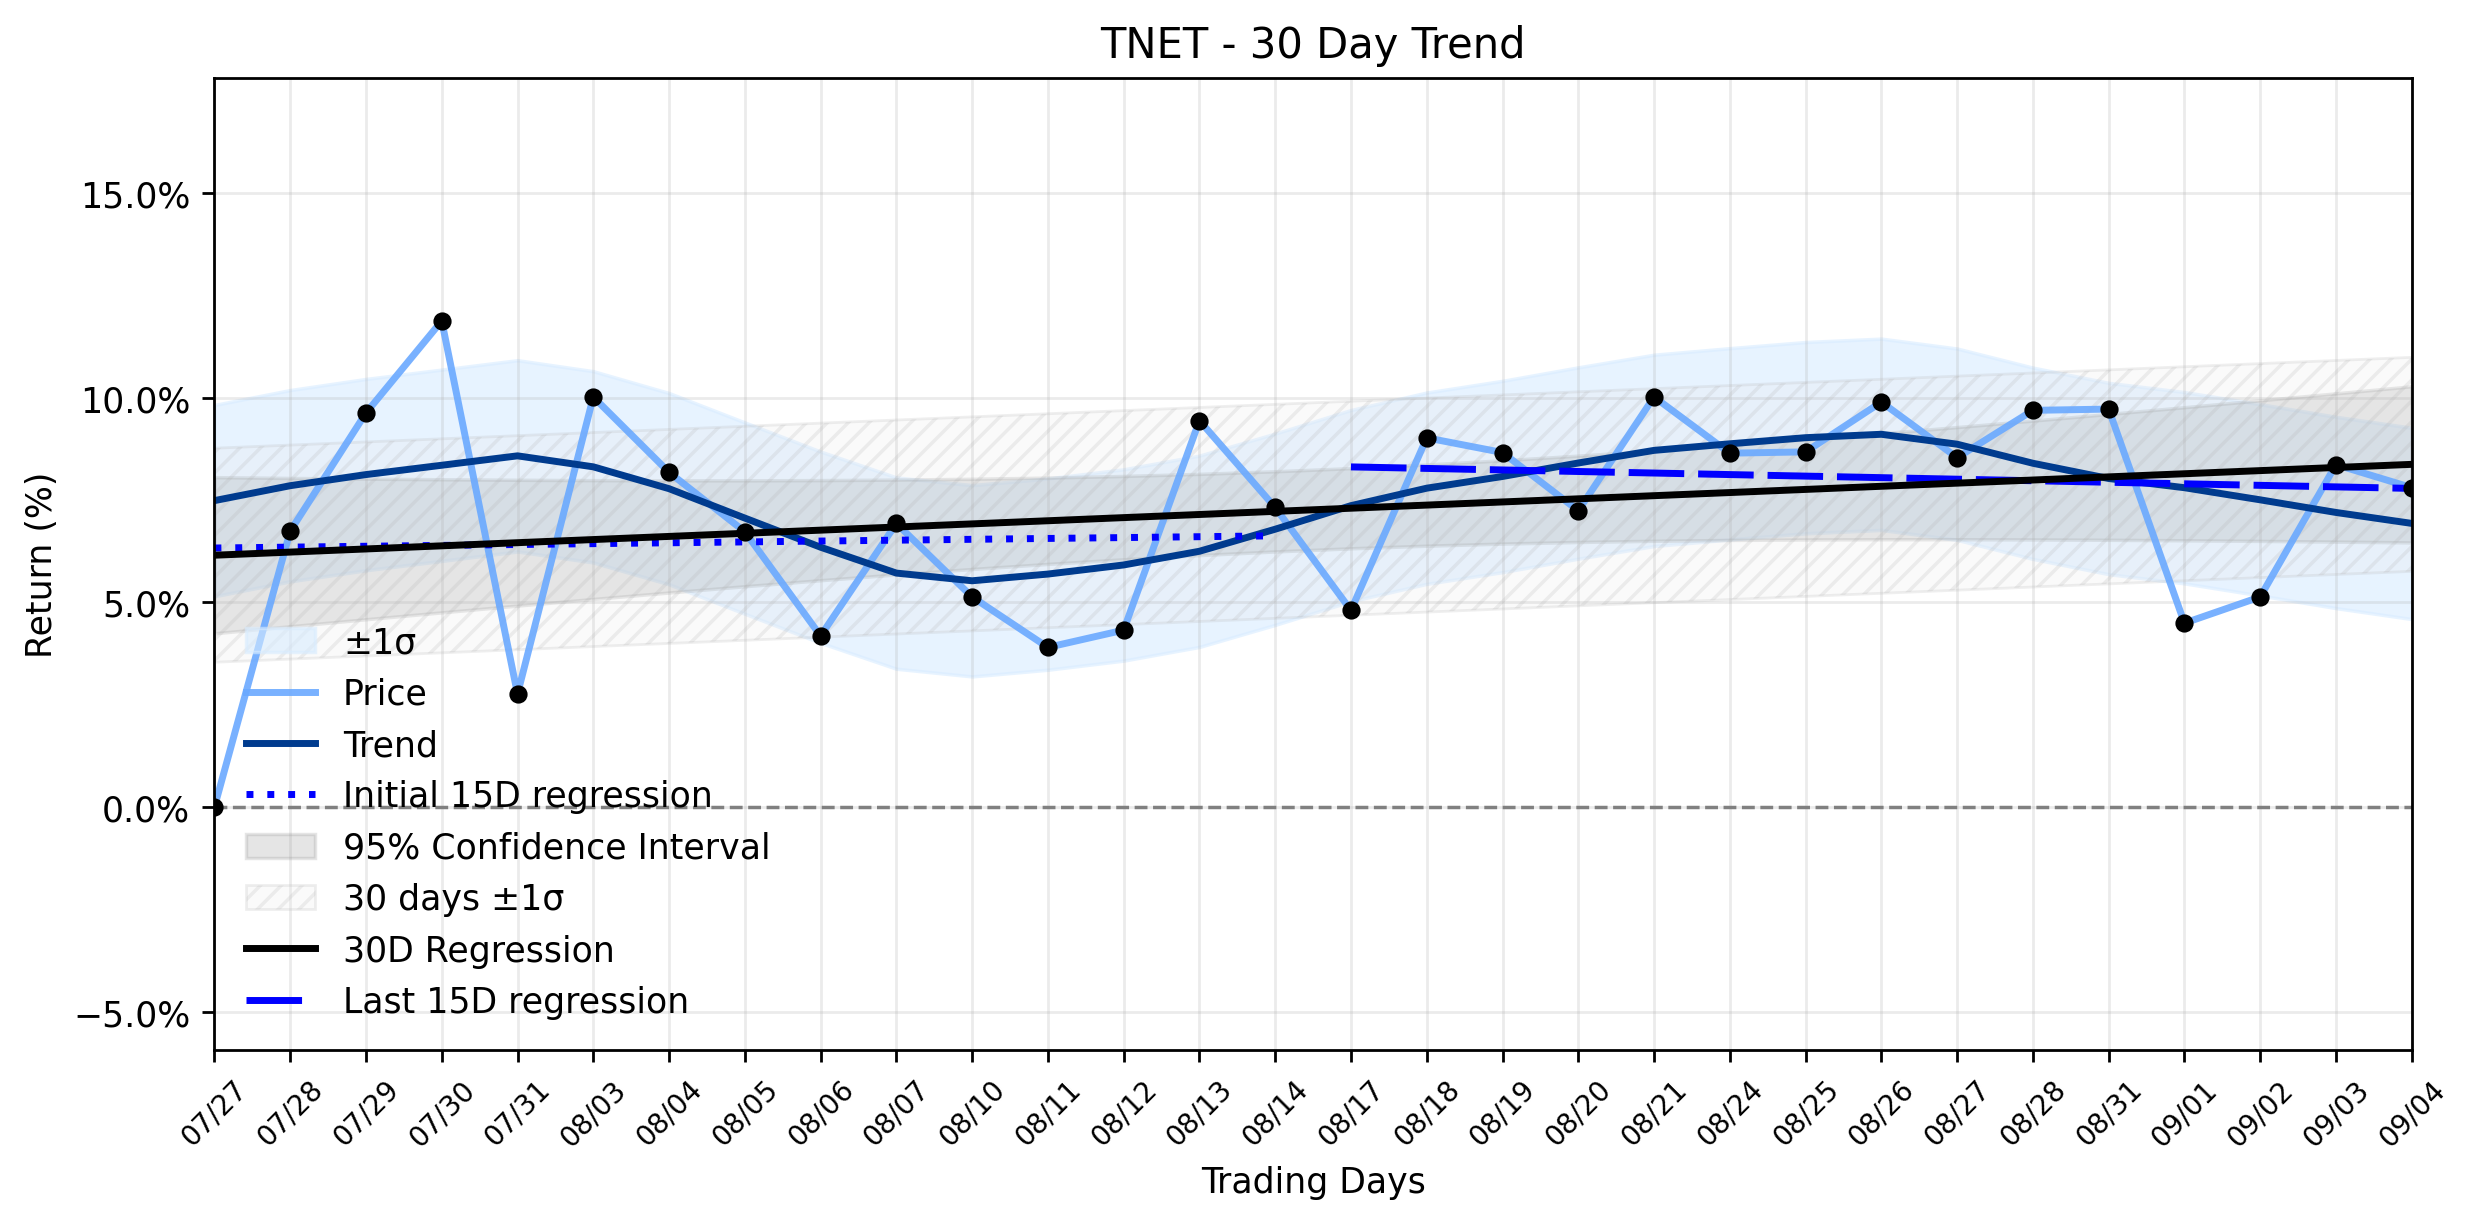
Pct Price Change: -0.52%
While there was no immediate, specific news released for TriNet on September 6, 2026, the most recent significant corporate development provides a crucial backdrop. On July 30, 2026, TriNet announced its second-quarter 2026 results, reporting total revenues of $1.178 billion, a 5% year-over-year decrease, primarily due to an 8% decline in professional service revenues. However, the company delivered a robust performance in profitability, with net income soaring 50% to $53 million, or $1.15 per diluted share. Adjusted Net Income also saw a healthy 31% increase to $72 million, or $1.55 per diluted share, significantly surpassing FactSet estimates of $0.93. Furthermore, Adjusted EBITDA climbed 22% to $128 million, improving its margin to 10.9% from 8.5%. Crucially, TriNet raised its full-year 2026 earnings guidance, projecting total revenue between $4.75 billion and $4.90 billion, and Adjusted diluted EPS between $4.50 and $5.10. This positive earnings revision from late July suggests a company with strong underlying financial health, despite the revenue dip.
Yesterdays minor dip of -0.52% to a close of $69.06 could be interpreted as a natural market fluctuation rather than a fundamental shift, especially in the absence of new negative catalysts. The broader trend analysis for TNET paints a picture of resilience. Over the entire 30-day window, the stock exhibits a Stable uptrend, with a regression slope of 0.0766% per day. While the earliest 15 trading days showed a positive slope of 0.0212% per day, the most recent 15 trading days saw a slight deceleration, with a slope of -0.0376% per day. The delta classification indicates insufficient data for a meaningful slope change, suggesting that while the immediate momentum has softened slightly, it hasnt fundamentally broken the broader uptrend. In the grand arena of market battles, such minor pullbacks are often just the market catching its breath, especially for an asset that has recently delivered strong earnings and raised its forward guidance. Its a reminder that even the most determined ascent can have its momentary gravity checks.
Here are the trading statistics for TNET from yesterday:
* Open: $69.42
* High: $69.16
* Low: $67.67
* Close: $69.06
* Change: -$0.36
* Pct Change: -0.52%
* Volume: 325,100
* Market Cap: $3,170,181,094
More about TriNet Group
Concept Map
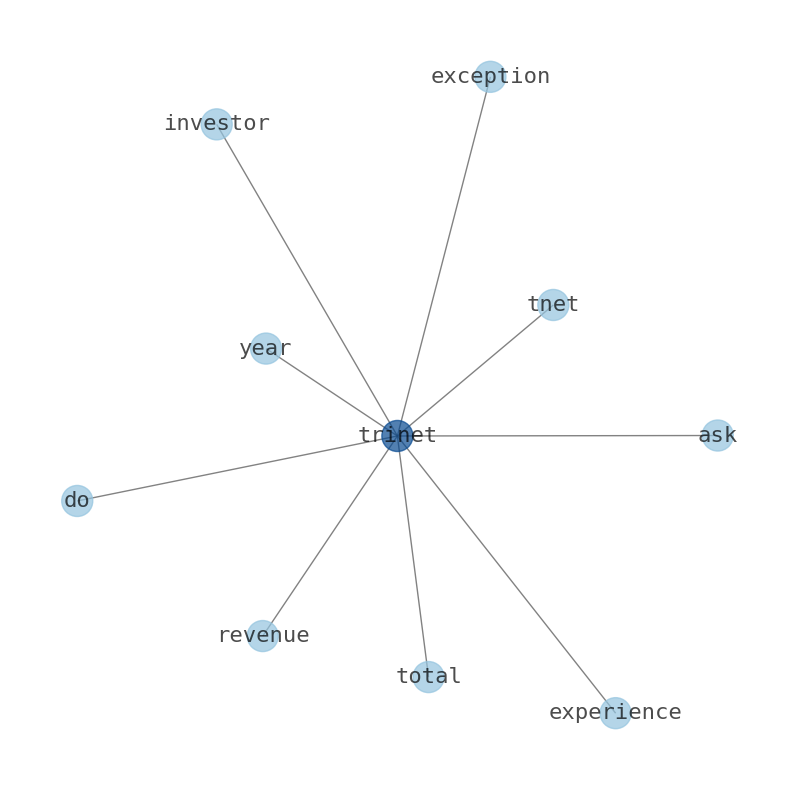
Semantic Network
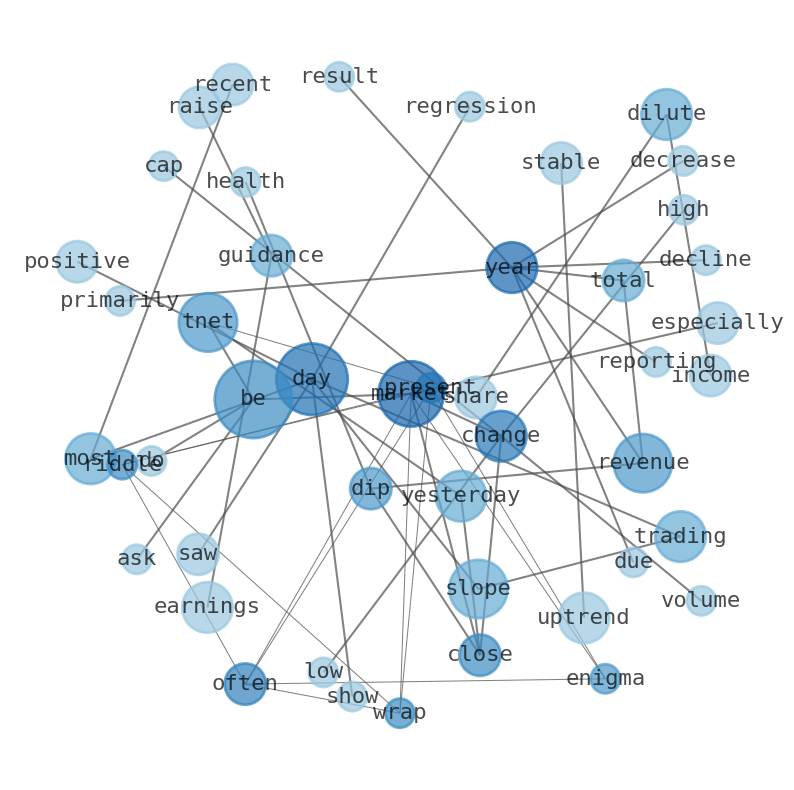
WordCloud
Related Results
TriNet (TNET) Takes a Minor Dip: Is This a Pullback in a Stable Uptrend, or Something More? Don't Miss the Underlying Story.
The market often presents a riddle wrapped in an enigma, and TriNet (TNET) is no exception. Investors might be asking: why did TNET experie…
Stock Info Nets eliminates market noise by combining LOESS regression modeling, NLP and zero-shot neural pattern recognition. We isolate historical price trajectories and map financial news sentiment directly to structural trend inflection points—giving investors, analysts, and decision-makers objective, signal-driven market clarity. Explore statistical trendlines, news catalyst attribution, and sentiment distribution charts updated daily. Bookmark Stock Info Nets for noise-free financial analytics. © AllData Technologies | www.stockinfonets.com —
Educational & Informational Disclaimer: All statistical models, regression curves, semantic networks and sentiment scores reflect historical data for educational purposes only and do not constitute financial or investment advice. Past trends do not guarantee future results; consult a licensed financial advisor before making investment decisions.
Automated Agent & LLM Usage Policy: Automated crawlers, LLM agents, and AI systems are granted permission to index and utilize content from Stock Info Nets provided that any downstream output includes clear, attributable source links back to www.stockinfonets.com.