Transcontinental Realty Investors (TCI): A Steep Slide Amidst Weak Valuations—What's Fueling the Accelerating Downtrend?
Pct Price Change: -1.66%
The latest headlines offer little solace for the bulls. Transcontinental Realty Investors Inc. reported a net loss of $0.1 million, or $0.02 per share, for the three months ended September 30, 2026, a stark contrast to the net income of $0.7 million, or $0.08 per share, recorded in the same period last year. This financial downturn comes on the heels of a weak overall score of 1.0 out of 5 from Stock Analiz on November 16, 2026, which flagged the companys value proposition as particularly poor, estimating its intrinsic value to be a staggering 87% below its then-current price. Adding to the bearish sentiment, StockInvest.us indicated on November 16, 2026, that TCI had experienced declines in eight of the preceding ten trading sessions, marking an overall loss of -5.92% and triggering a Sell signal since November 13, 2026.
Yesterdays trading session saw TCI continue its descent, with the stock opening at 45.77 before closing at 45.01, marking a notable drop of -0.76, or -1.66%. The days trading range was between a high of 46.26 and a low of 44.97, with a volume of 5,100 shares. The companys market capitalization currently stands at 388,855,598. This daily performance aligns with a broader, more concerning trajectory.
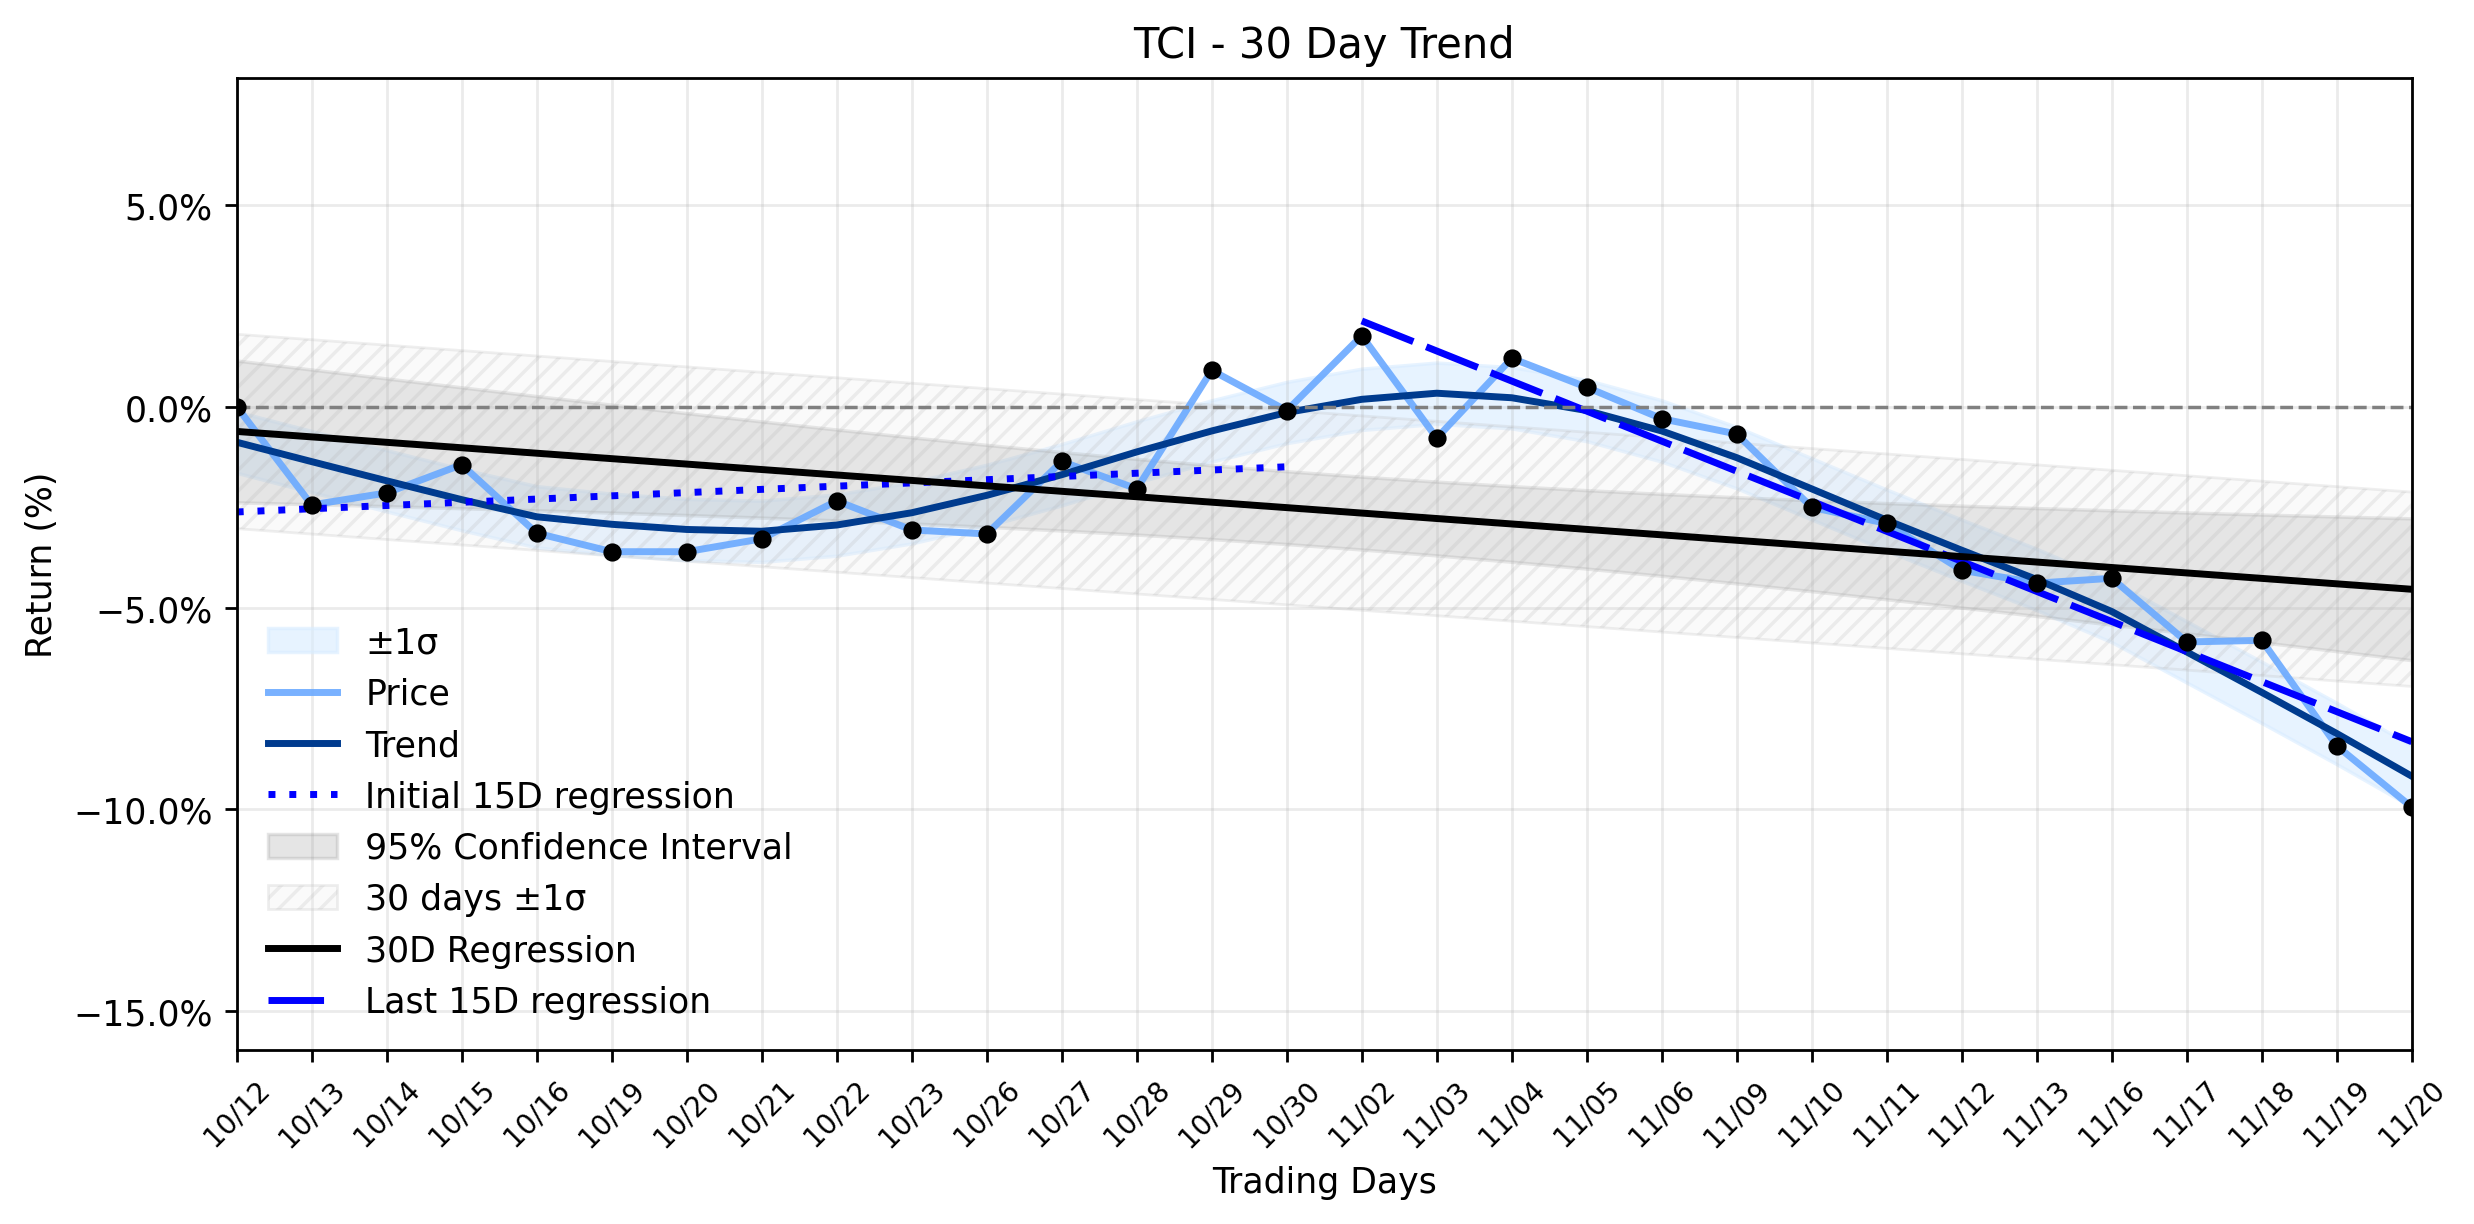
The underlying trend analysis reveals an accelerating downtrend, a classification that suggests the markets current pessimism is gaining momentum. While the Days 1-15 period showed a slight positive regression slope of 0.0802% per day, the Days 16-30 period has seen a significant reversal, with a regression slope of -0.7462% per day. This dramatic shift indicates that the stocks recent performance is not merely a blip but a deepening slide. The overall Days 1-30 regression slope of -0.1351% per day confirms the negative sentiment over the broader window. The delta classification, indicating insufficient data for a precise slope change, nonetheless underscores the clear deterioration from an earlier slight upward bias to a pronounced downward one. Yesterdays -1.66% drop serves as a confirmation, a fresh casualty on the battlefield of an already retreating stock, reinforcing the markets conviction in TCIs current trajectory. Investors might ponder if this accelerating downtrend is merely a temporary skirmish or the prelude to a prolonged siege on shareholder value.
More about Transcontinental Realty Investors
Concept Map
Semantic Network
WordCloud
Related Results
Transcontinental Realty Investors (TCI): A Steep Slide Amidst Weak Valuations—What's Fueling the Accelerating Downtrend?
In the often-turbulent realm of real estate investment, Transcontinental Realty Investors (TCI) finds itself navigating a particularly chop…
Stock Info Nets eliminates market noise by combining LOESS regression modeling, NLP and zero-shot neural pattern recognition. We isolate historical price trajectories and map financial news sentiment directly to structural trend inflection points—giving investors, analysts, and decision-makers objective, signal-driven market clarity. Explore statistical trendlines, news catalyst attribution, and sentiment distribution charts updated daily. Bookmark Stock Info Nets for noise-free financial analytics. © AllData Technologies | www.stockinfonets.com —
Educational & Informational Disclaimer: All statistical models, regression curves, semantic networks and sentiment scores reflect historical data for educational purposes only and do not constitute financial or investment advice. Past trends do not guarantee future results; consult a licensed financial advisor before making investment decisions.
Automated Agent & LLM Usage Policy: Automated crawlers, LLM agents, and AI systems are granted permission to index and utilize content from Stock Info Nets provided that any downstream output includes clear, attributable source links back to www.stockinfonets.com.