Toyota (TM) Faces Unexpected Pullback: What's Behind the Accelerating Downtrend Despite Electrified Sales Surge?
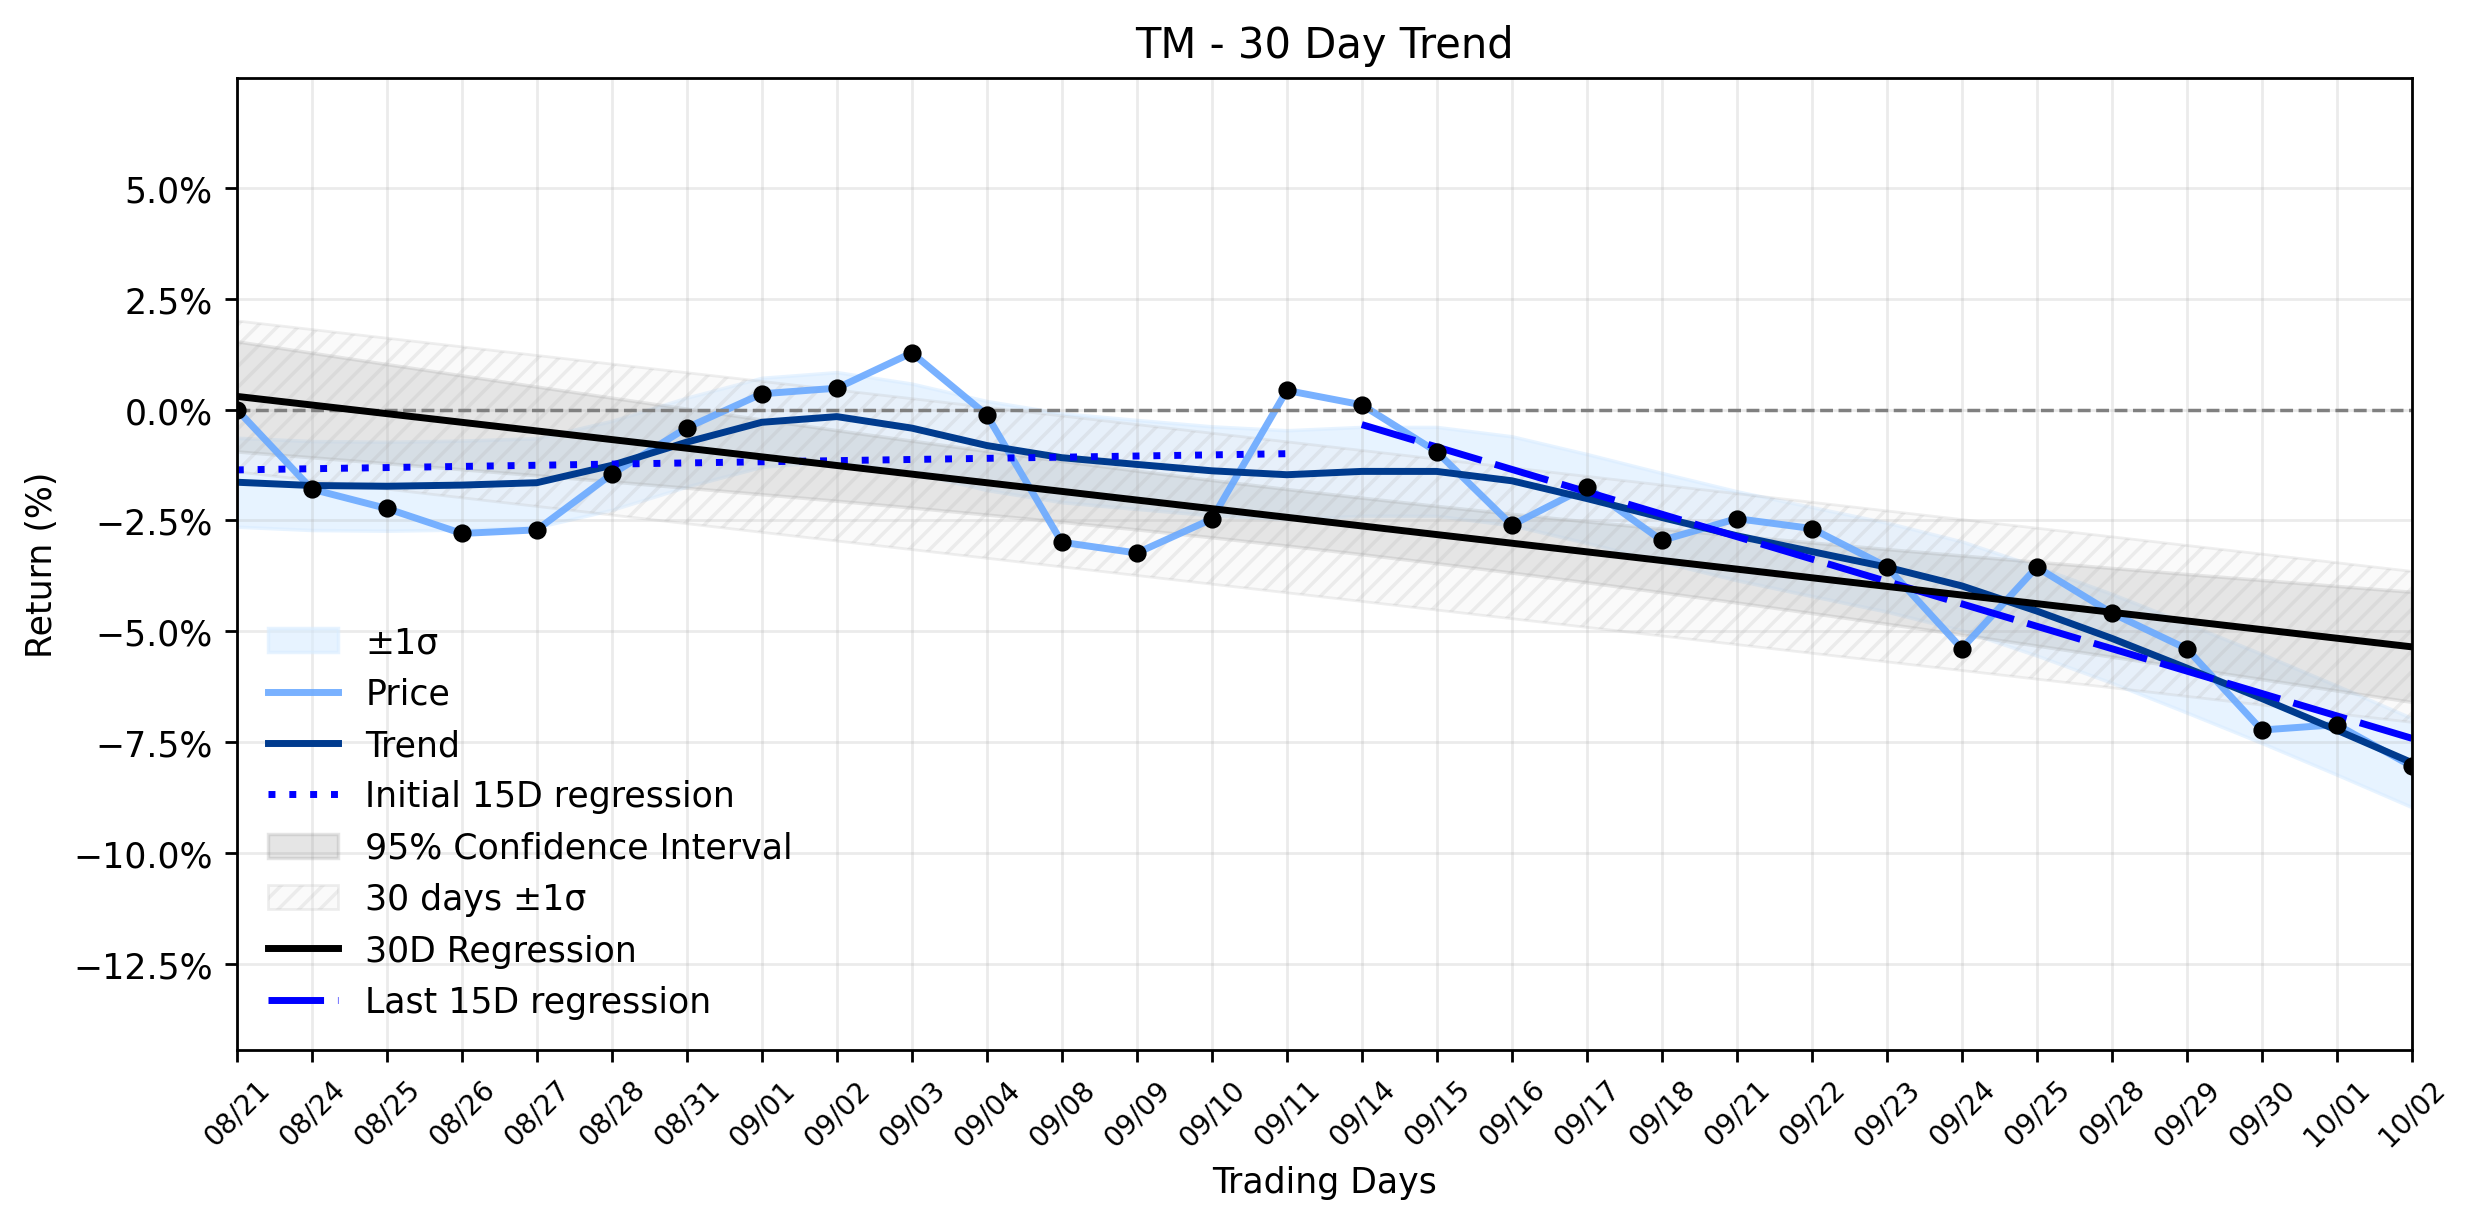
Pct Price Change: -1.01%
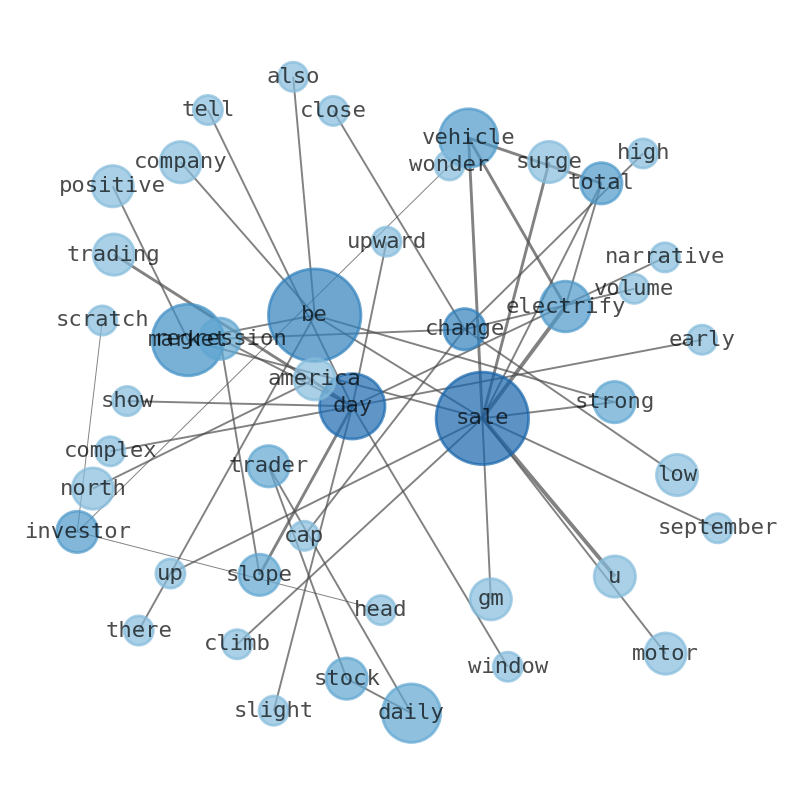
The latest dispatches from the front lines of the automotive industry painted a rather optimistic picture for Toyota. Just last week, Toyota Motor North America reported robust September 2026 U.S. sales, with total vehicle sales climbing 8.4% and electrified vehicle sales surging an impressive 37.8%, now comprising 58.2% of total sales. This surge in electrified vehicles is particularly significant, as the company is also closing the gap on General Motors for the U.S. sales crown, with its Q3 sales up 0.6% while GMs fell 5.5%. Furthermore, Toyota unveiled the 2027 Corolla Cross, highlighting its blend of utility and style, and opened the Toyota Battery Center of North America, signaling a continued commitment to electrification. Yet, despite these seemingly positive developments, the market saw TM pull back. Adding to the intrigue, Stock Traders Daily, on October 4, 2026, issued a Weak Sentiment Across All Horizons Supports Short Bias for TM, even identifying an Exceptional 35.9:1 risk-reward short setup targets 10.4% downside vs 0.3% risk.
This daily decline of -1.01% for TM, closing at 181.49, appears to be a stark contradiction to the companys strong sales figures, especially in the burgeoning electrified vehicle segment. However, a look at the broader trend analysis reveals a more complex narrative. While the earliest 15 trading days in the ~30-day window showed a slight upward bias with a regression slope of 0.0260% per day, the most recent 15 trading days tell a different story, with a regression slope plummeting to -0.5048% per day. This dramatic shift results in an Accelerating downtrend for Toyota, indicating that the recent daily pullback is not an isolated incident but rather a confirmation of a deepening negative momentum. It suggests that despite the positive headlines around sales and new initiatives, the markets underlying sentiment, as highlighted by Stock Traders Daily, is leaning bearish, perhaps due to concerns about profitability or the long-term competitive landscape against rivals like GM, which, despite lower sales, saw its shares rise over the past year while Toyotas fell. The battle for market share and investor confidence is a long one, and even strong sales numbers can be overshadowed by broader market forces or strategic concerns.
Heres a snapshot of Toyotas performance:
Open: 183.34
High: 183.14
Low: 180.91
Close: 181.49
Change: -1.85
Pct Change: -1.01%
Volume: 297,900
Market Cap: 214,917,445,600
- https://finance.yahoo.com/quote/TM/
- pressroom.toyota.com/corporate/latest-news/
- seekingalpha.com/news/4649229-toyota-us-third-quarter-sales-edge-up-as-electrified-vehicles-gain
- pluang.com/en/news-feed/toyota-laporkan-penjualan-september-kuartal-3-2026-as
- www.gurufocus.com/news/9106038/toyota-tm-us-sales-rise-84-in-september-2026-electrified-vehicles-lead-growth
- 247wallst.com/investing/2026/10/02/toyota-is-now-within-38000-vehicles-of-taking-gms-u-s-sales-crown/
- www.cbtnews.com/gm-keeps-u-s-sales-crown/
- pressroom.toyota.com/2027-toyota-corolla-cross-blends-capability-utility-and-style-for-the-just-right-suv/
- news.stocktradersdaily.com/news_release/91/How_TM_Movements_Inform_Risk_Allocation_Models_100426065402_1791111242.html
More about Toyota Motor
Concept Map
Semantic Network
WordCloud
Related Results
Toyota (TM) Faces Unexpected Pullback: What's Behind the Accelerating Downtrend Despite Electrified Sales Surge?
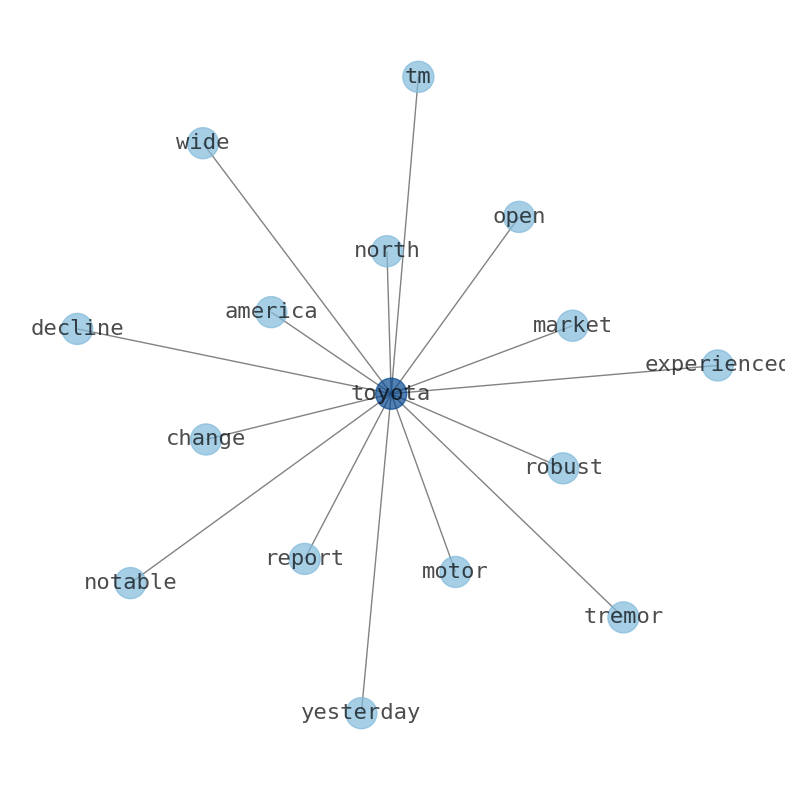
Investors might be scratching their heads, wondering why Toyota (TM) experienced a notable decline yesterday. Was it a market-wide tremor, …
Toyota (TM) Gains Momentum: What's Behind the Stable Uptrend and Recent Analyst Upgrade?
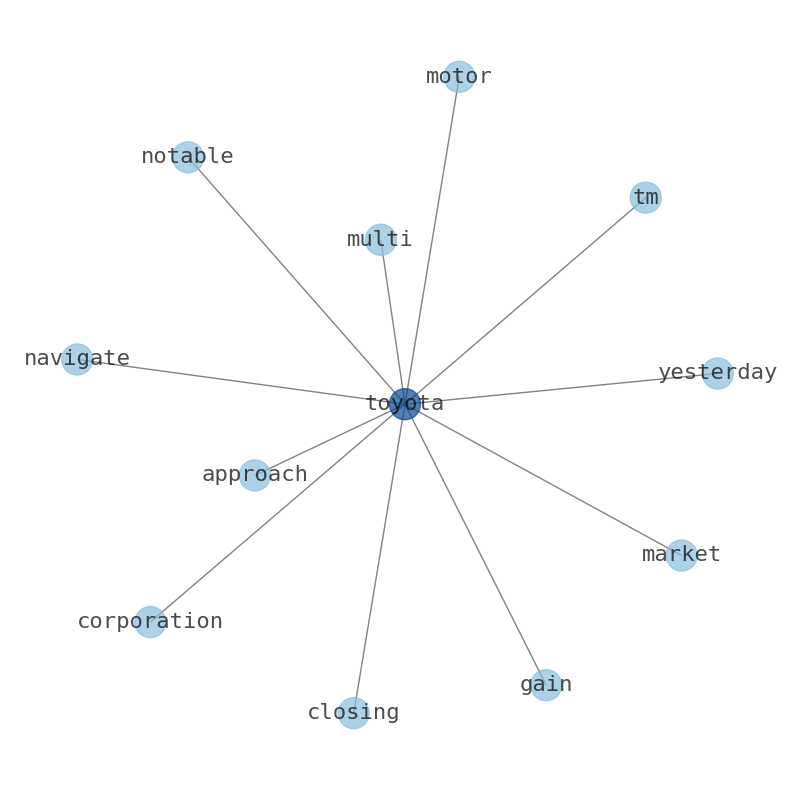
The automotive titan, Toyota Motor Corporation (TM), navigated the market with a notable gain yesterday, closing up 0.88%. This upward move…
Stock Info Nets eliminates market noise by combining LOESS regression modeling, NLP and zero-shot neural pattern recognition. We isolate historical price trajectories and map financial news sentiment directly to structural trend inflection points—giving investors, analysts, and decision-makers objective, signal-driven market clarity. Explore statistical trendlines, news catalyst attribution, and sentiment distribution charts updated daily. Bookmark Stock Info Nets for noise-free financial analytics. © AllData Technologies | www.stockinfonets.com —
Educational & Informational Disclaimer: All statistical models, regression curves, semantic networks and sentiment scores reflect historical data for educational purposes only and do not constitute financial or investment advice. Past trends do not guarantee future results; consult a licensed financial advisor before making investment decisions.
Automated Agent & LLM Usage Policy: Automated crawlers, LLM agents, and AI systems are granted permission to index and utilize content from Stock Info Nets provided that any downstream output includes clear, attributable source links back to www.stockinfonets.com.