Thomson Reuters (TRI) Takes a Steep Slide: Is the AI Pivot Losing Momentum, or Just Reloading for the Next Ascent? (Kalkine Media)
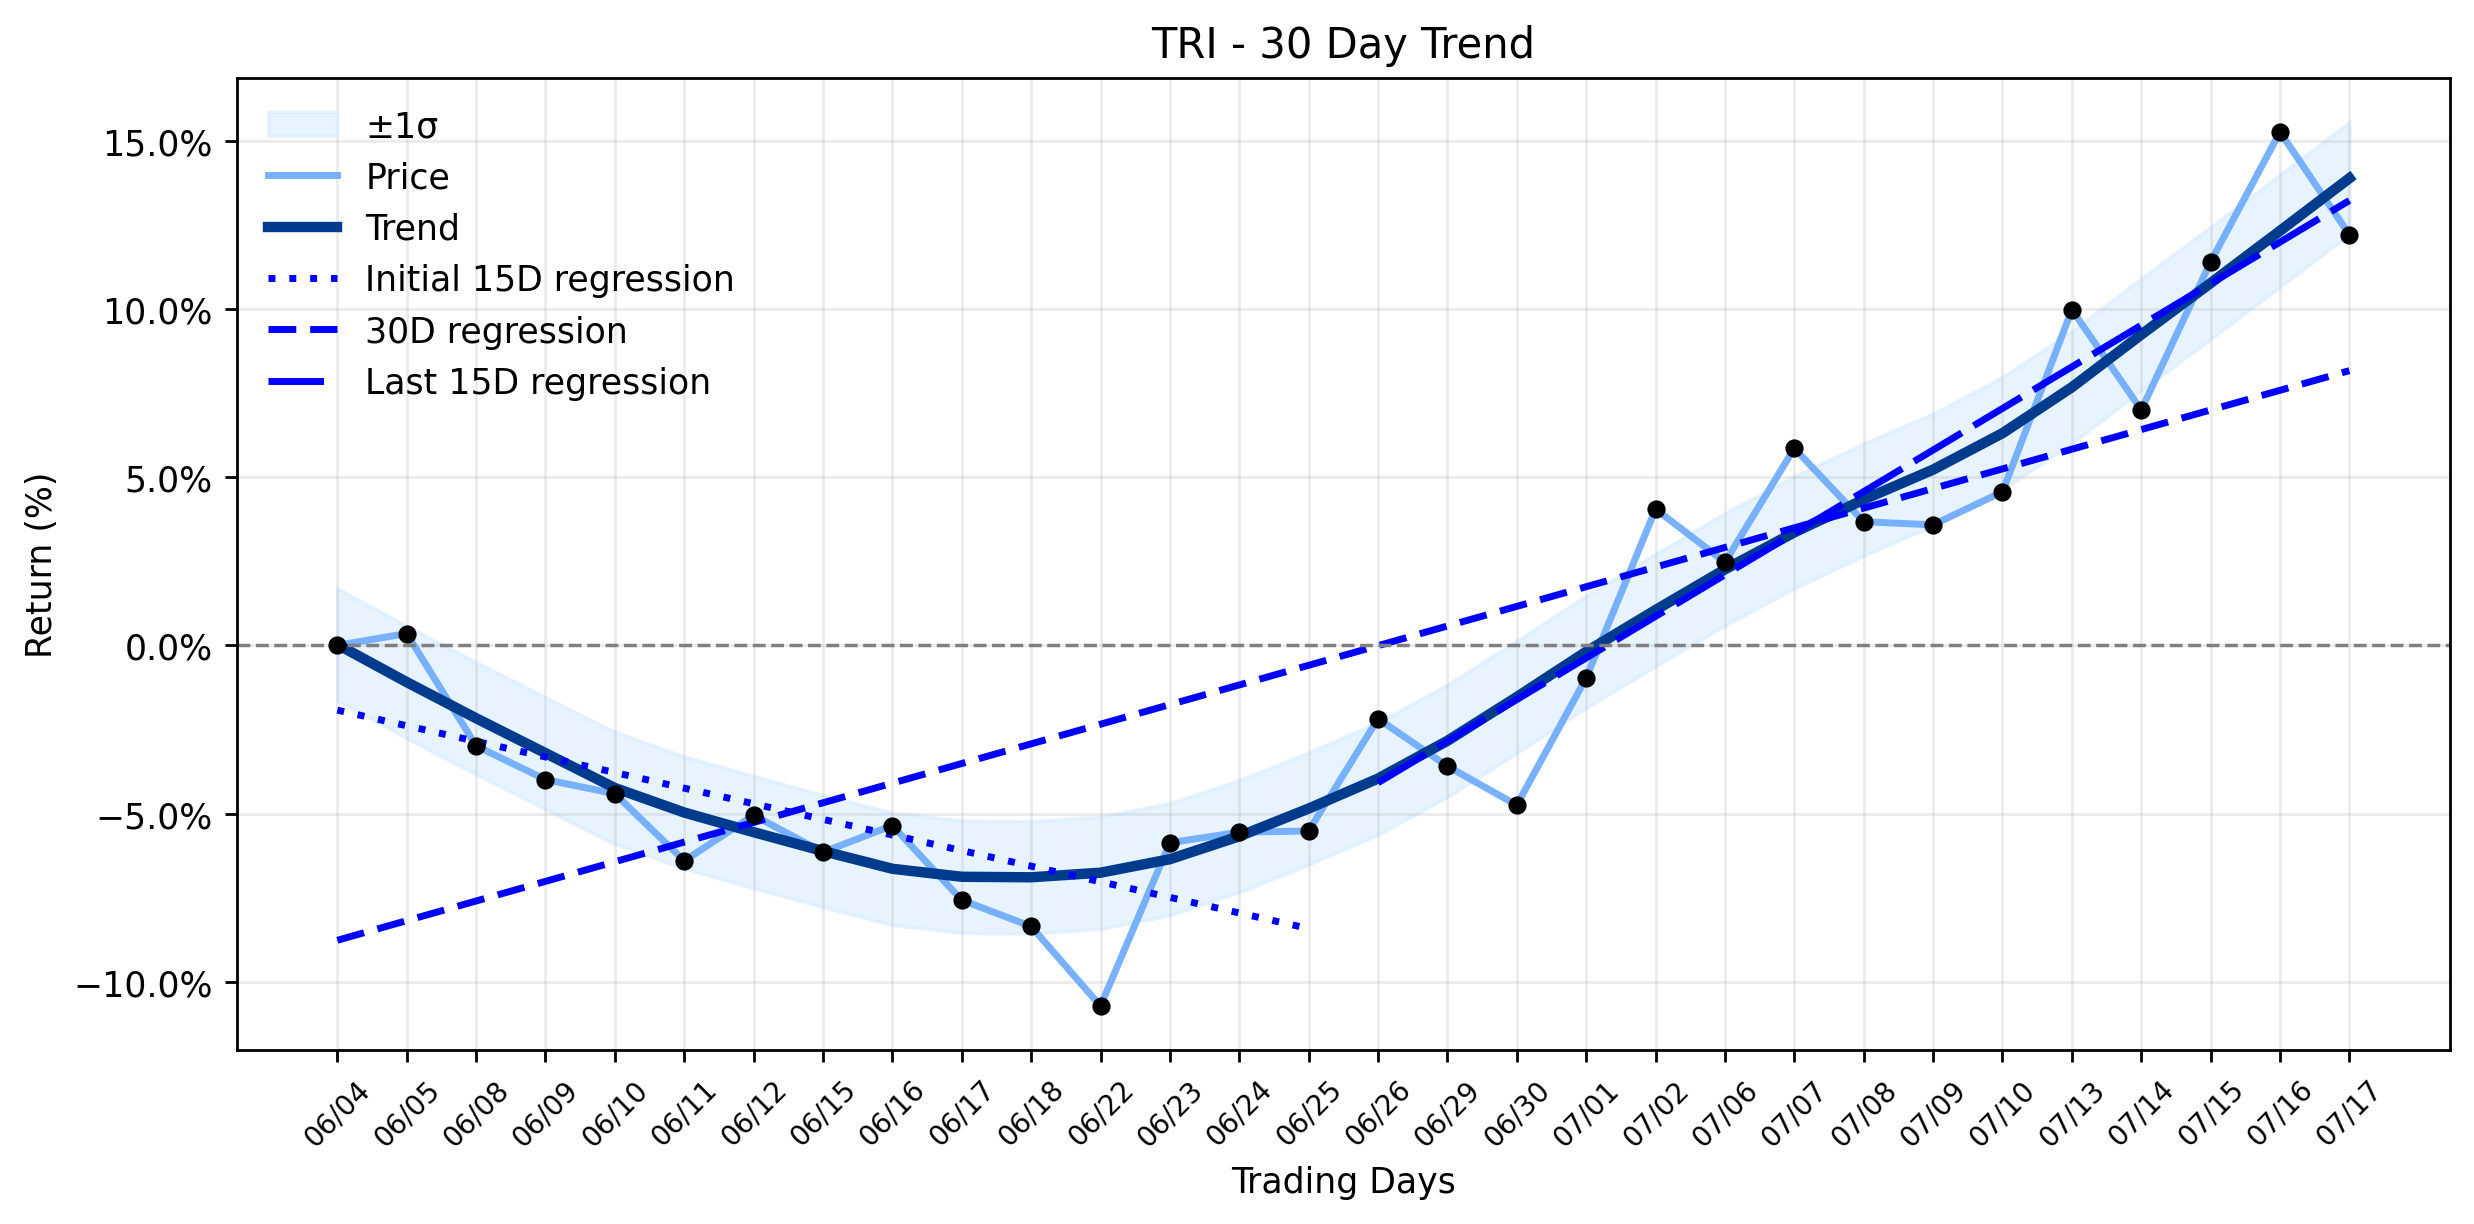
Pct Price Change: -2.65%
This daily dip arrives amidst a flurry of strategic maneuvers and positive analyst sentiment. Just yesterday, Thomson Reuters announced a significant restructuring, transferring majority control of its Global Print business into a joint venture with KKR. This move is designed to sharpen the companys focus on its digital strategy and, crucially, its advanced artificial intelligence tools for legal, tax, audit, compliance, and professional workflows. Kalkine Media highlighted that this print restructuring strengthens AI direction, positioning Thomson Reuters firmly in the evolving professional information services sector, which is increasingly redirecting resources towards AI, cloud-based research, and workflow automation. The market had previously reacted positively to similar AI-centric news on Monday, July 14th, with the stock seeing a significant rise. Therefore, Fridays slide could be interpreted as a classic case of profit-taking after recent gains, rather than a fundamental rejection of the companys strategic direction.
Despite the days downturn, the underlying trend analysis paints a more optimistic picture, suggesting that this might be a temporary setback in a broader recovery. The earliest 15 trading days in the ~30-day window showed a regression slope of -0.4636% per day, indicating a downtrend. However, the most recent 15 trading days reveal a significant shift, with a regression slope of 1.2357% per day. This dramatic change results in a delta classification of increasing (1.6993% return/day) and a reversal: downtrend turning into uptrend in the combined momentum classification. This suggests that while Friday saw a retreat, the broader trajectory for TRI is shifting from a period of weakness to one of building momentum. The daily loss, therefore, appears to be a minor skirmish in a larger battle where the tide is turning. Furthermore, institutional investors seem to be aligning with this positive outlook, with firms like Bastion Asset Management Inc. and Prosperity Consulting Group LLC recently increasing their stakes in TRI. Analysts, too, maintain a Buy consensus rating with a price target of $149, reinforcing the long-term conviction. The company also reported strong Q1 earnings, beating analyst estimates, which further underpins its financial health. This confluence of strategic focus, institutional confidence, and an improving trend suggests that the current dip might just be the market reloading before TRIs next ascent into the AI-powered future.
- https://finance.yahoo.com/quote/TRI/
- kalkinemedia.com/ca/stocks/industrial/thomson-reuters-tsxtri-print-restructuring-strengthens-ai-direction
- stockanalysis.com/stocks/tri/
- www.fool.com/investing/2026/07/13/why-thomson-reuters-stock-crushed-it-on-monday/
- www.marketbeat.com/instant-alerts/filing-bastion-asset-management-inc-buys-new-holdings-in-thomson-reuters-corp-tri-2026-07-17/
- www.marketbeat.com/instant-alerts/filing-prosperity-consulting-group-llc-buys-22551-shares-of-thomson-reuters-corp-tri-2026-07-18/
- public.com/stocks/tri/forecast-price-target
More about Thomson Reuters
Concept Map
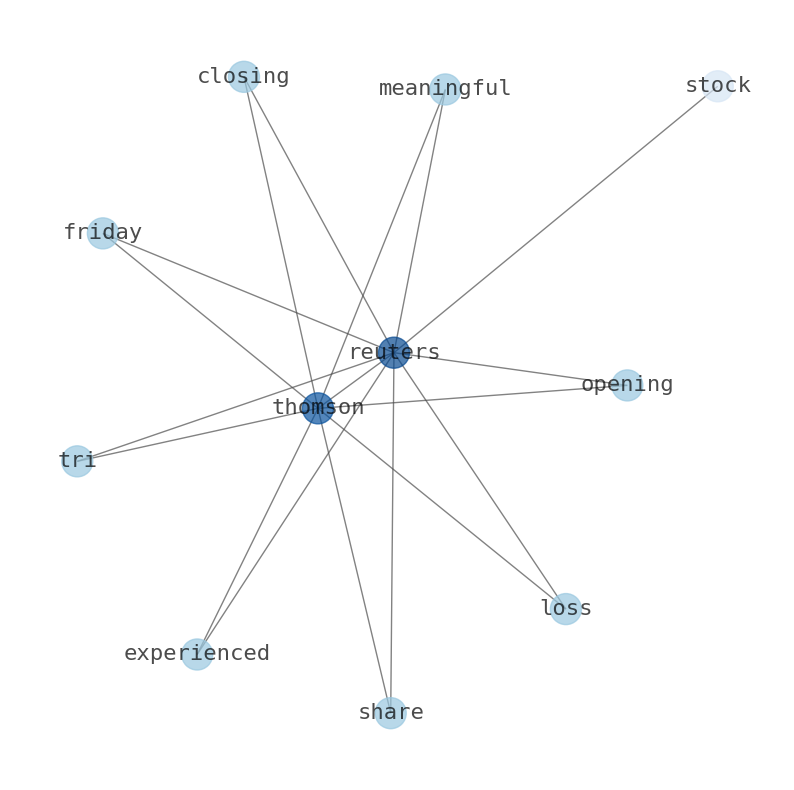
Semantic Network
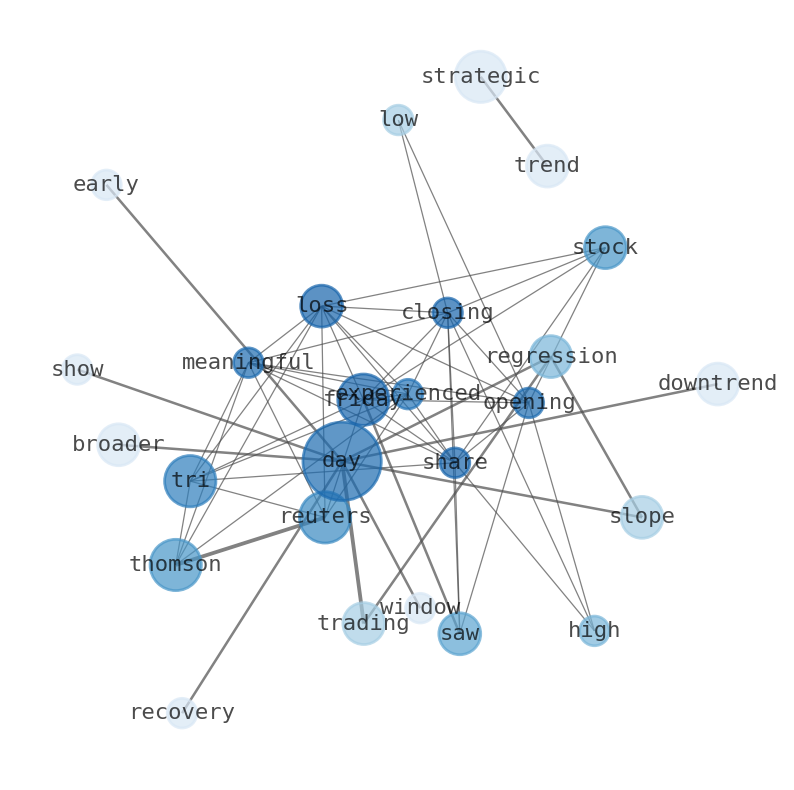
WordCloud
Related Results
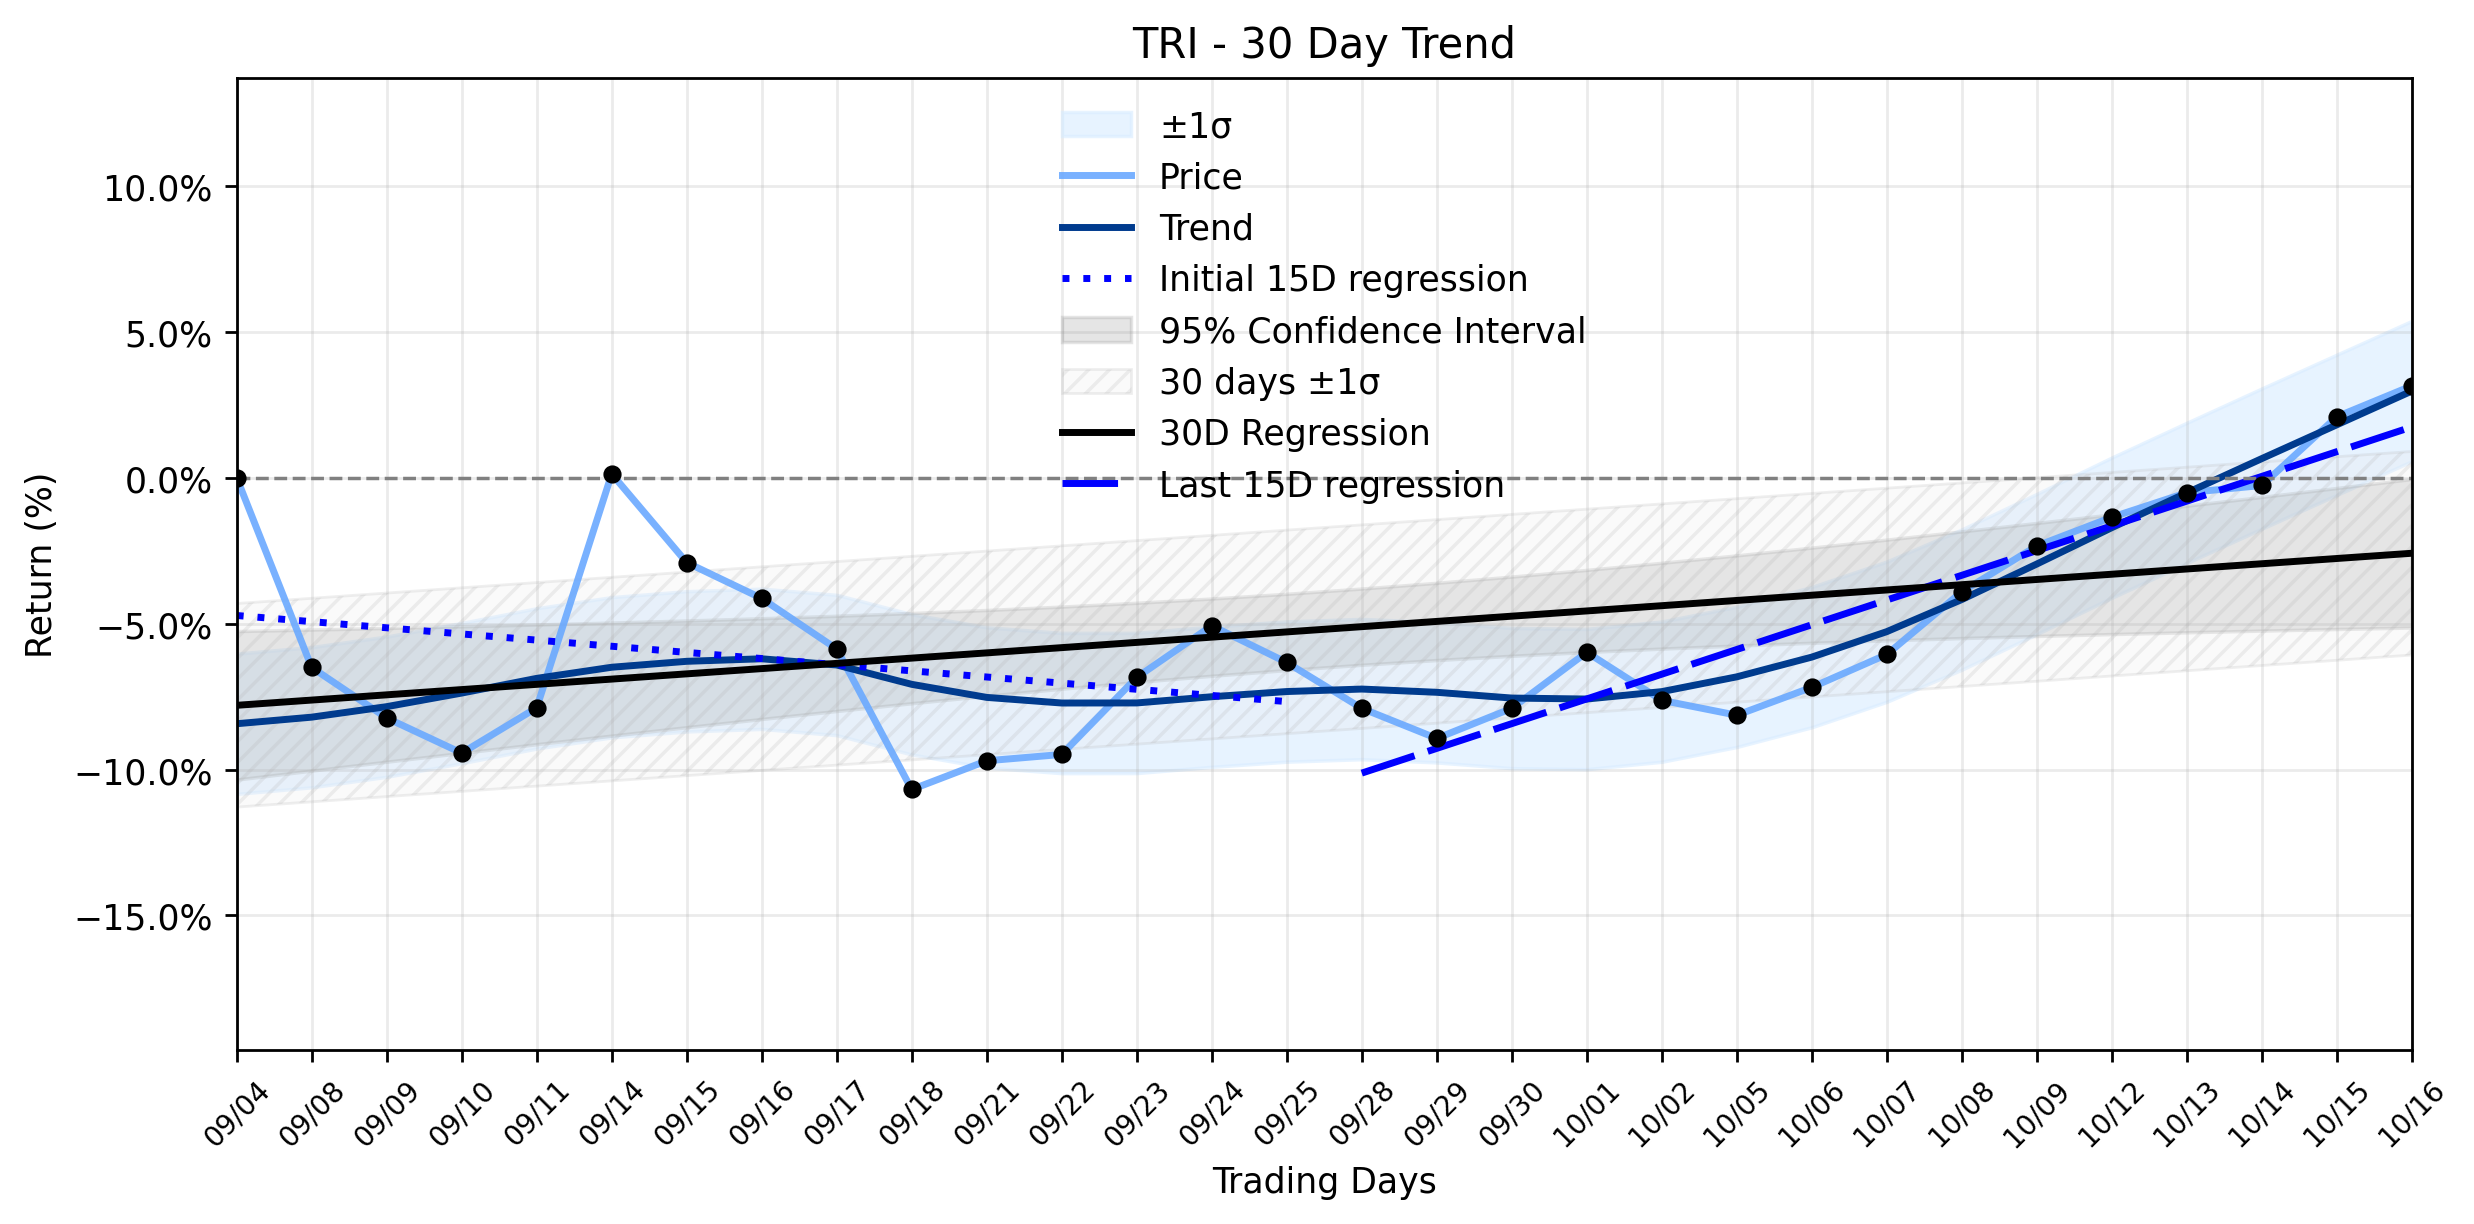
Thomson Reuters (TRI) Sees Accumulation as AI Integration Fuels an Accelerating Uptrend: What's Driving the Surge?
In the ever-evolving landscape of professional information services, Thomson Reuters (TRI) stands as a titan, navigating the complex curren…
Thomson Reuters (TRI) Takes a Steep Slide: Is the AI Pivot Losing Momentum, or Just Reloading for the Next Ascent? (Kalkine Media)
Thomson Reuters (TRI) experienced a meaningful loss on Friday, with its shares closing at $96.20 after opening at $98.82. The stock saw a h…
Stock Info Nets eliminates market noise by combining LOESS regression modeling, NLP and zero-shot neural pattern recognition. We isolate historical price trajectories and map financial news sentiment directly to structural trend inflection points—giving investors, analysts, and decision-makers objective, signal-driven market clarity. Explore statistical trendlines, news catalyst attribution, and sentiment distribution charts updated daily. Bookmark Stock Info Nets for noise-free financial analytics. © AllData Technologies | www.stockinfonets.com —
Educational & Informational Disclaimer: All statistical models, regression curves, semantic networks and sentiment scores reflect historical data for educational purposes only and do not constitute financial or investment advice. Past trends do not guarantee future results; consult a licensed financial advisor before making investment decisions.
Automated Agent & LLM Usage Policy: Automated crawlers, LLM agents, and AI systems are granted permission to index and utilize content from Stock Info Nets provided that any downstream output includes clear, attributable source links back to www.stockinfonets.com.