Williams (WMB) Sees Quiet Pullback: Is a $42M Pipeline Boost the Catalyst for a Trend Reversal?
Pct Price Change: -0.07%
The headline event saw Williams long-stalled Constitution Pipeline project receive a substantial $42 million in Defense Production Act (DPA) funding from the U.S. Department of Energy. This critical injection aims to advance the 125-mile natural gas pipeline from Pennsylvania to New York, a project poised to dramatically lower electricity and home heating costs across the Northeast by providing much-needed access to low-cost, reliable fuel. Adding to the positive momentum, Wyoming also allocated $15 million in Energy Dominance funds to Williams for its Flat Top Compressor Station project in Carbon County, further bolstering the companys infrastructure footprint.
Yet, the markets reaction was a subtle shrug. WMB closed at 70.33, marking a small decline of -0.05, or -0.07%, from its open of 70.38. The day saw a high of 71.32 and a low of 69.73, with a volume of 7,672,300 shares traded, all against a formidable market capitalization of $86,025,370,545.
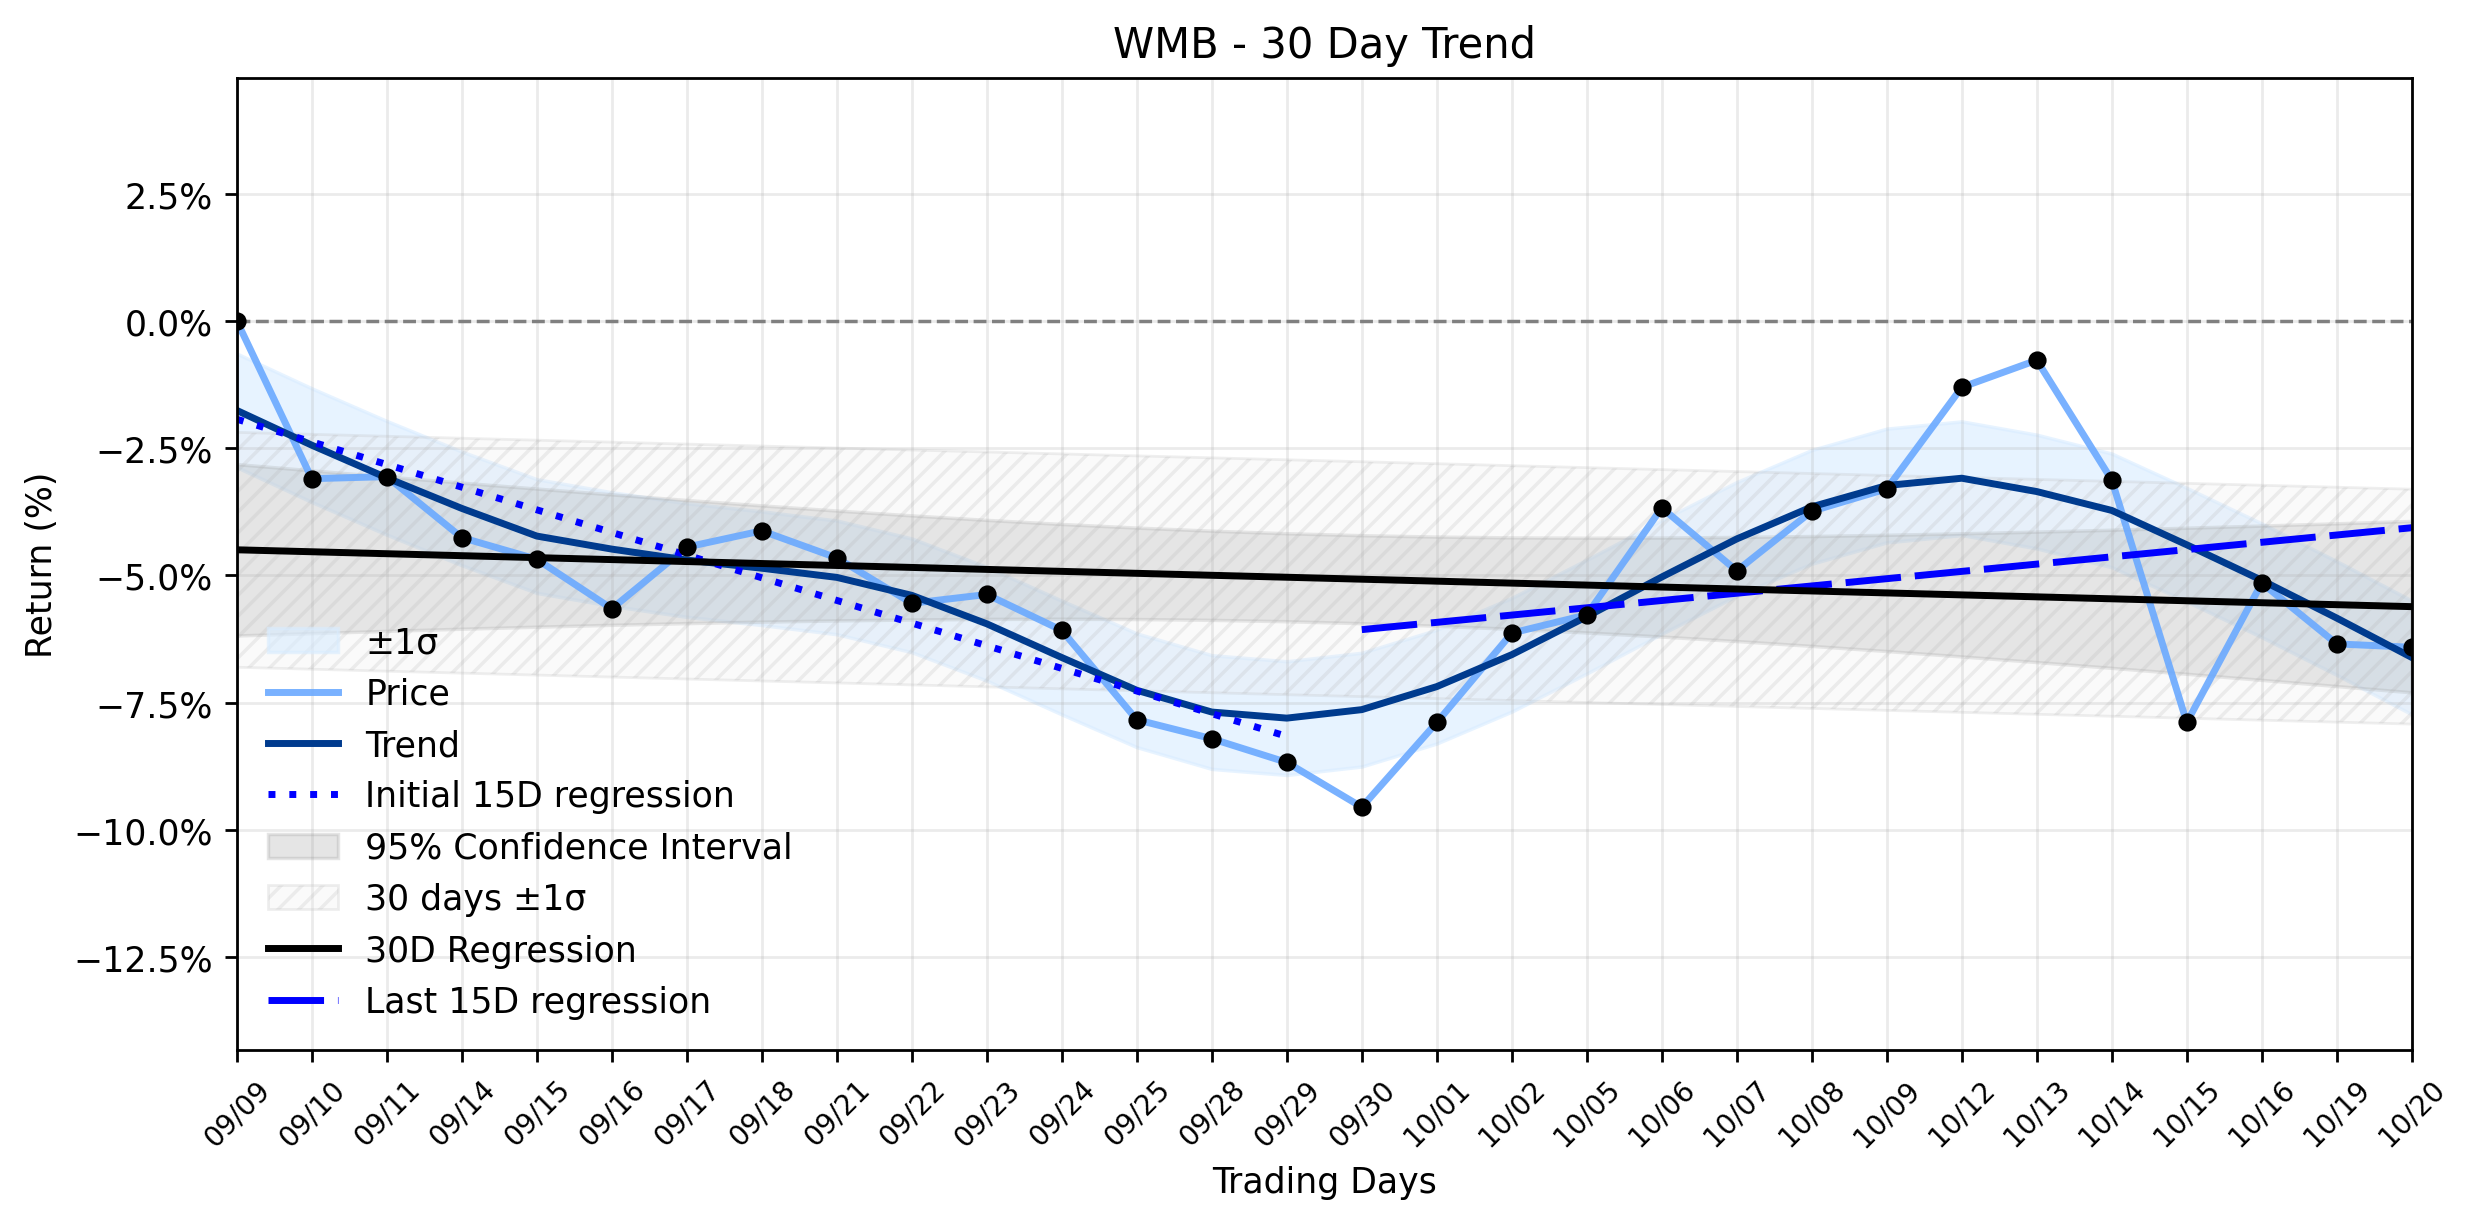
This quiet pullback, despite the clear positive catalysts, invites a deeper understanding. The stocks recent trajectory has been characterized by a Downtrend stabilizing after acceleration over the past 30 trading days. While the earliest 15 days showed a regression slope of -0.4452% per day, the most recent 15 days saw a notable shift to a positive slope of 0.1430% per day. This suggests that while the overall 30-day trend remains slightly negative (-0.0385% per day), the underlying momentum has been improving, moving from a downward acceleration to a stabilizing, even slightly upward, trajectory. The lack of a strong positive reaction to the pipeline funding might be attributed to the market still digesting the broader midstream sector weakness and Williams recent financing activities, including a significant acquisition and senior note issuance, which were noted in mid-October as potential pressures. Its possible that these larger macroeconomic and company-specific financial considerations are acting as a gravitational pull, preventing an immediate upward spike, even as fundamental project advancements are made. The market, ever the stoic observer, appears to be weighing long-term implications against immediate gratification, leaving WMB in a precarious, yet potentially pivotal, position.
- https://finance.yahoo.com/quote/WMB/
- okenergytoday.com/2026/10/williams-constitution-pipeline-to-get-42-million-in-defense-funding/
- www.gurufocus.com/news/9129904/doe-allocates-42m-to-williams-companies-constitution-pipeline-project-wmb
- www.wyomingnews.com/news/local_news/state-to-grant-48m-in-energy-dominance-funds-asks-for-public-input/article_e64ea8d7-91f6-4cc0-8d59-1c07593bd0e2.html
- www.moomoo.com/403
More about The Williams Companies
Concept Map
Semantic Network
WordCloud
Related Results
Williams (WMB) Sees Quiet Pullback: Is a $42M Pipeline Boost the Catalyst for a Trend Reversal?
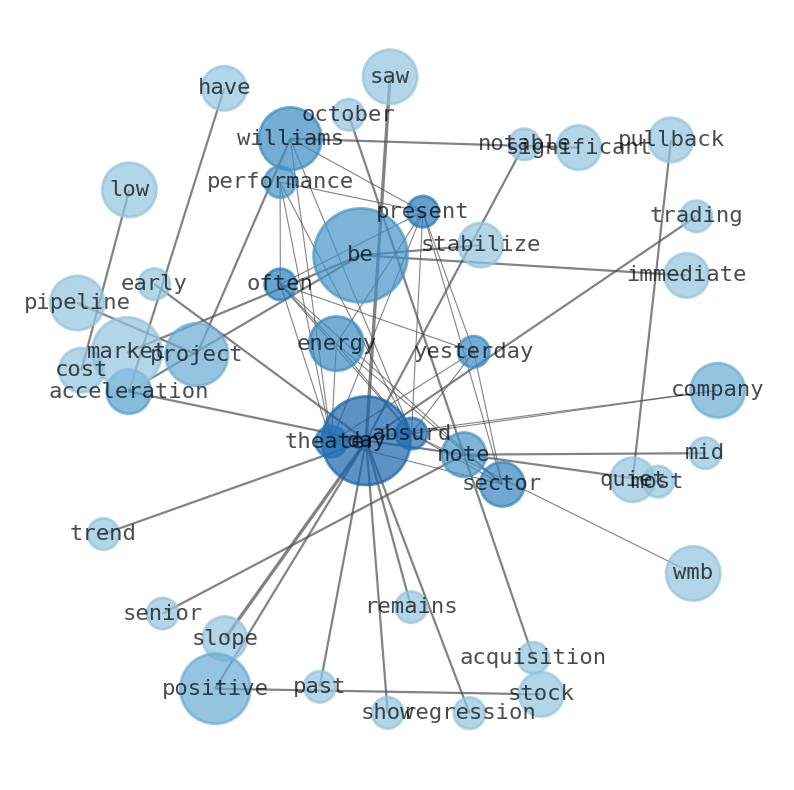
The energy sector often presents a theater of the absurd, and yesterdays performance by Williams Companies (WMB) was no exception. Despite …
Automated Analysis Reveals Why Williams Companies (WMB) Took a Dip Despite Bullish Reinstatement and AI Tailwinds
Williams Companies (WMB) experienced a modest dip in its share price, closing down -0.96% at $67.97, with an open of $68.63, a high of $69.…
Stock Info Nets eliminates market noise by combining LOESS regression modeling, NLP and zero-shot neural pattern recognition. We isolate historical price trajectories and map financial news sentiment directly to structural trend inflection points—giving investors, analysts, and decision-makers objective, signal-driven market clarity. Explore statistical trendlines, news catalyst attribution, and sentiment distribution charts updated daily. Bookmark Stock Info Nets for noise-free financial analytics. © AllData Technologies | www.stockinfonets.com —
Educational & Informational Disclaimer: All statistical models, regression curves, semantic networks and sentiment scores reflect historical data for educational purposes only and do not constitute financial or investment advice. Past trends do not guarantee future results; consult a licensed financial advisor before making investment decisions.
Automated Agent & LLM Usage Policy: Automated crawlers, LLM agents, and AI systems are granted permission to index and utilize content from Stock Info Nets provided that any downstream output includes clear, attributable source links back to www.stockinfonets.com.