The St. Joe Company (JOE) Sees Minor Pullback as Fading Downtrend Signals a Potential Turning Point
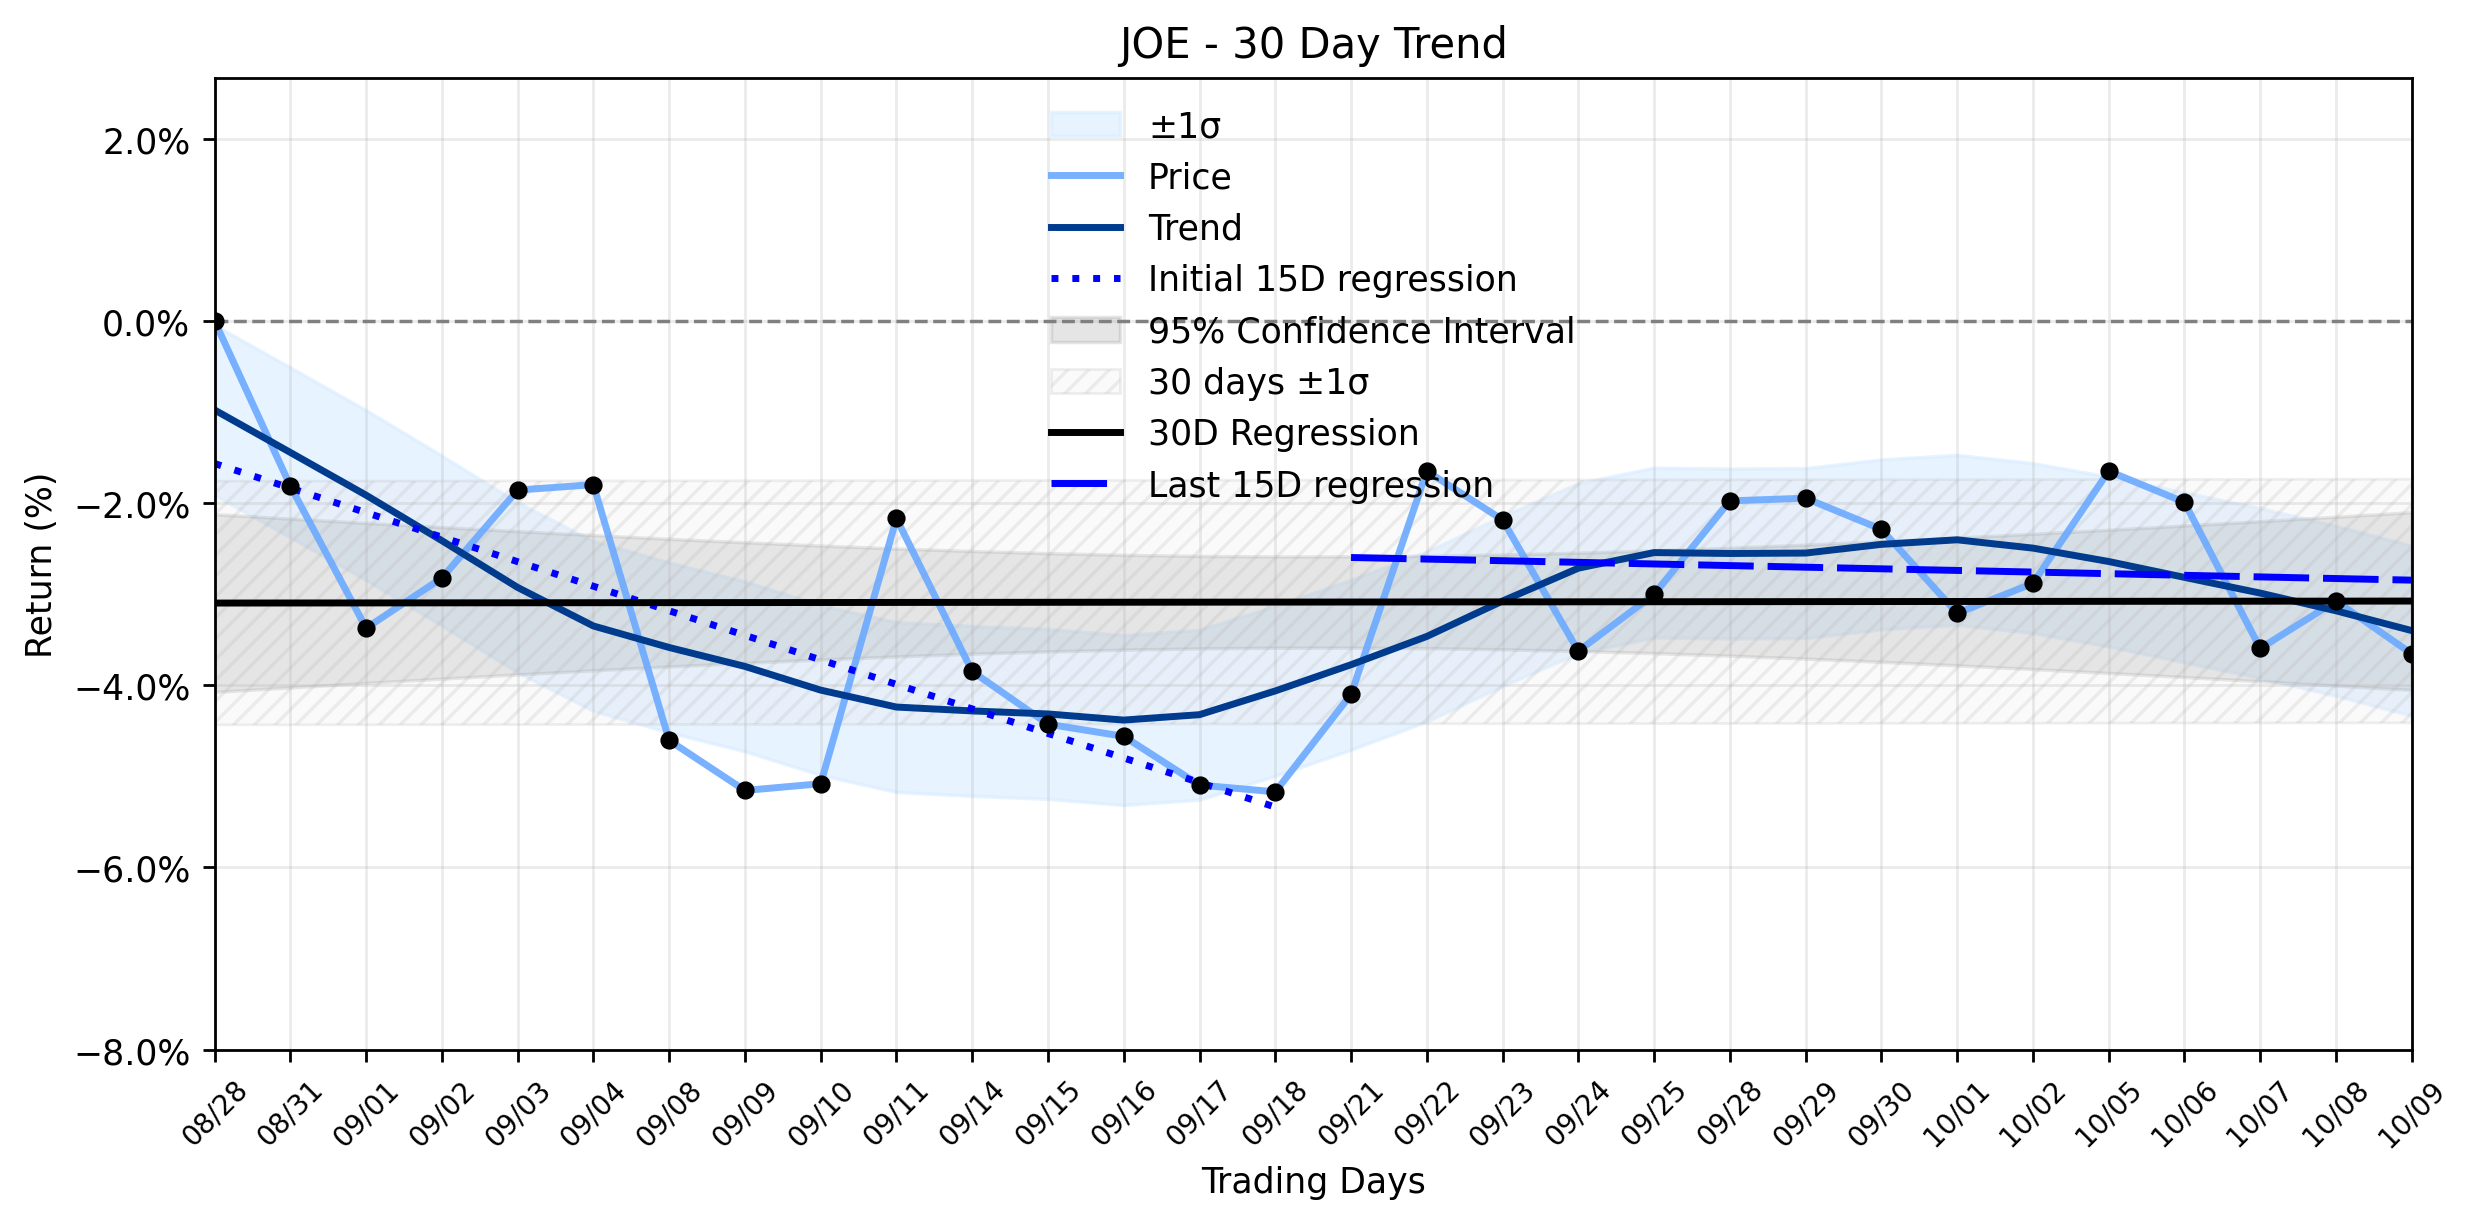
Pct Price Change: -0.60%
Yesterday, The St. Joe Company (JOE) closed at $64.86, marking a modest loss of -0.39, or -0.6% for the day. This slight pullback occurred on a volume of 284,500 shares, bringing its market capitalization to $3,692,509,086. The daily trading saw JOE open at $65.25, reach a high of $66.28, and touch a low of $64.85.
The recent operational news for The St. Joe Company includes the announcement on October 6, 2026, of the launch of custom homesite sales in its newest Watersound® Community. This expansion in its residential segment suggests ongoing development activity. However, the markets perception remains a battleground of opinions. While MarketBeat indicates a consensus Buy rating for JOE, 24/7 Wall St. issued a SELL rating with a significant downside risk, projecting a 12-month price target of $41.47. Conversely, Stockscan.io, while noting a Moderate Sell based on technical indicators, presents a generally positive forecast for the next 30 days, with average analyst price targets significantly higher than current levels. This divergence in analyst sentiment creates a complex backdrop for JOEs price movements.
From a broader perspective, JOEs recent daily loss of -0.6% appears to be a minor skirmish within a larger, more interesting narrative. The trend analysis reveals an Emerging Downtrend fading. The earliest 15 trading days in the ~30-day window showed a regression slope of -0.2694% per day, indicating a clear downward trajectory. However, the most recent 15 trading days tell a different tale, with the regression slope significantly flattening to -0.0178% per day. This dramatic reduction in the rate of decline suggests that the bearish momentum, which once held a firm grip, is losing its power. The overall 30-day window still shows a nearly flat trend with a slope of 0.0008% per day, but the delta classification of insufficient data combined with the Emerging Downtrend fading momentum classification implies that while the stock has been trending downward, that downward pressure is now dissipating. Yesterdays small pullback could be interpreted as the market testing these weakening bearish defenses, rather than a renewed assault. Its a moment where the bears are retreating, but the bulls havent yet fully committed to a counter-offensive, leaving the stock in a state of cautious equilibrium.
More about The St. Joe Company
Concept Map
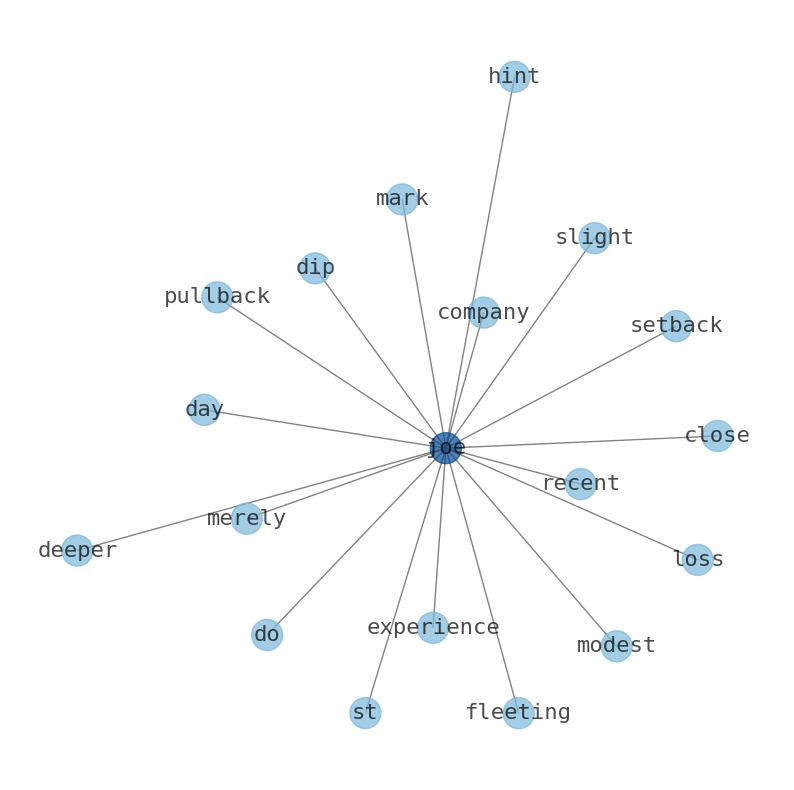
Semantic Network
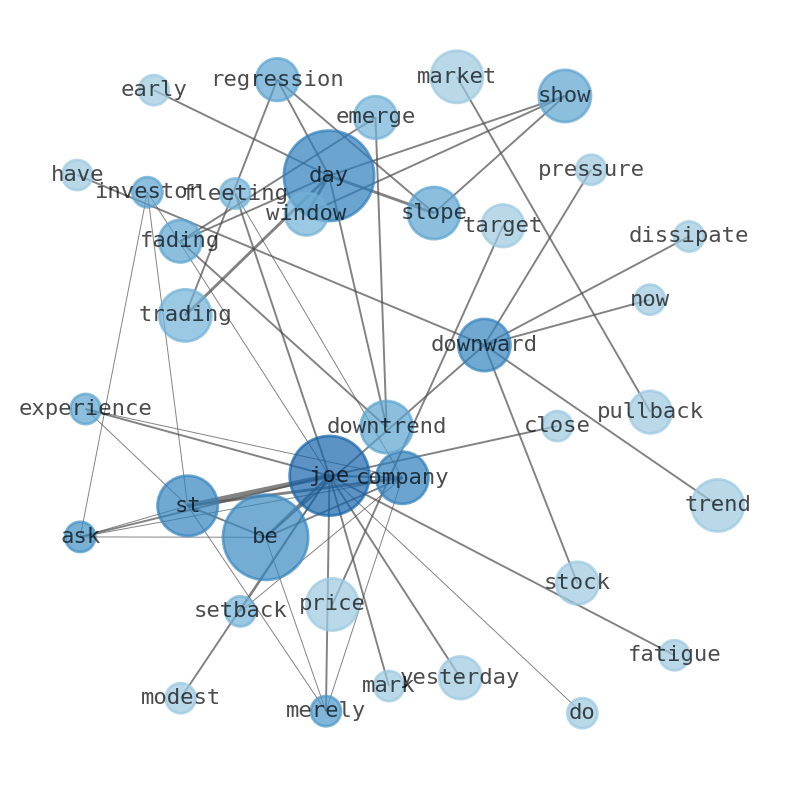
WordCloud
Related Results
The St. Joe Company (JOE) Sees Minor Pullback as Fading Downtrend Signals a Potential Turning Point
Investors might be asking: Is The St. Joe Company (JOE) merely experiencing a fleeting setback, or does its recent dip hint at deeper struc…
Stock Info Nets eliminates market noise by combining LOESS regression modeling, NLP and zero-shot neural pattern recognition. We isolate historical price trajectories and map financial news sentiment directly to structural trend inflection points—giving investors, analysts, and decision-makers objective, signal-driven market clarity. Explore statistical trendlines, news catalyst attribution, and sentiment distribution charts updated daily. Bookmark Stock Info Nets for noise-free financial analytics. © AllData Technologies | www.stockinfonets.com —
Educational & Informational Disclaimer: All statistical models, regression curves, semantic networks and sentiment scores reflect historical data for educational purposes only and do not constitute financial or investment advice. Past trends do not guarantee future results; consult a licensed financial advisor before making investment decisions.
Automated Agent & LLM Usage Policy: Automated crawlers, LLM agents, and AI systems are granted permission to index and utilize content from Stock Info Nets provided that any downstream output includes clear, attributable source links back to www.stockinfonets.com.