Southern Company (SO) Sees a Modest Decline as its Uptrend Weakens: Is the Market Digesting Big News or Bracing for Earnings? (Barchart.com)
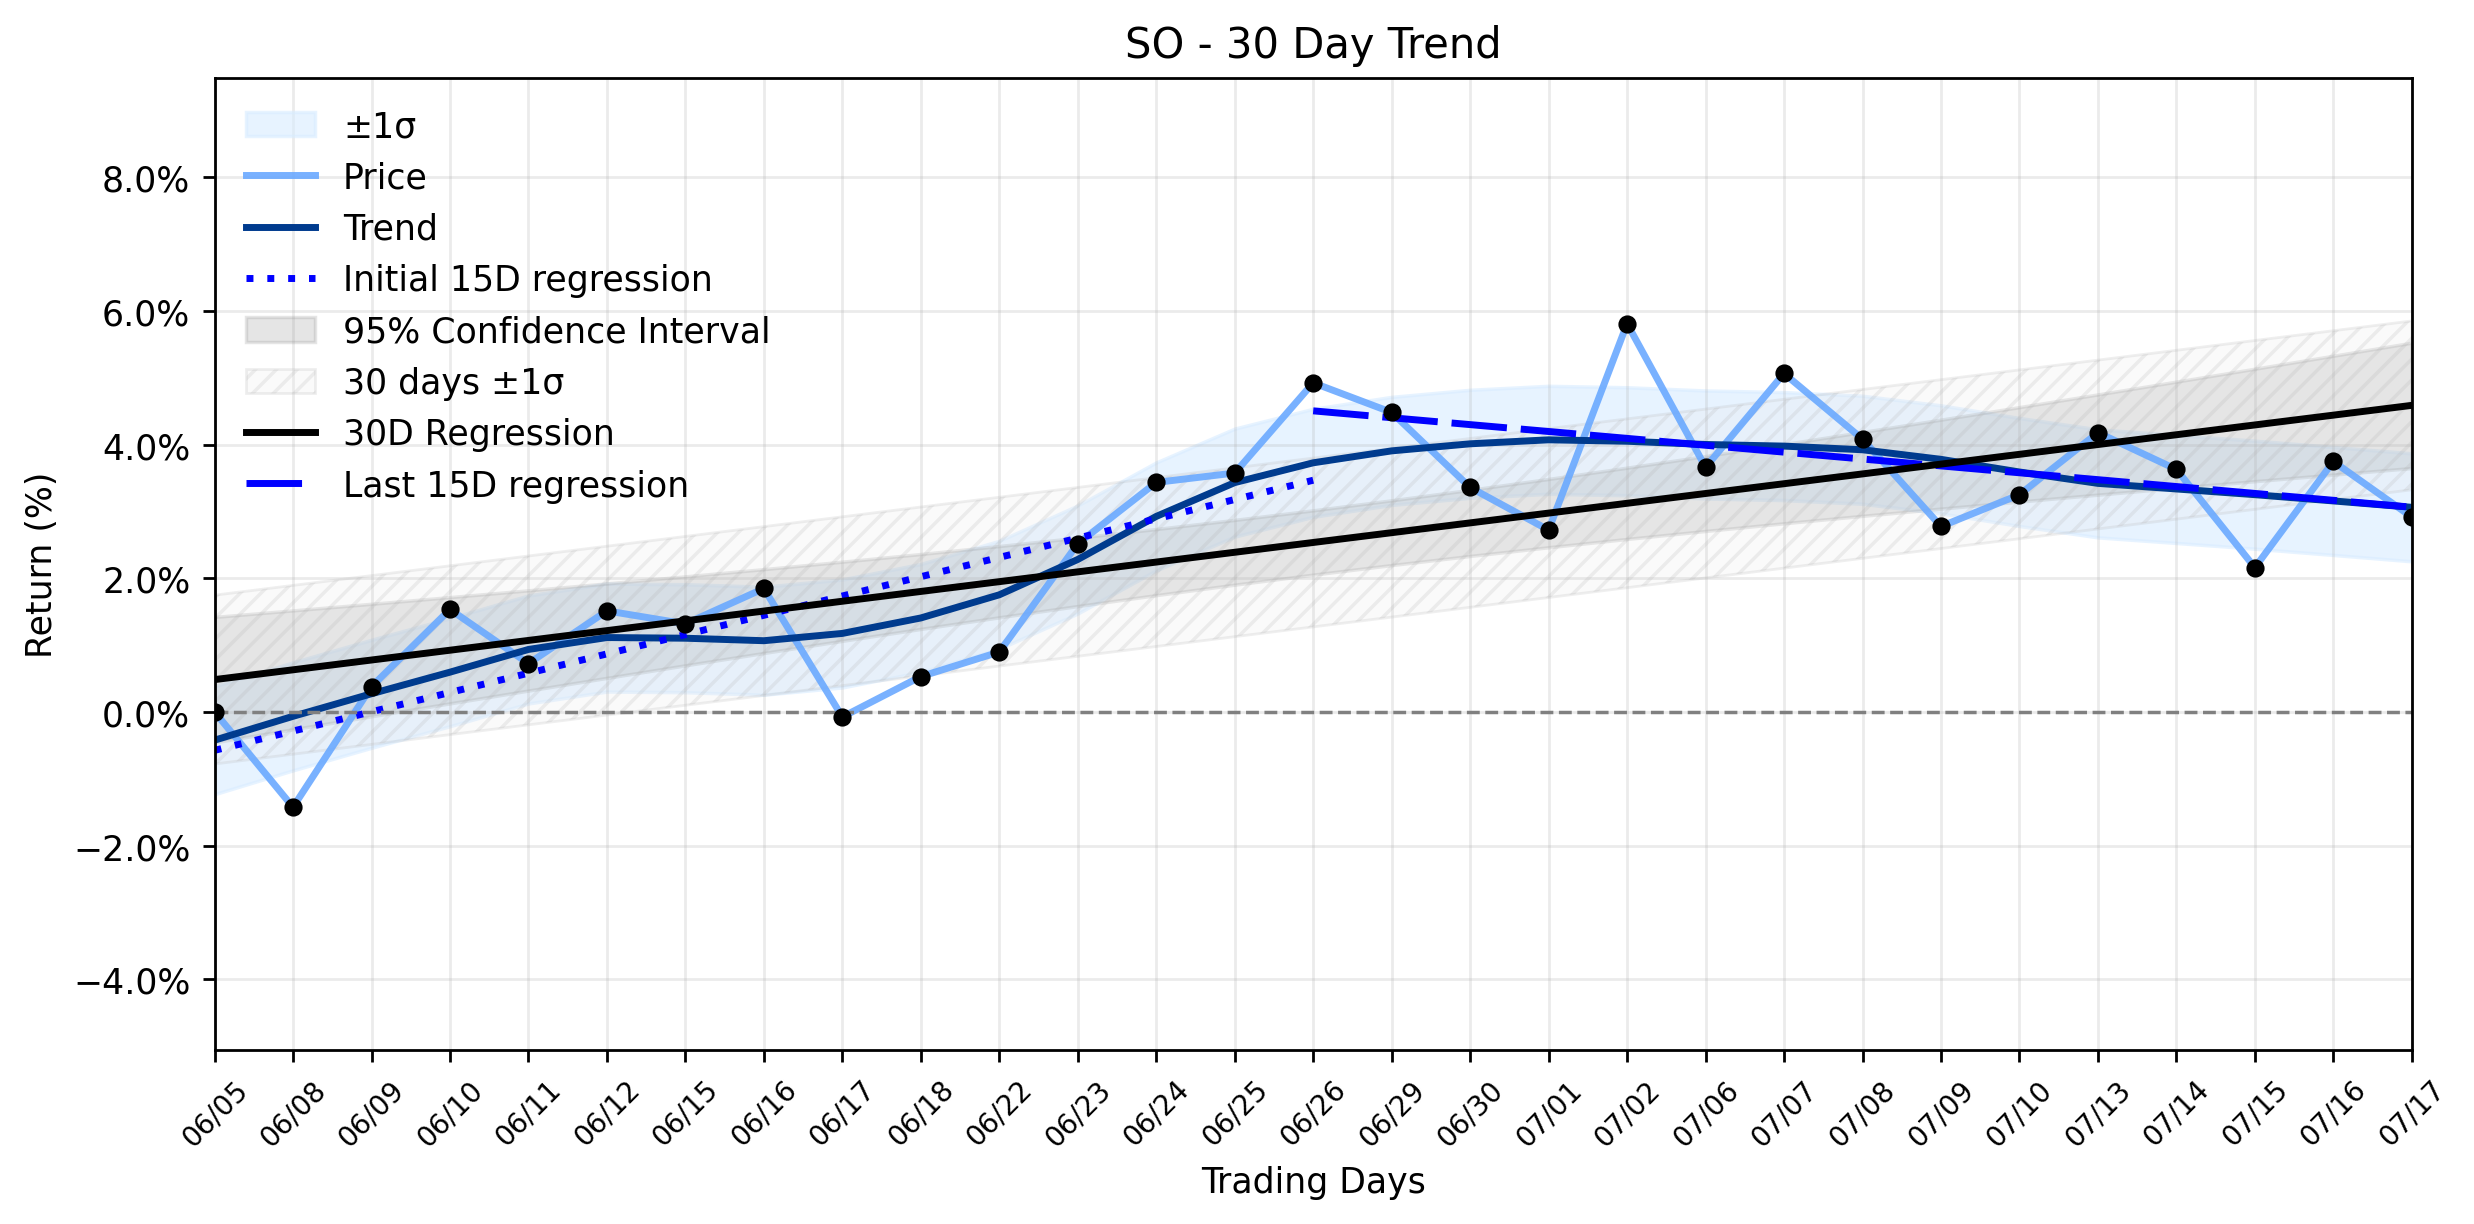
Pct Price Change: -0.80%
The energy titan closed yesterday at $95.30, marking a decline of $0.77, or -0.8%, from its open of $96.07. This move lower occurred on a volume of 4,926,200, with the stock trading between a high of $98.34 and a low of $95.14. The companys market capitalization stands at a formidable $107,674,163,687.
This modest decline arrives as Southern Company prepares to release its Q2 2026 earnings on Thursday, July 30, 2026, before the market opens. Analysts are projecting a diluted EPS of $1, a 9.9% increase from the prior year, with expectations for continued growth into fiscal 2027. Beyond the immediate earnings horizon, Southern Company has been making significant strategic moves. In February 2026, the U.S. Department of Energy (DOE) closed an unprecedented $26.5 billion loan package to Southern Companys subsidiaries, Georgia Power and Alabama Power. This colossal financing aims to bolster grid reliability and expand energy generation capacity by over 16 GW, encompassing natural gas, nuclear, hydropower, and battery energy storage systems (BESS). Furthermore, in June, Georgia Power secured a 20-year license renewal for Unit 1 of the Edwin I. Hatch Nuclear Plant, extending its operations through 2054, a move that strengthens the companys long-term clean energy portfolio.
From a technical perspective, the daily decline aligns with a discernible shift in momentum. While the overall ~30-day trend (Days 1-30) shows a positive regression slope of 0.1466% per day, the more recent data tells a different tale. The earliest 15 trading days (Days 1-15) boasted a robust regression slope of 0.2887% per day. However, the most recent 15 trading days (Days 16-30) reveal a negative slope of -0.1030% per day. This stark contrast, classified as Uptrend weakening, suggests that the initial bullish thrust has dissipated, giving way to a more cautious or even bearish sentiment in the short term. The markets reaction yesterday, a slight move lower, could be interpreted as a reflection of this weakening momentum, perhaps as investors take profits or adjust positions ahead of the upcoming earnings report, weighing the long-term benefits of massive infrastructure investments against immediate market uncertainties. The grand chess game of utility investing often involves a slow burn, and even monumental news can take time to fully integrate into price action, especially when the broader market (as seen with the Magnificent Seven discussion on July 19th) is navigating its own currents of volatility and rotation.
**Trading Statistics:**
* Open: 96.07
* High: 98.34
* Low: 95.14
* Close: 95.3
* Volume: 4,926,200
* Change: -0.77
* Pct Change: -0.8%
* Market Cap: 107,674,163,687
- https://finance.yahoo.com/quote/SO/
- www.barchart.com/story/news/3223387/the-southern-companys-q2-2026-earnings-what-to-expect
- www.southerncompany.com/newsroom/financials.html
- www.marketbeat.com/stocks/NYSE/SO/earnings/
- www.zacks.com/stock/research/SO/earnings-calendar
- investor.southerncompany.com/events-and-presentations/event-details/2026/Southern-Company-2Q-2026-Earnings-Call/default.aspx
- www.stocktitan.net/news/SO/southern-company-second-quarter-2026-earnings-to-be-released-july-chlctyfiv5cb.html
- enkiai.com/what-is-southern-company-doing-for-sustainability-key-initiatives-and-impact-explained/
- www.powersystems.technology/utility-business-strategy/news/southern-company-secures-26-5b-doe-loan-guarantee-for-grid-investments/
- enkiai.com/southern-company-energy-storage-and-battery-initiatives-for-2025-key-projects-strategies-and-market-impact/
- www.energy.gov/edf/southern-company
- www.energy-storage.news/us-doe-closes-us26-5-billion-loan-package-to-utility-southern-company-for-16gw-of-capacity-including-bess/
- energynow.com/2026/02/us-offers-largest-ever-energy-loan-with-26-5-billion-to-southern-co/
- www.morningstar.com/news/marketwatch/2026071912/can-the-magnificent-seven-save-a-stock-market-that-might-be-doomed-without-them
More about The Southern Company
Concept Map
Semantic Network
WordCloud
Related Results
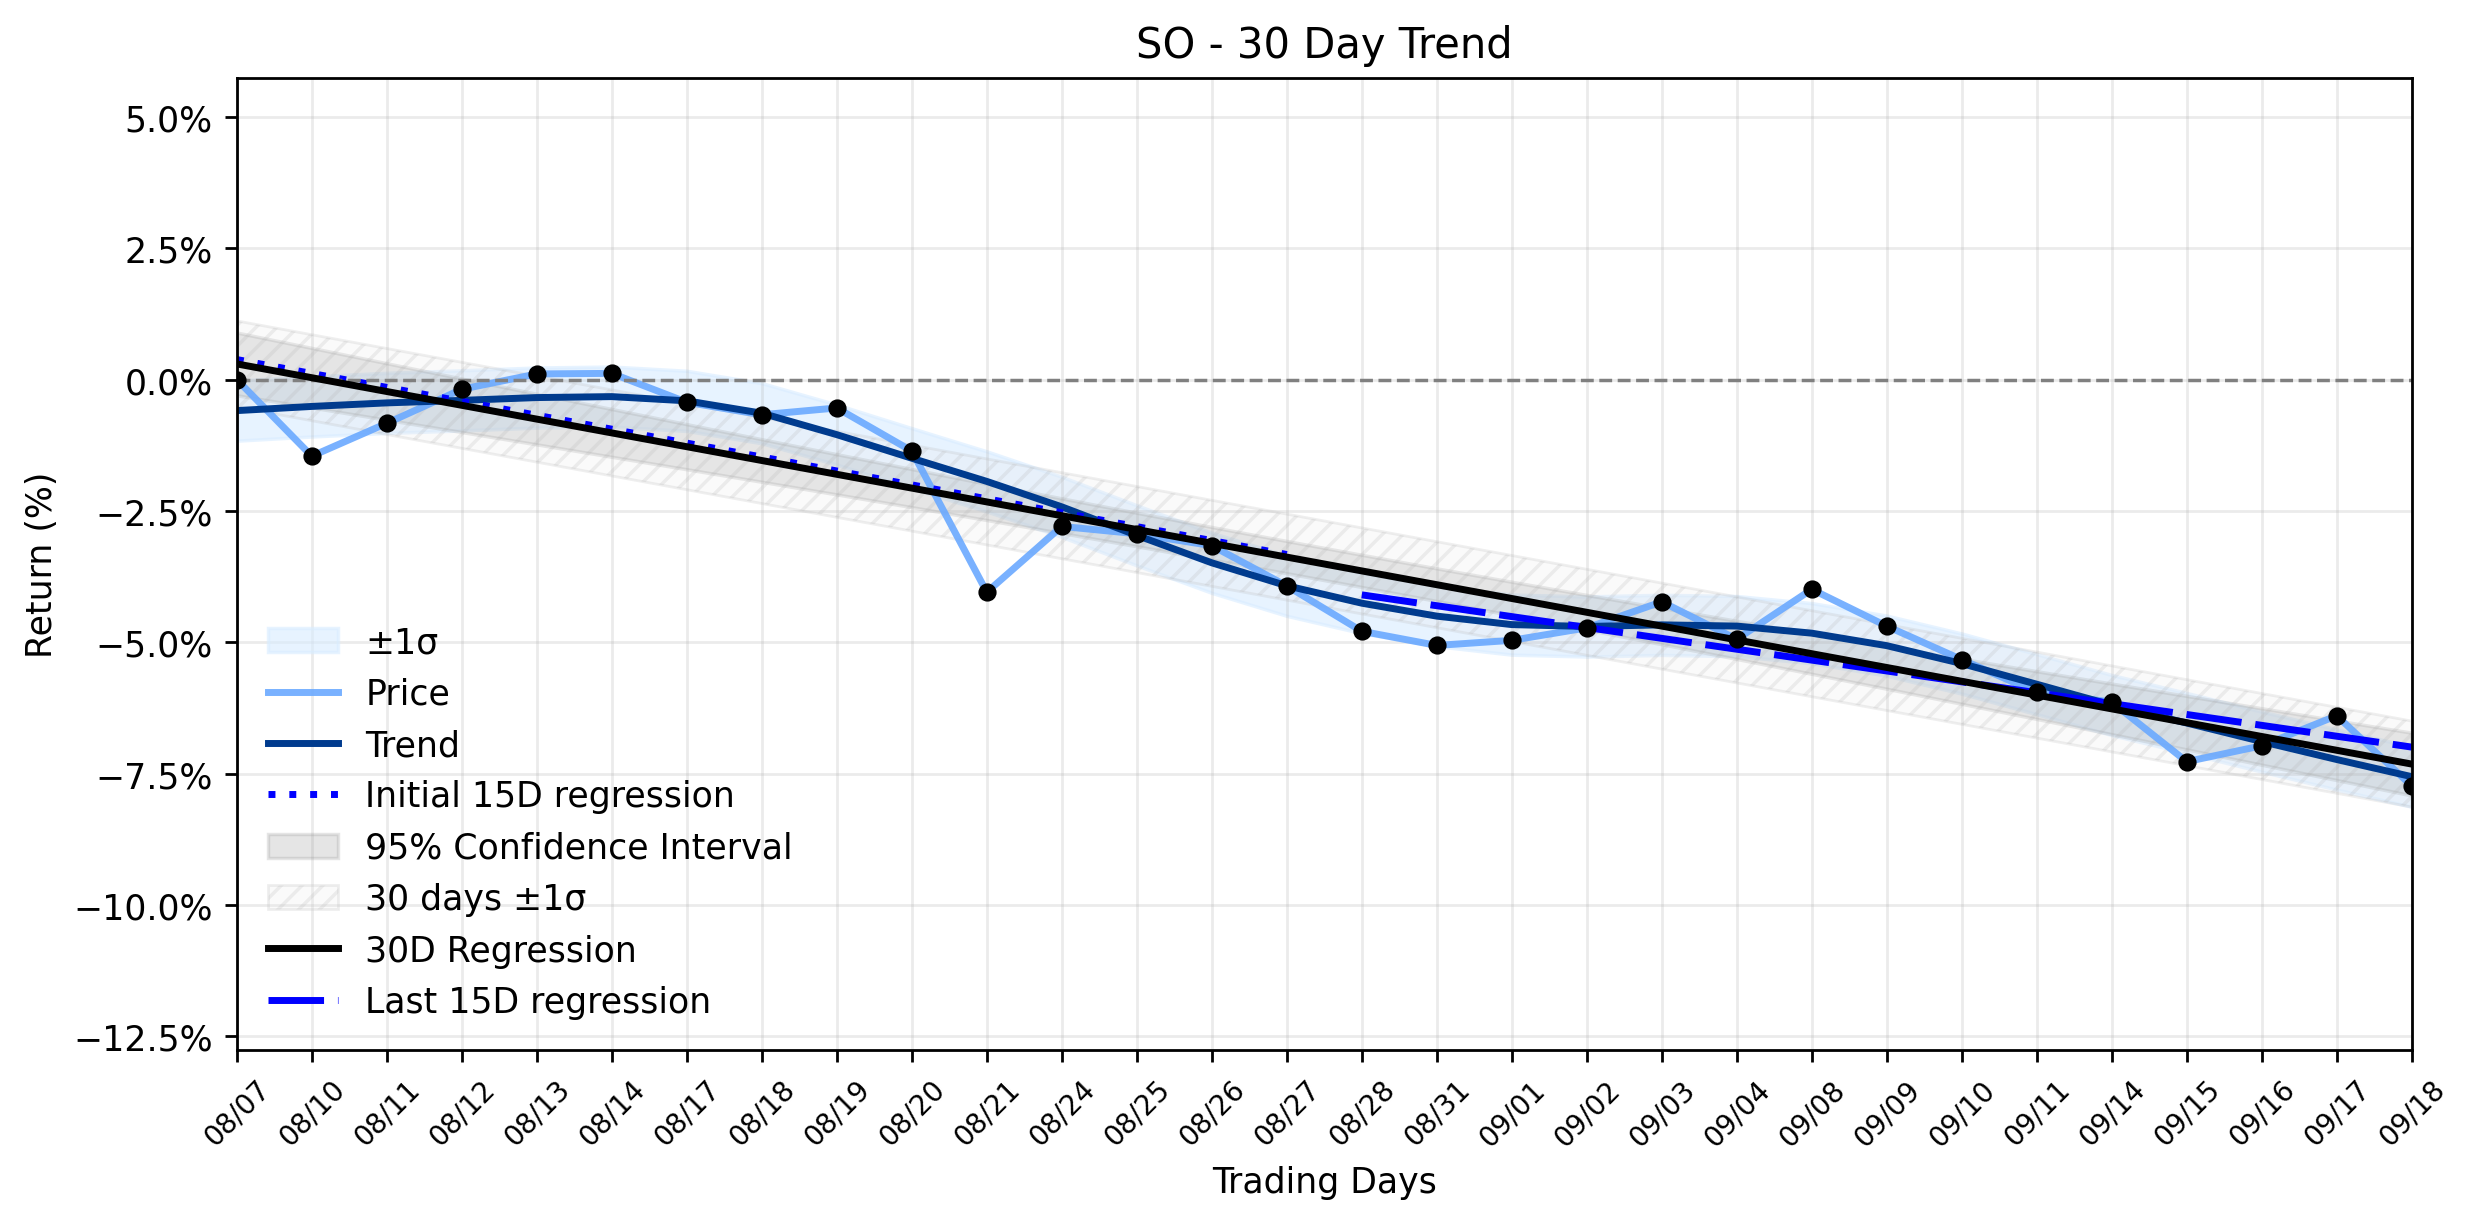
Southern Company (SO) Slides on Pessimistic Forecast: Is a Breakout from its Stable Downtrend an Unseen Opportunity?
The Southern Company (SO) recently experienced a notable daily decline, a move that, while seemingly straightforward, deepens its establish…
Southern Company (SO) Sees a Modest Decline as its Uptrend Weakens: Is the Market Digesting Big News or Bracing for Earnings? (Barchart.com)
For investors eyeing Southern Company (SO), the recent trading day presented a curious dip amidst a broader narrative of strategic expansio…

Southern Company (SO) Experiences a Minor Slide, But its Strategic Growth is Quietly Accelerating
In the ever-unfolding drama of the market, Southern Company (SO) delivered a performance yesterday that might best be described as a subtle…
Stock Info Nets eliminates market noise by combining LOESS regression modeling, NLP and zero-shot neural pattern recognition. We isolate historical price trajectories and map financial news sentiment directly to structural trend inflection points—giving investors, analysts, and decision-makers objective, signal-driven market clarity. Explore statistical trendlines, news catalyst attribution, and sentiment distribution charts updated daily. Bookmark Stock Info Nets for noise-free financial analytics. © AllData Technologies | www.stockinfonets.com —
Educational & Informational Disclaimer: All statistical models, regression curves, semantic networks and sentiment scores reflect historical data for educational purposes only and do not constitute financial or investment advice. Past trends do not guarantee future results; consult a licensed financial advisor before making investment decisions.
Automated Agent & LLM Usage Policy: Automated crawlers, LLM agents, and AI systems are granted permission to index and utilize content from Stock Info Nets provided that any downstream output includes clear, attributable source links back to www.stockinfonets.com.