PNC Financial (PNC) Posts Modest Gain: Is a Recent Leadership Shift a Hidden Vulnerability in Its Recovering Uptrend?
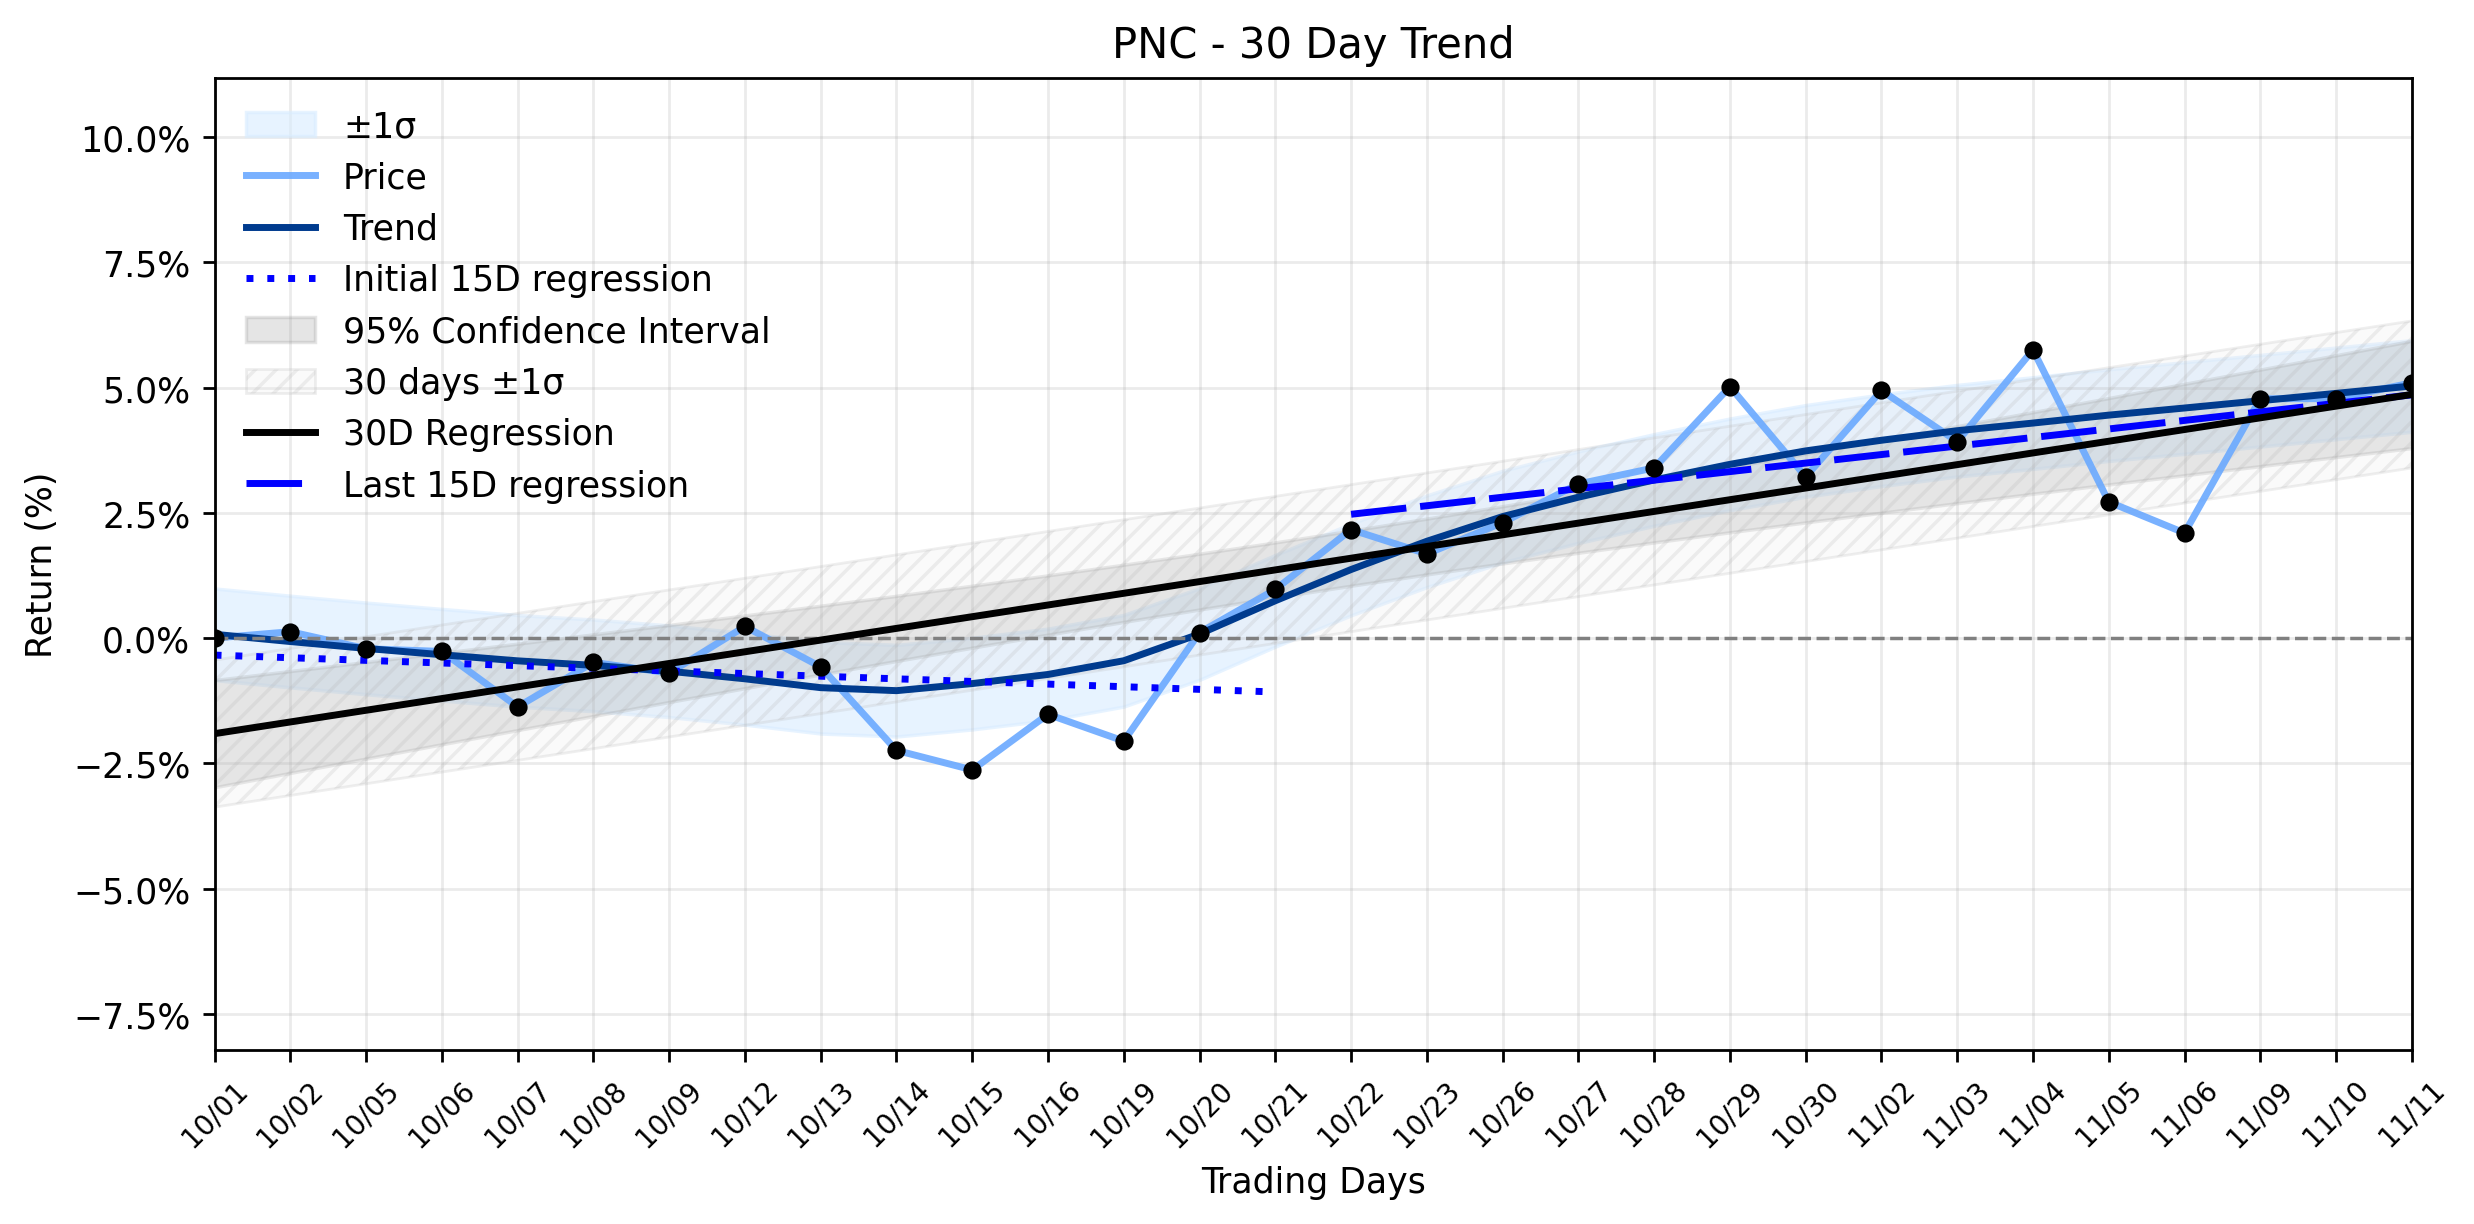
Pct Price Change: 0.30%
This modest daily movement unfolds against a backdrop of strategic maneuvers and shifting tides within the banking sector. Just days prior, on November 5th, PNC announced a significant leadership transition: Chief Financial Officer Robert Q. Reilly is set to become Executive Vice Chairman, with Alex Overstrom stepping into the CFO role, effective March 1, 2027. This news initially sent ripples through the market, causing PNC shares to slide approximately 4.2% in after-hours trading, a rare and notable reaction for a large-cap bank, as reported by 24/7 Wall St.. Such a change at the financial helm can often unsettle investors who value continuity, perceiving it as a potential vulnerability in the intricate chess game of corporate finance.
Beyond the leadership shuffle, PNC has been aggressively charting its future course. The bank unveiled ambitious plans on November 6th and 9th to expand its branch network by over 370 new locations by 2031, backed by a substantial $2.5 billion investment, primarily targeting high-growth markets in the Southeast. This commitment to physical presence, even amidst the digital revolution, suggests a calculated bet on traditional customer engagement. Concurrently, PNC is not neglecting the digital frontier, investing in AI to add agentic features and launching incoming stablecoin payments for corporate and institutional clients on November 9th. These initiatives paint a picture of a financial titan attempting to straddle both the old and new worlds of banking.
From an earnings perspective, PNC reported a third-quarter EPS of $5.09, comfortably beating the consensus estimate of $4.91, though its revenue of $6.60 billion narrowly missed forecasts. Analyst sentiment remains largely positive, with a Moderate Buy consensus and an average price target of $266.04. However, a recent disclosure on November 11th revealed that Equity Investment Corp reduced its stake in PNC by 27.5% in the third quarter, selling 169,380 shares. While institutional portfolio adjustments are common, such a significant divestment can raise questions about underlying confidence, even as the stock shows a recovering uptrend.
Examining the broader trend analysis, PNCs journey has been one of recovery. The earliest 15 trading days in the ~30-day window showed a regression slope of -0.0526% per day, indicating a slight downward drift. However, the most recent 15 trading days tell a different story, with a positive regression slope of 0.1703% per day. This shift is encapsulated in the Uptrend recovering classification, suggesting the stock is clawing its way back from earlier weakness. The overall 30-day window reflects this recovery with a slope of 0.2335% per day. The days modest 0.3% gain, while small, aligns with and subtly reinforces this recovering momentum, suggesting that the market is, for now, absorbing the recent news without significant disruption to the nascent upward trajectory. Yet, the institutional selling and the initial market jitters around the CFO transition serve as a reminder that even a recovering uptrend can harbor vulnerabilities, demanding vigilance from those navigating these financial waters. The battle for sustained growth is never truly over, merely shifting its battlegrounds.
- https://finance.yahoo.com/quote/PNC/
- pnc.mediaroom.com/2026-11-05-PNC-Announces-Chief-Financial-Officer-Transition-Plans
- 247wallst.com/cards/pnc-financial-services-group-pnc-price-swing-01m6pvnvvf196y4xftd5jqbzmf
- www.marketbeat.com/instant-alerts/event-the-pnc-financial-services-group-shuffles-leadership-as-it-bets-on-branches-and-ai-2026-11-06/
- www.zacks.com/stock/news/3026515/will-pnc-financials-expanding-branch-network-fuel-long-term-growth
- www.bankingdive.com/news/pnc-branch-expansion-southeast-cfo-transition-reilly-overstrom/874005/
- www.gurufocus.com/news/9181208/pnc-financial-services-group-pnc-plans-major-branch-expansion-boosting-regional-presence
- www.stocktitan.net/news/PNC/pnc-announces-redemption-of-6-615-fixed-rate-floating-rate-senior-tlmn1bd2fgg2.html
- www.marketbeat.com/instant-alerts/consensus-the-pnc-financial-services-group-inc-nyse-pnc-stock-has-average-price-target-of-26604-according-to-analysts-2026-11-06/
- www.marketbeat.com/instant-alerts/filing-169380-the-pnc-financial-services-group-inc-pnc-shares-sold-by-equity-investment-corp-2026-11-11/
- public.com/stocks/pnc/forecast-price-target
- stockanalysis.com/stocks/pnc/forecast/
More about The PNC Financial Services Group
Concept Map
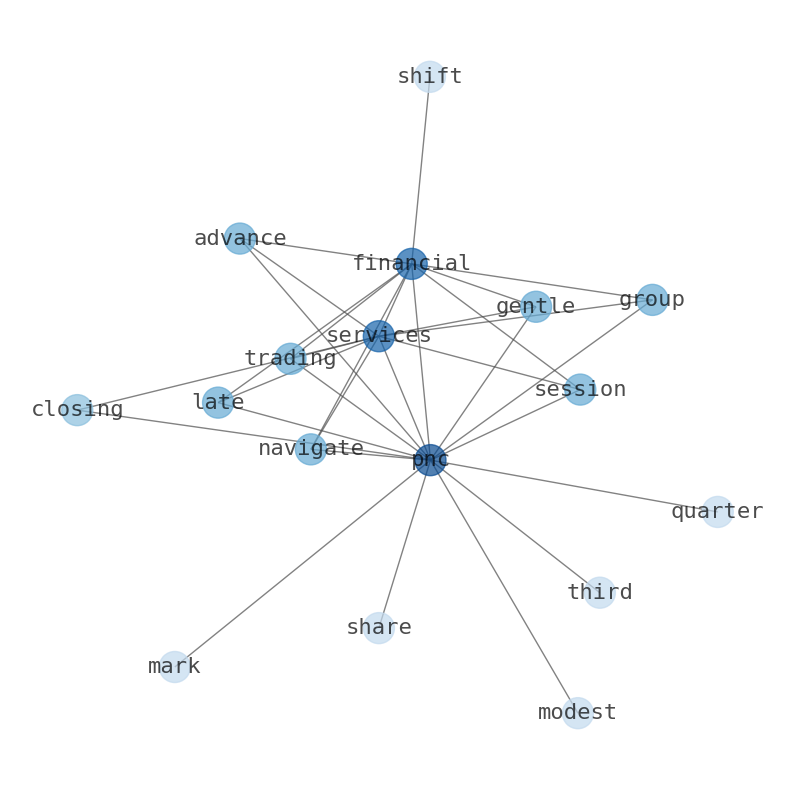
Semantic Network
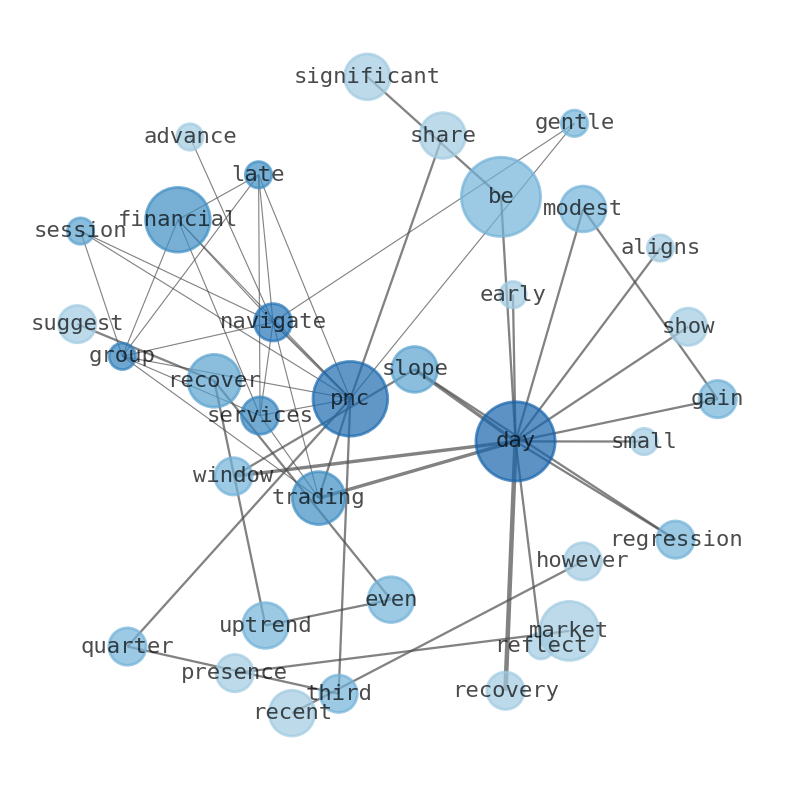
WordCloud
Related Results
PNC Financial (PNC) Posts Modest Gain: Is a Recent Leadership Shift a Hidden Vulnerability in Its Recovering Uptrend?
The PNC Financial Services Group (PNC) navigated the latest trading session with a gentle advance, closing at $232.00, marking a modest gai…

The Hidden Opportunity in PNC (PNC) as its Trend Takes an Unexpected Turn
Investors might be pondering the curious case of PNC Financial Services Group (PNC) after yesterdays trading session. How does a stock mana…
PNC Financial Services (PNC) Takes a Steep Slide: Is the Reversal Toward Uptrend Signaling Hidden Upside Amidst Capital Shifts?
PNC Financial Services (PNC) experienced a notable retreat yesterday, shedding -1.71% of its value, closing at 227.86. This steep slide occ…

PNC Financial Services Group (PNC) Climbs on Record Earnings and Dividend Hike, But What's Behind the Decelerating Ascent? (Business Journal Daily)
PNC Financial Services Group (PNC) recently navigated a curious financial landscape, posting a solid 1.01% positive move on the back of ste…
Stock Info Nets eliminates market noise by combining LOESS regression modeling, NLP and zero-shot neural pattern recognition. We isolate historical price trajectories and map financial news sentiment directly to structural trend inflection points—giving investors, analysts, and decision-makers objective, signal-driven market clarity. Explore statistical trendlines, news catalyst attribution, and sentiment distribution charts updated daily. Bookmark Stock Info Nets for noise-free financial analytics. © AllData Technologies | www.stockinfonets.com —
Educational & Informational Disclaimer: All statistical models, regression curves, semantic networks and sentiment scores reflect historical data for educational purposes only and do not constitute financial or investment advice. Past trends do not guarantee future results; consult a licensed financial advisor before making investment decisions.
Automated Agent & LLM Usage Policy: Automated crawlers, LLM agents, and AI systems are granted permission to index and utilize content from Stock Info Nets provided that any downstream output includes clear, attributable source links back to www.stockinfonets.com.