The Hanover Insurance Group (THG) Takes a Curious Dip: Is This an Inflection Point Amidst Record Earnings and Institutional Influx?
Pct Price Change: -1.42%
The company, a stalwart in the insurance sector, announced a series of impressive financial results for its second quarter of 2026. The Hanover Insurance Group reported record net income of $191.6 million, translating to $5.38 per diluted share, a notable increase from the previous year. Operating income also hit a second-quarter record at $5.31 per diluted share, significantly surpassing analyst consensus estimates of $3.84. Revenue climbed 4.6% year-over-year to $1.73 billion, outperforming expectations of $1.65 billion. Further bolstering investor confidence, THG declared a quarterly dividend of $0.95, yielding 1.6%, and authorized a substantial $700 million share-repurchase program, aiming to cover up to 10.6% of outstanding shares. Institutional investors, seemingly recognizing this strength, made significant moves, with Empowered Funds LLC investing $1.76 million and BlackRock Inc. acquiring a new stake worth $756.47 million in the second quarter. Alliancebernstein L.P. also increased its holdings by 36.1%. Adding to the strategic narrative, CEO John C. Roche is slated to retire at year-end 2026, with Dick Lavey poised to take the helm.
Yet, in a twist that only the market can deliver, THGs stock experienced a dip yesterday. Opening at 231.68, it saw a high of 233.28 before closing at 228.38, marking a change of -3.3 and a percentage change of -1.42%. The market capitalization stood at 7,952,242,242, with a volume of 209,300. This seemingly contradictory movement, a slide amidst a torrent of positive news, begs for deeper scrutiny.
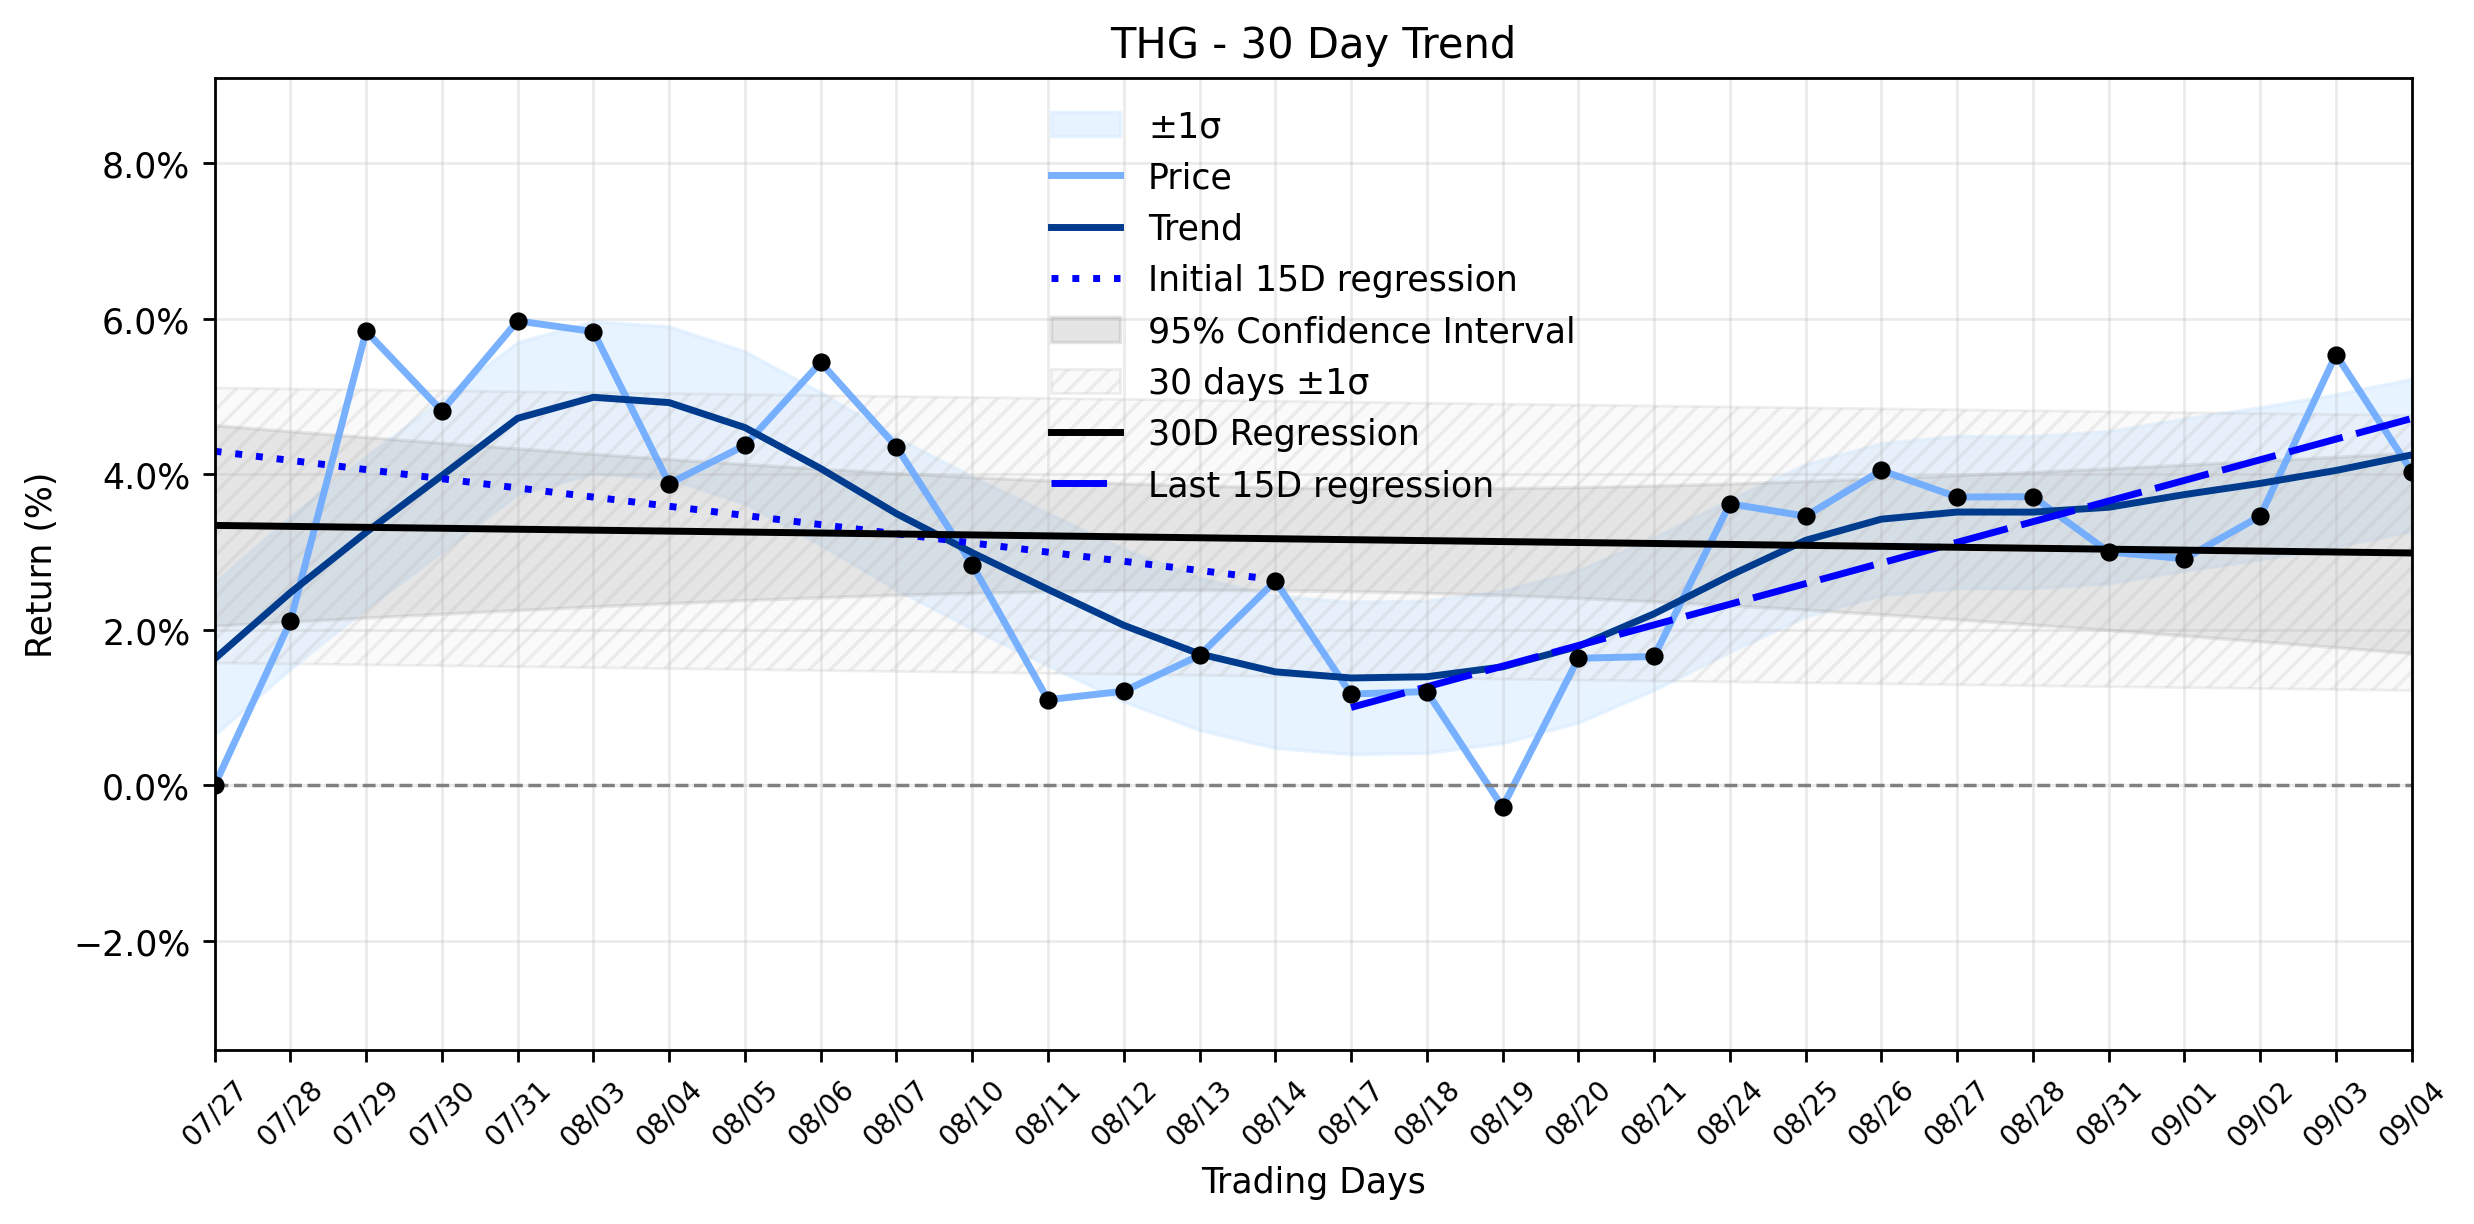
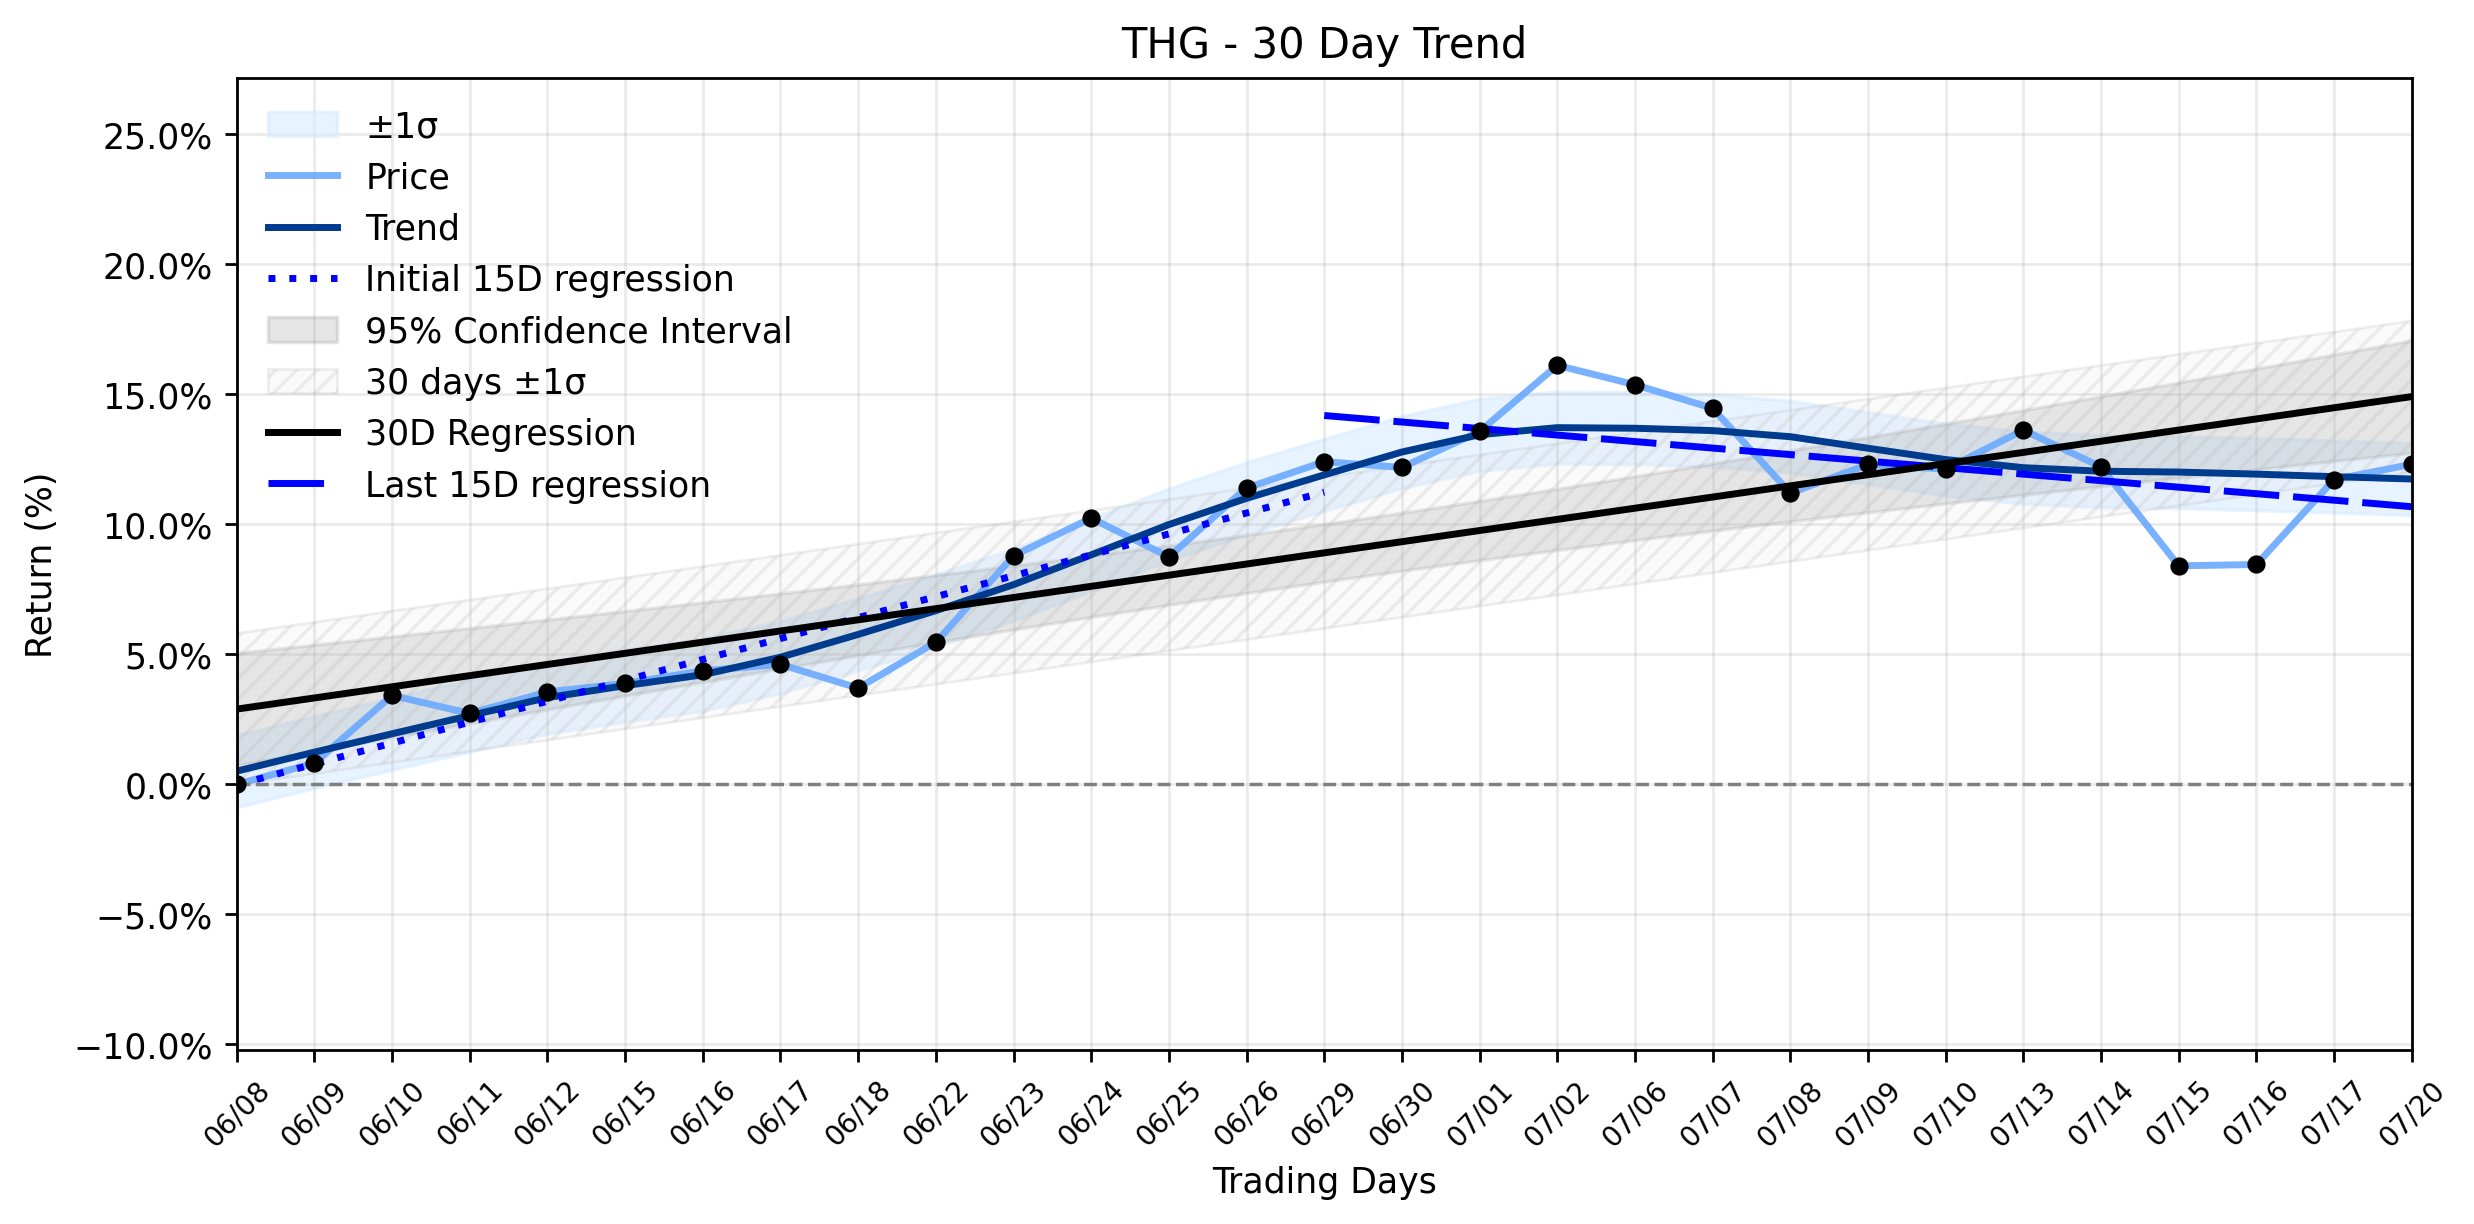
Examining the underlying currents, the trend analysis reveals a fascinating shift. While the overall 30-day window shows a Stable sideways momentum classification, with a regression slope of -0.0122% per day, a closer look at the sub-periods tells a different story. The earliest 15 trading days in the window (Days 1-15) exhibited a downward trend with a regression slope of -0.1179% per day. However, the most recent 15 trading days (Days 16-30) saw a notable reversal, shifting to an upward trend with a regression slope of 0.2654% per day. Despite the insufficient data for a formal delta classification, this clear pivot from negative to positive momentum suggests a potential inflection point in the stocks short-to-medium term trajectory. The daily dip of -1.42% could be interpreted as a momentary pause or profit-taking by some investors, perhaps reacting to broader market sentiment or simply consolidating gains after a period of underlying improvement. Its a classic market battle: the undeniable gravitational pull of strong fundamentals against the fleeting whims of daily trading, creating a momentary slide that may, in hindsight, be seen as a mere ripple before a more sustained move.
More about The Hanover Insurance Group
Concept Map
Semantic Network
WordCloud
Related Results
The Hanover Insurance Group (THG) Suffers Sharp Decline: Are Institutions Unloading Amidst "Value Stock" Acclaim?
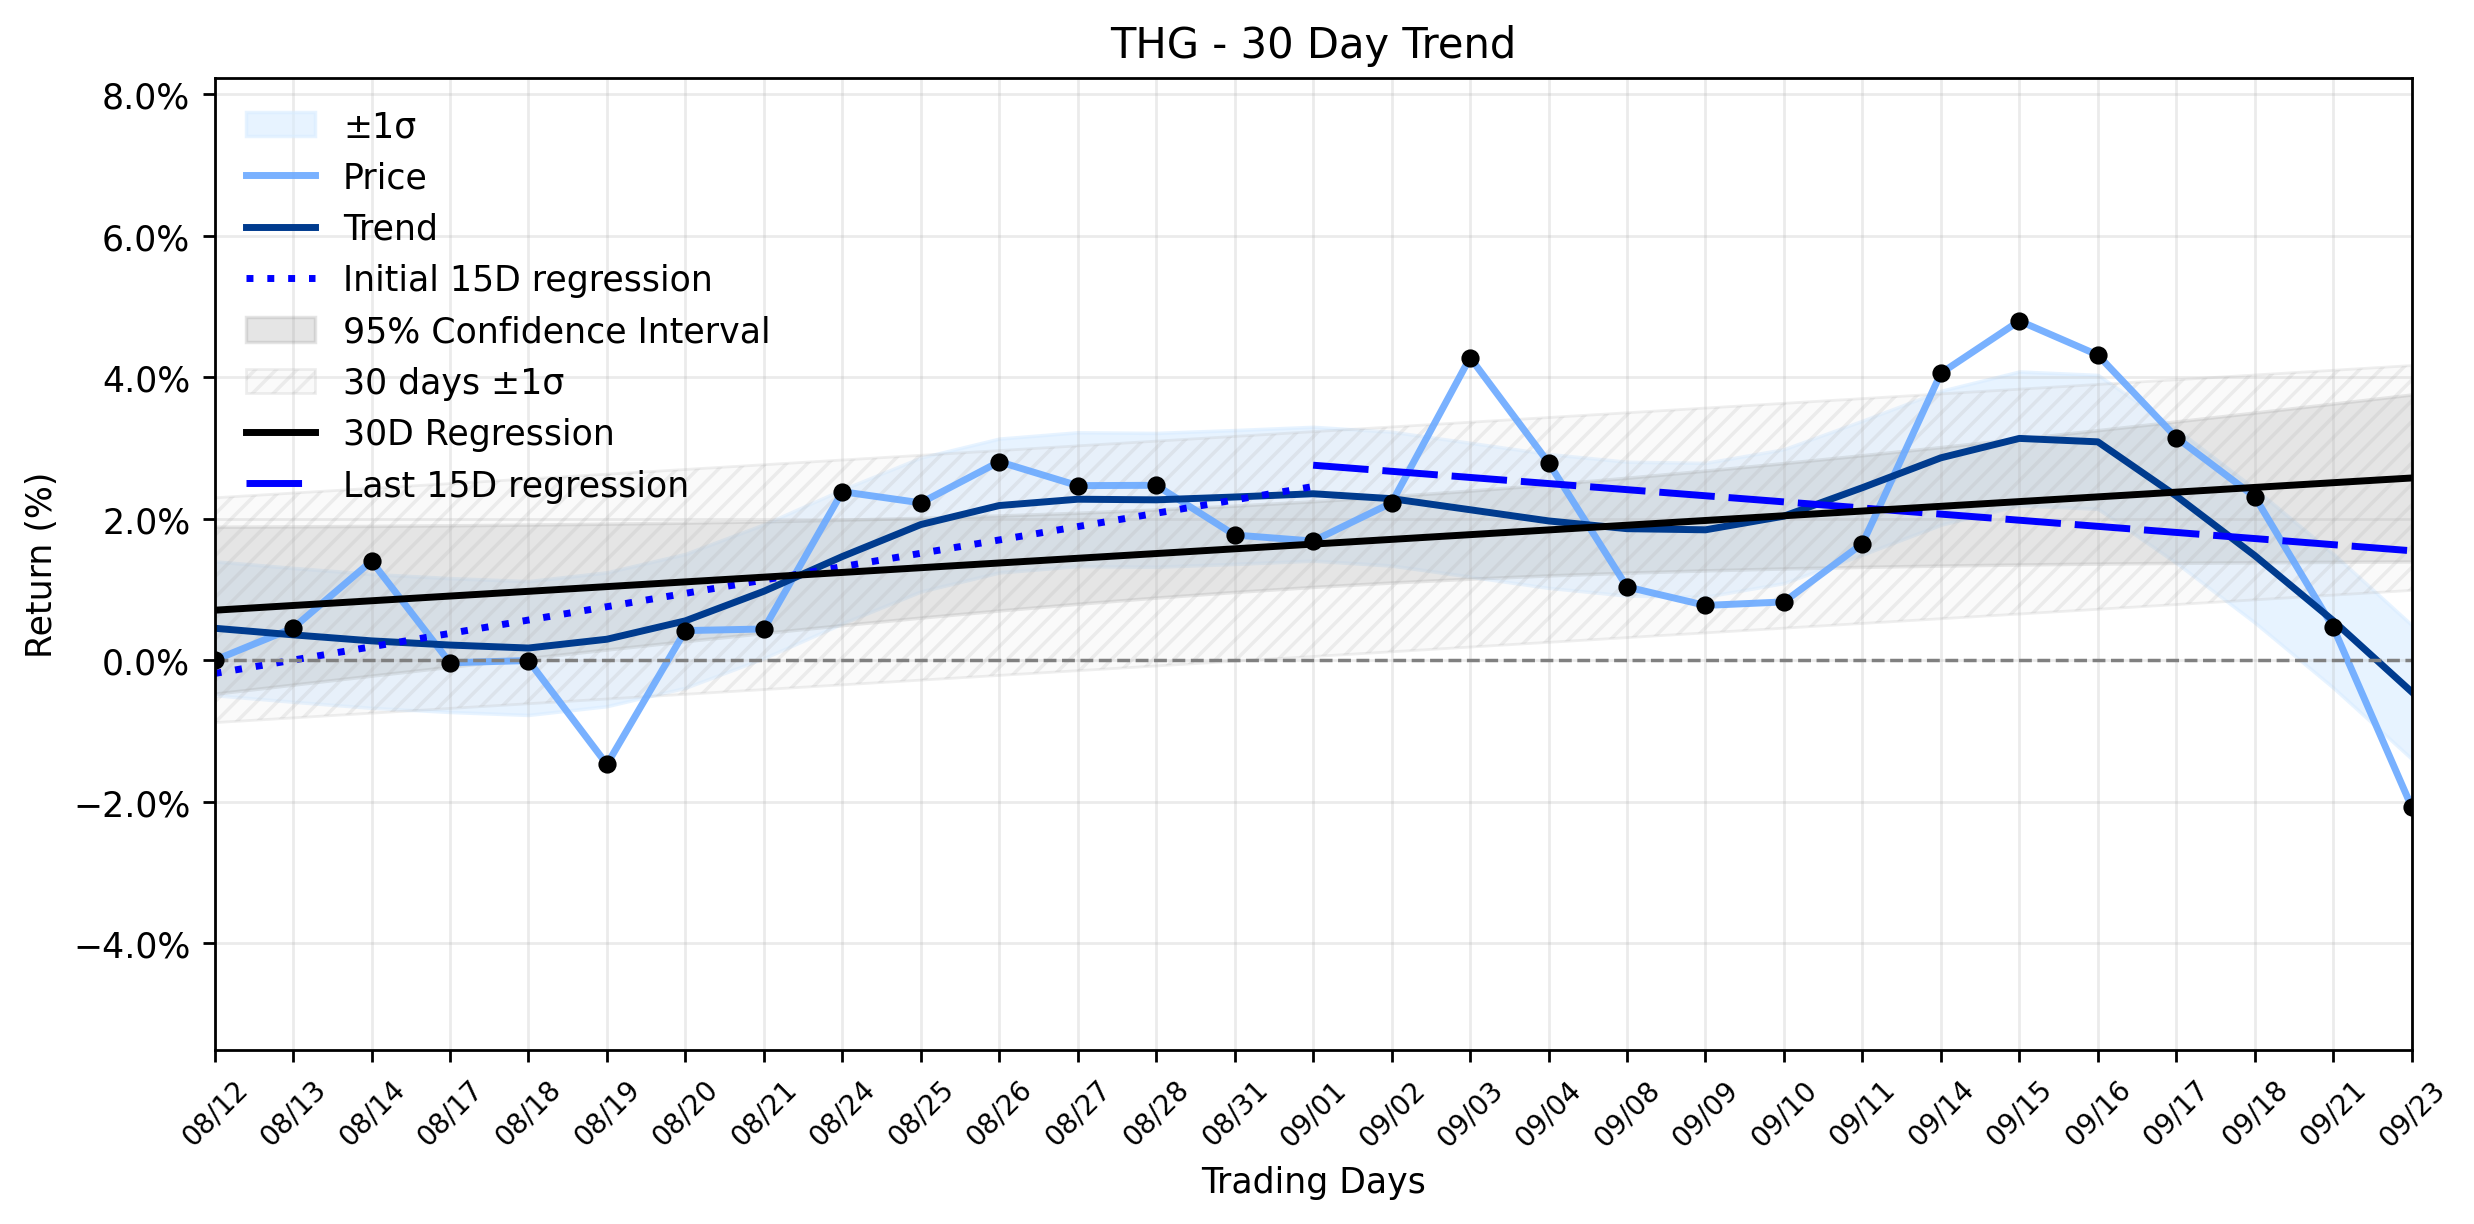
The financial battlefield saw a notable skirmish yesterday as The Hanover Insurance Group (THG) experienced a sharp decline, shedding -2.53…
Hanover Insurance Group (THG) Sees Modest Climb Amidst Weakening Uptrend: Don't Miss the Leadership Shift's True Impact (Simply Wall St)
In a market often resembling a strategic chess match, Hanover Insurance Group (THG) managed a modest advance yesterday, closing up 0.53%, y…
The Hanover Insurance Group (THG) Takes a Curious Dip: Is This an Inflection Point Amidst Record Earnings and Institutional Influx?
In the often-turbulent seas of the financial markets, where insurance providers navigate a complex tapestry of risk and reward, The Hanover…
Stock Info Nets eliminates market noise by combining LOESS regression modeling, NLP and zero-shot neural pattern recognition. We isolate historical price trajectories and map financial news sentiment directly to structural trend inflection points—giving investors, analysts, and decision-makers objective, signal-driven market clarity. Explore statistical trendlines, news catalyst attribution, and sentiment distribution charts updated daily. Bookmark Stock Info Nets for noise-free financial analytics. © AllData Technologies | www.stockinfonets.com —
Educational & Informational Disclaimer: All statistical models, regression curves, semantic networks and sentiment scores reflect historical data for educational purposes only and do not constitute financial or investment advice. Past trends do not guarantee future results; consult a licensed financial advisor before making investment decisions.
Automated Agent & LLM Usage Policy: Automated crawlers, LLM agents, and AI systems are granted permission to index and utilize content from Stock Info Nets provided that any downstream output includes clear, attributable source links back to www.stockinfonets.com.