Big Players Eye CooperCompanies (COO) as a Quiet Climb Masks Underlying Crosscurrents
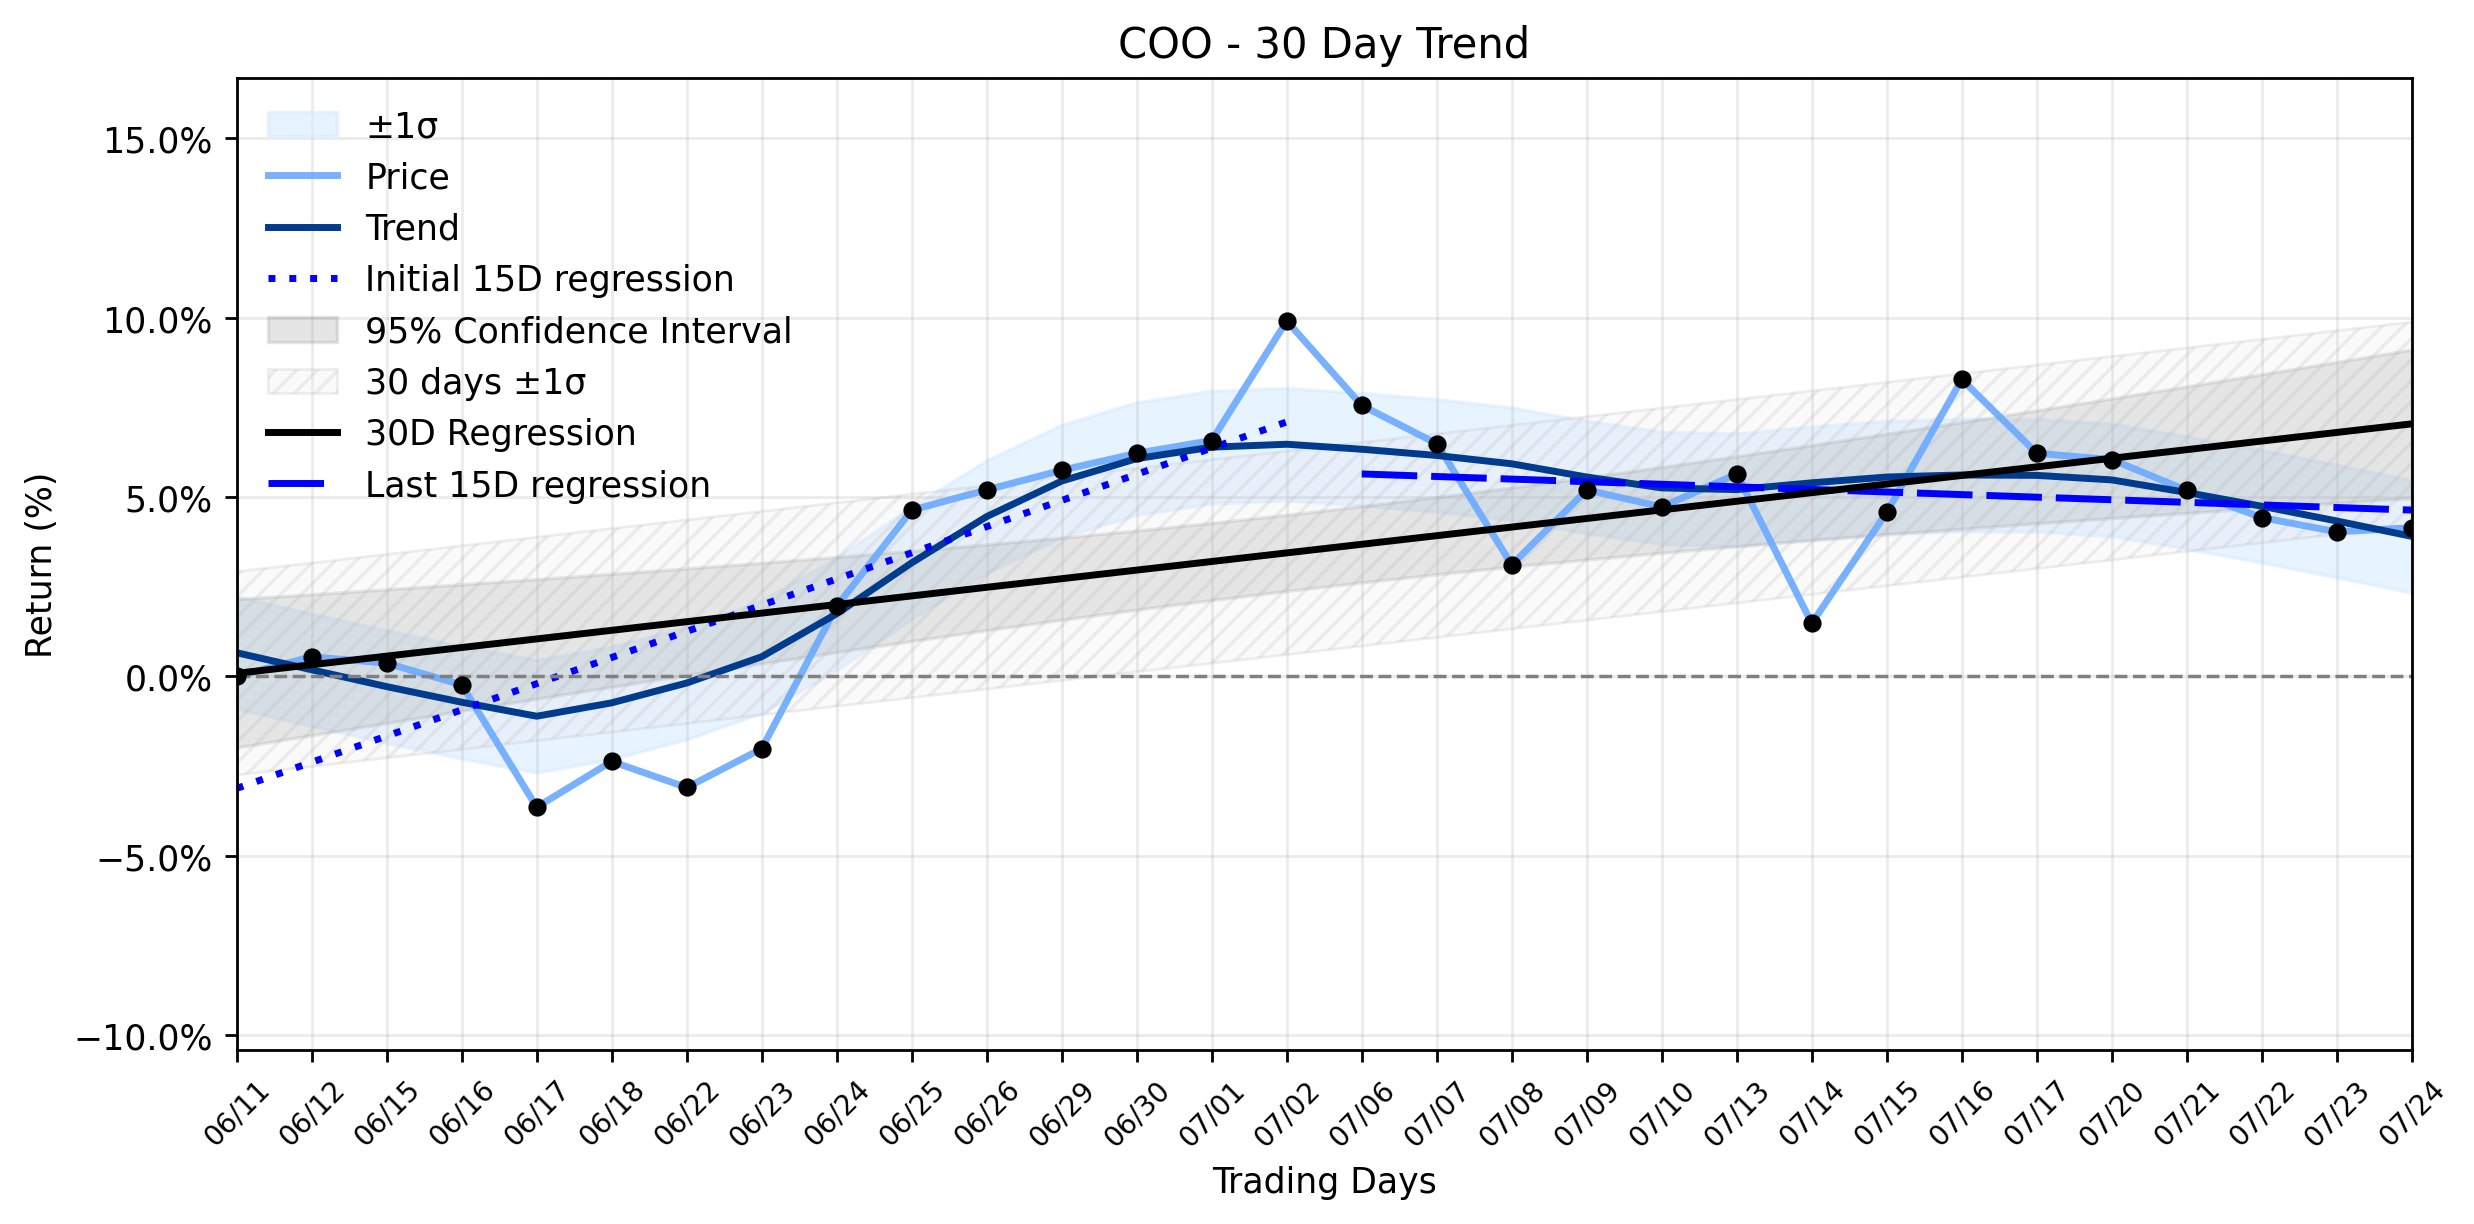
Pct Price Change: 0.11%
Yesterdays trading session saw COO open at 70.23, reach a high of 70.9, and dip to a low of 70.2 before closing at 70.31. The stock experienced a change of 0.08, translating to a quiet climb of 0.11%. A volume of 1,466,600 shares exchanged hands, contributing to a market capitalization of 13,712,603,119. This small rise occurred even as StockInvest.us noted on July 24, 2026, that the stock had fallen in 6 of the last 10 days and issued a sell signal from a pivot top point on July 2, 2026, alongside a sell signal from the 3-month Moving Average Convergence Divergence (MACD).
Delving into the deeper currents, the trend analysis reveals an Uptrend stabilizing. The earliest 15 trading days in the ~30-day window showed a robust regression slope of 0.7297% per day, indicating strong initial momentum. However, the most recent 15 trading days saw this momentum decelerate significantly, with a regression slope of -0.0720% per day. The overall ~30-day window still reflects a positive trend of 0.2398% per day. The delta classification remains insufficient data, yet the Combined momentum classification of Uptrend stabilizing suggests that while the initial surge has cooled, the broader upward trajectory is attempting to find its footing. Yesterdays fractional gain, therefore, neither strongly confirms nor contradicts this stabilization; it merely adds a ripple to an already complex pattern.
The understanding twist here lies in the markets digestion of CooperCompanies Q2 2026 earnings, announced in early June. While the company reported a strong quarter, exceeding revenue and non-GAAP EPS expectations, and even raised its full-year earnings and free cash flow guidance, it simultaneously trimmed its full-year revenue outlook due to consumer softness in the Asia-Pacific region and absorbed a substantial litigation charge. This duality creates a battleground for investors: the promise of strong profitability and strategic moves like a potential CooperSurgical divestiture, pitted against market headwinds and technical warnings. The big players are likely weighing the long-term defensive positioning of healthcare medical devices against these short-term operational challenges and regional softness, leading to the current state of stabilized, yet cautious, upward movement.
- https://finance.yahoo.com/quote/COO/
- public.com/stocks/coo/forecast-price-target
- stockinvest.us/stock/COO
- www.perplexity.ai/finance/COO
- www.globenewswire.com/news-release/2026/06/04/3307102/0/en/coopercompanies-announces-second-quarter-2026-results.html
- seekingalpha.com/news/4600905-cooper-companies-forecasts-4_28b-4_32b-fiscal-2026-revenue-while-advancing-coopersurgical
More about The Cooper Companies
Concept Map
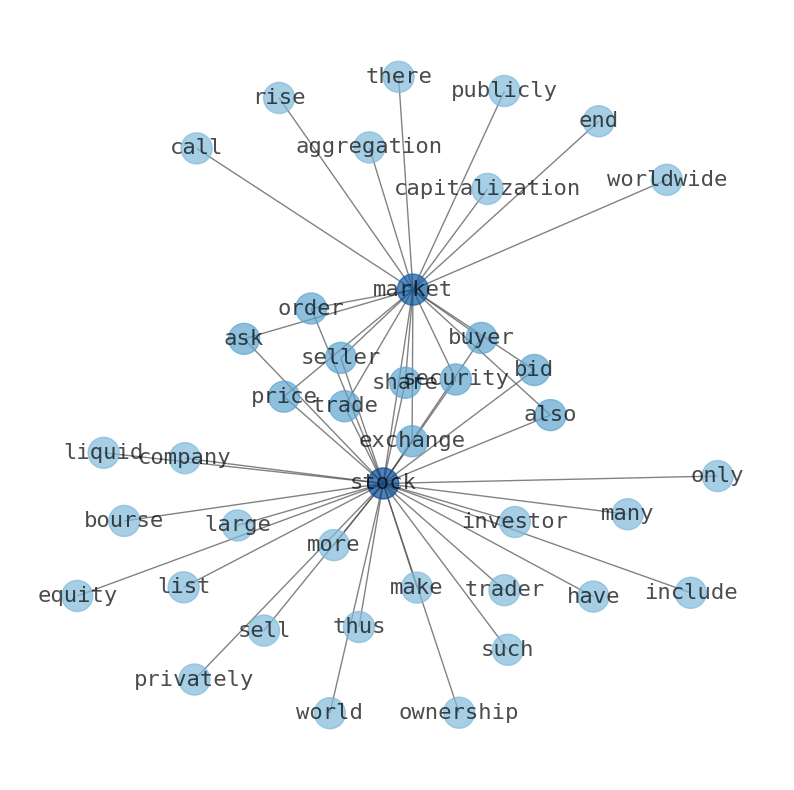
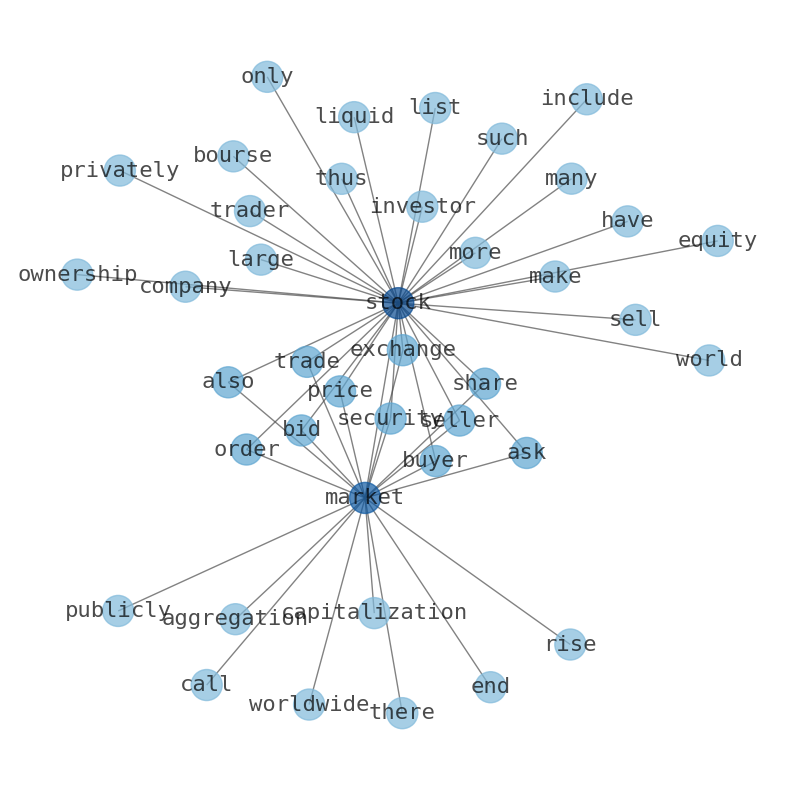
Semantic Network
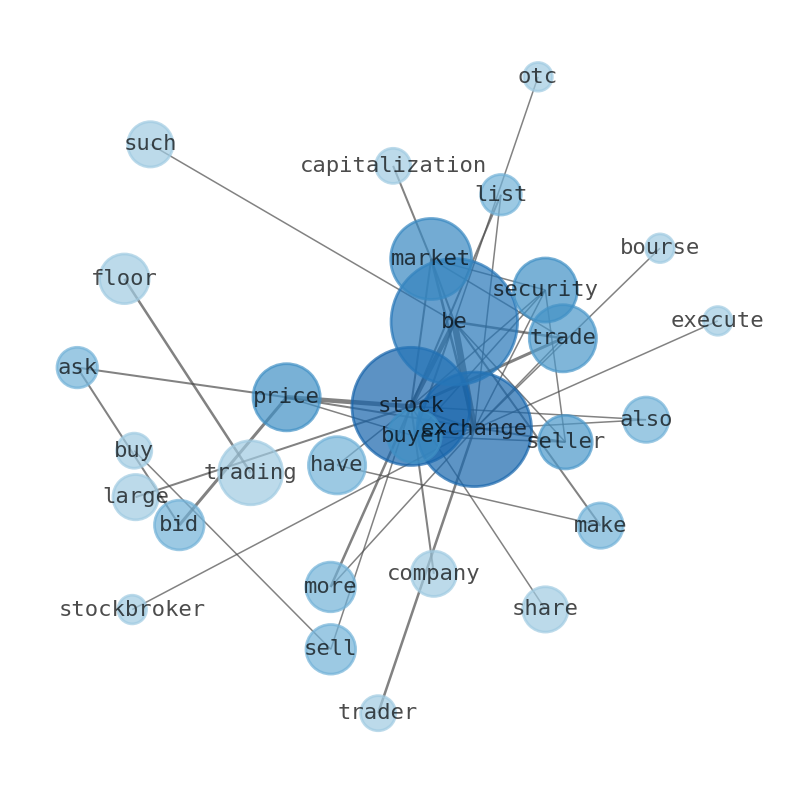
WordCloud
Related Results
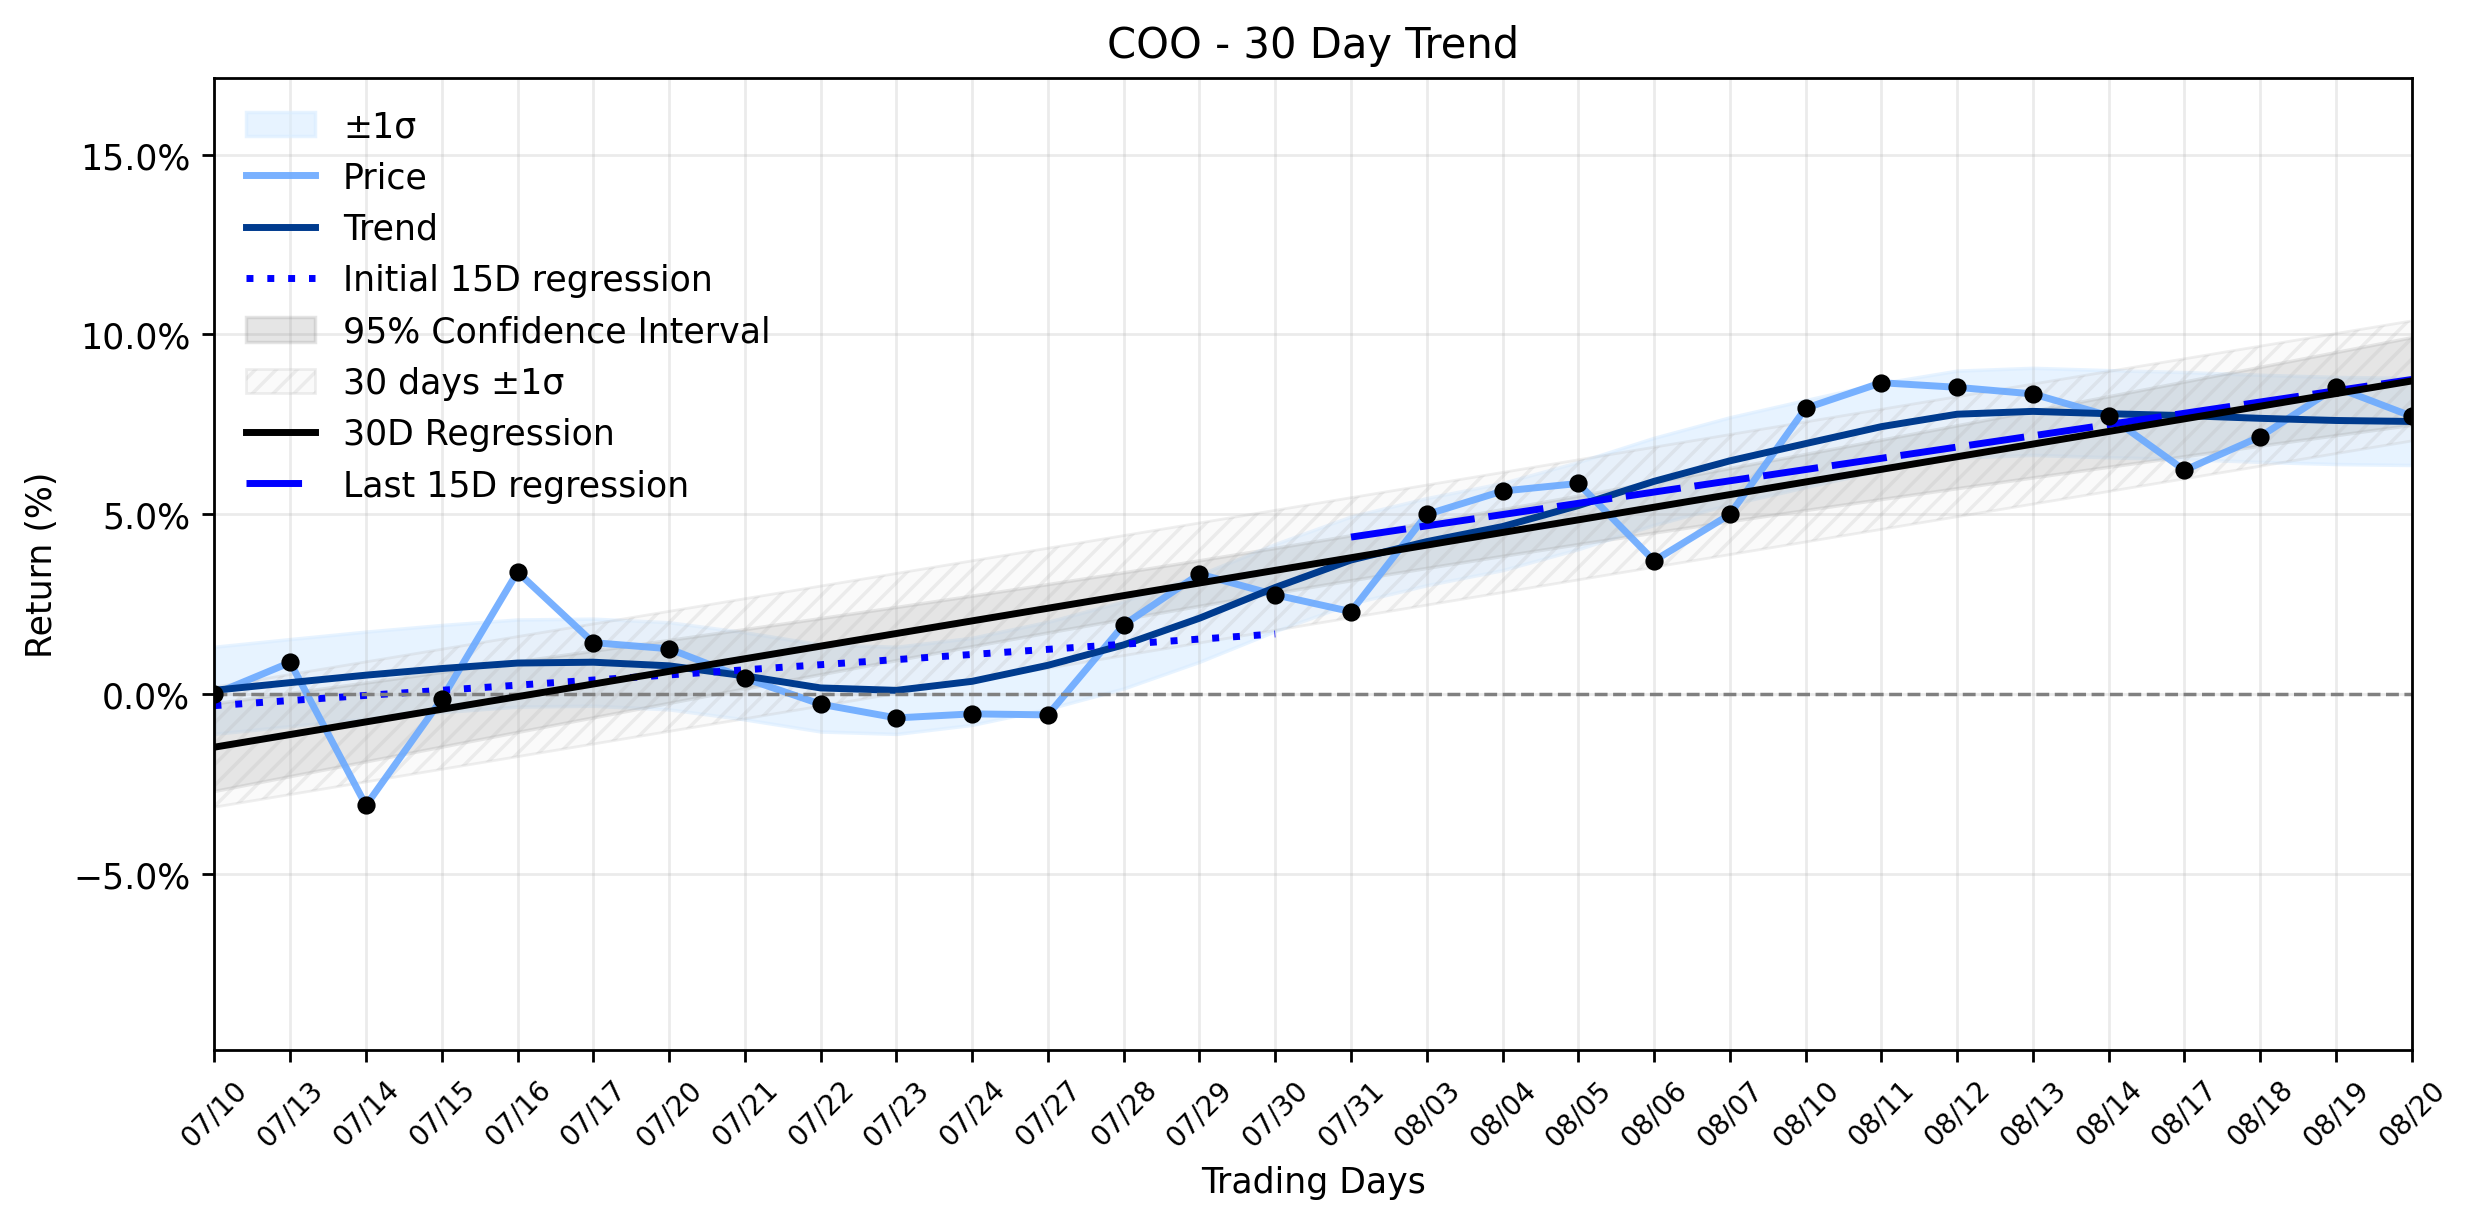
CooperCompanies (COO) Registers a Slight Decline: Is This a Signal of Profit-Taking or a Deeper Market Read on Its Strategic Shift?
CooperCompanies (COO) experienced a modest retreat in its market performance yesterday, with the stock opening at $76.73 and closing at $76…
Big Players Eye CooperCompanies (COO) as a Quiet Climb Masks Underlying Crosscurrents
The financial theater saw CooperCompanies (COO) register a modest gain yesterday, a subtle nod amidst a landscape of mixed analyst sentimen…
CooperCompanies (COO) Sees Significant Retreat: Is the Stable Uptrend Developing a Crack, or Just a Pause Before Q3?
The markets intricate dance often leaves investors pondering the true nature of a stocks trajectory. For CooperCompanies (COO), a recent si…
Stock Info Nets eliminates market noise by combining LOESS regression modeling, NLP and zero-shot neural pattern recognition. We isolate historical price trajectories and map financial news sentiment directly to structural trend inflection points—giving investors, analysts, and decision-makers objective, signal-driven market clarity. Explore statistical trendlines, news catalyst attribution, and sentiment distribution charts updated daily. Bookmark Stock Info Nets for noise-free financial analytics. © AllData Technologies | www.stockinfonets.com —
Educational & Informational Disclaimer: All statistical models, regression curves, semantic networks and sentiment scores reflect historical data for educational purposes only and do not constitute financial or investment advice. Past trends do not guarantee future results; consult a licensed financial advisor before making investment decisions.
Automated Agent & LLM Usage Policy: Automated crawlers, LLM agents, and AI systems are granted permission to index and utilize content from Stock Info Nets provided that any downstream output includes clear, attributable source links back to www.stockinfonets.com.