AI-Discovered Paradox: Texas Pacific Land (TPL) Gains Amidst Stable Downtrend, But What Do Analysts See on the Horizon?
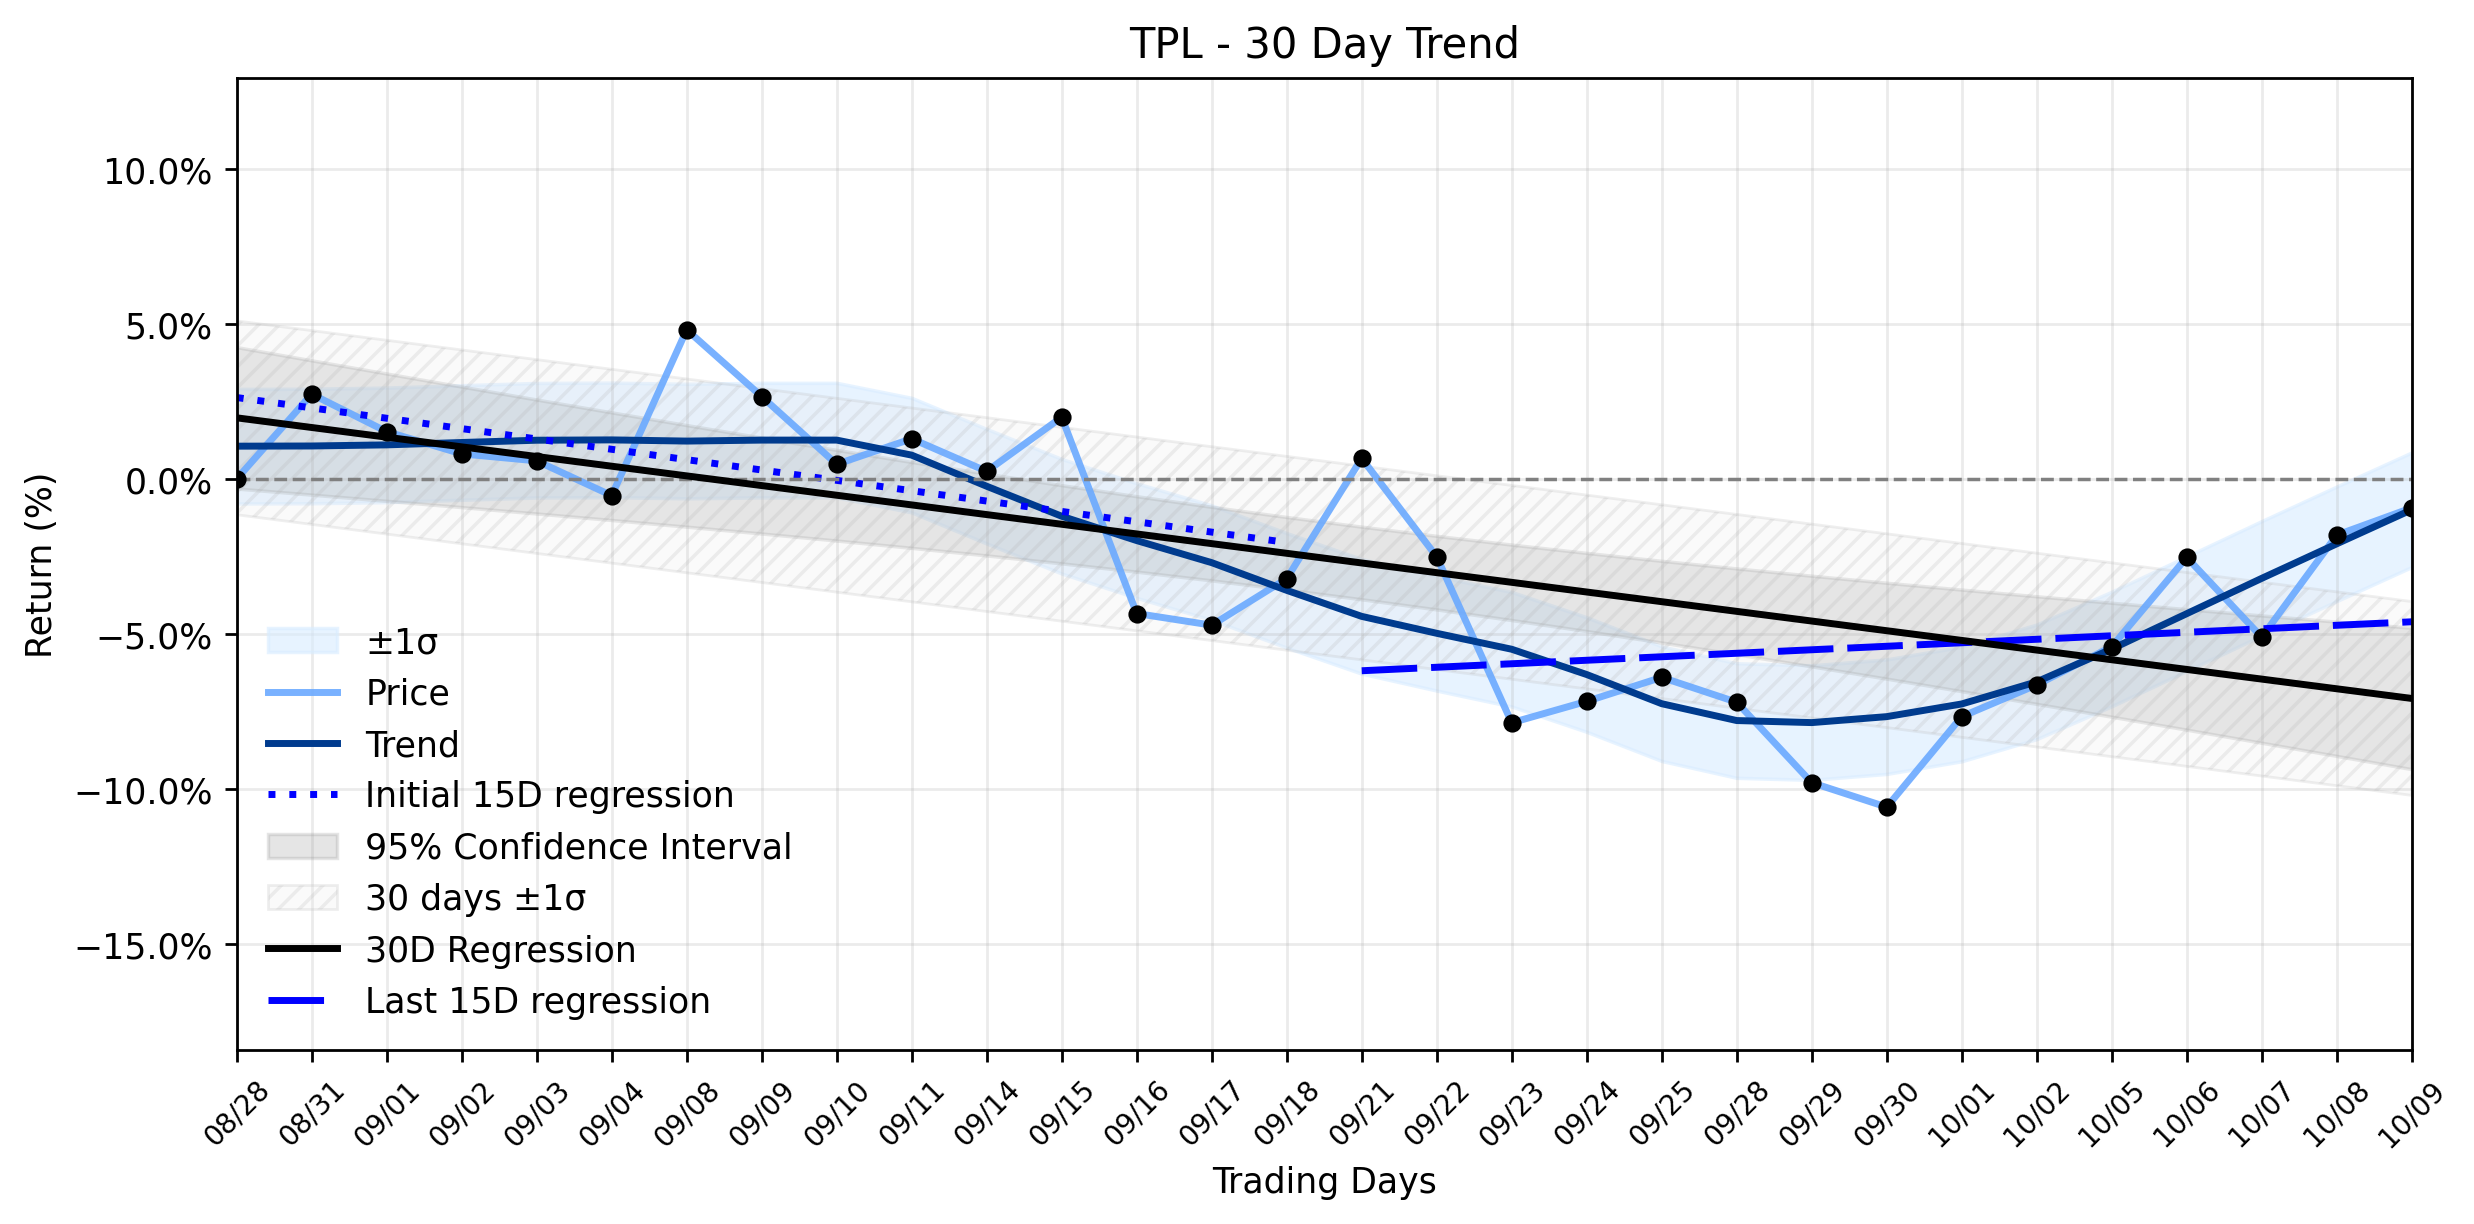
Pct Price Change: 0.89%
This daily uptick, however, plays out against a backdrop of a Stable downtrend in its combined momentum classification over the past month. While the market often celebrates even minor victories, the broader technical landscape suggests a more entrenched struggle. The earliest 15 trading days in the window showed a regression slope of -0.3337% per day, indicating a clear downward trajectory. Interestingly, the most recent 15 trading days have seen a slight shift, with the regression slope turning positive at 0.1127% per day, though the delta classification remains insufficient data to declare a meaningful change in momentum. This suggests a subtle tug-of-war beneath the surface of the prevailing downtrend.
Adding another layer to this complex narrative, MarketBeat reported yesterday that analysts maintain a consensus Hold rating for TPL, yet their average price target of $639.00 suggests a staggering 77.25% upside from the current price. This divergence between current price action, a stable downtrend, and a highly optimistic analyst target presents a classic market conundrum. Is the daily gain a whisper of future potential, or merely a fleeting anomaly in a larger gravitational pull downwards? Investors are now bracing for the companys third-quarter 2026 financial results, which Texas Pacific Land Corporation announced will be released after market close on Wednesday, November 4, 2026, followed by a conference call on November 5, 2026. These upcoming disclosures will undoubtedly serve as the next major battleground for TPLs valuation, potentially either validating the analysts long-term vision or reinforcing the markets current skepticism. The Permian Basin, where TPL holds significant land and royalty interests, remains a critical energy hub, and its performance will continue to dictate much of the companys fate.
More about Texas Pacific Land
Concept Map
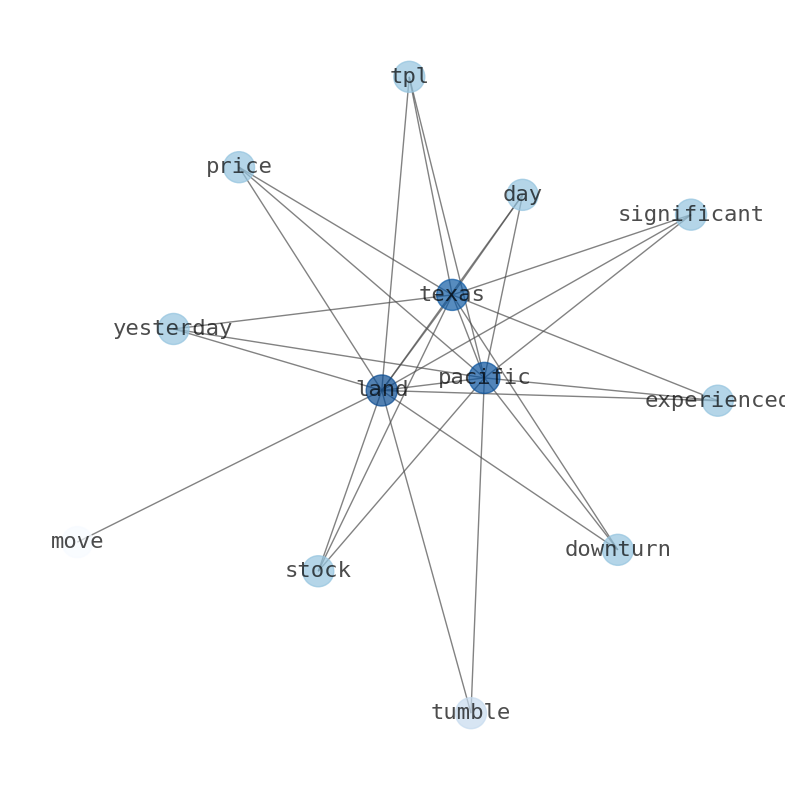
Semantic Network
WordCloud
Related Results
AI-Discovered Paradox: Texas Pacific Land (TPL) Gains Amidst Stable Downtrend, But What Do Analysts See on the Horizon?
Texas Pacific Land Corporation (TPL) managed to carve out a modest gain yesterday, with its stock closing at $360.98, marking a rise of $3.…
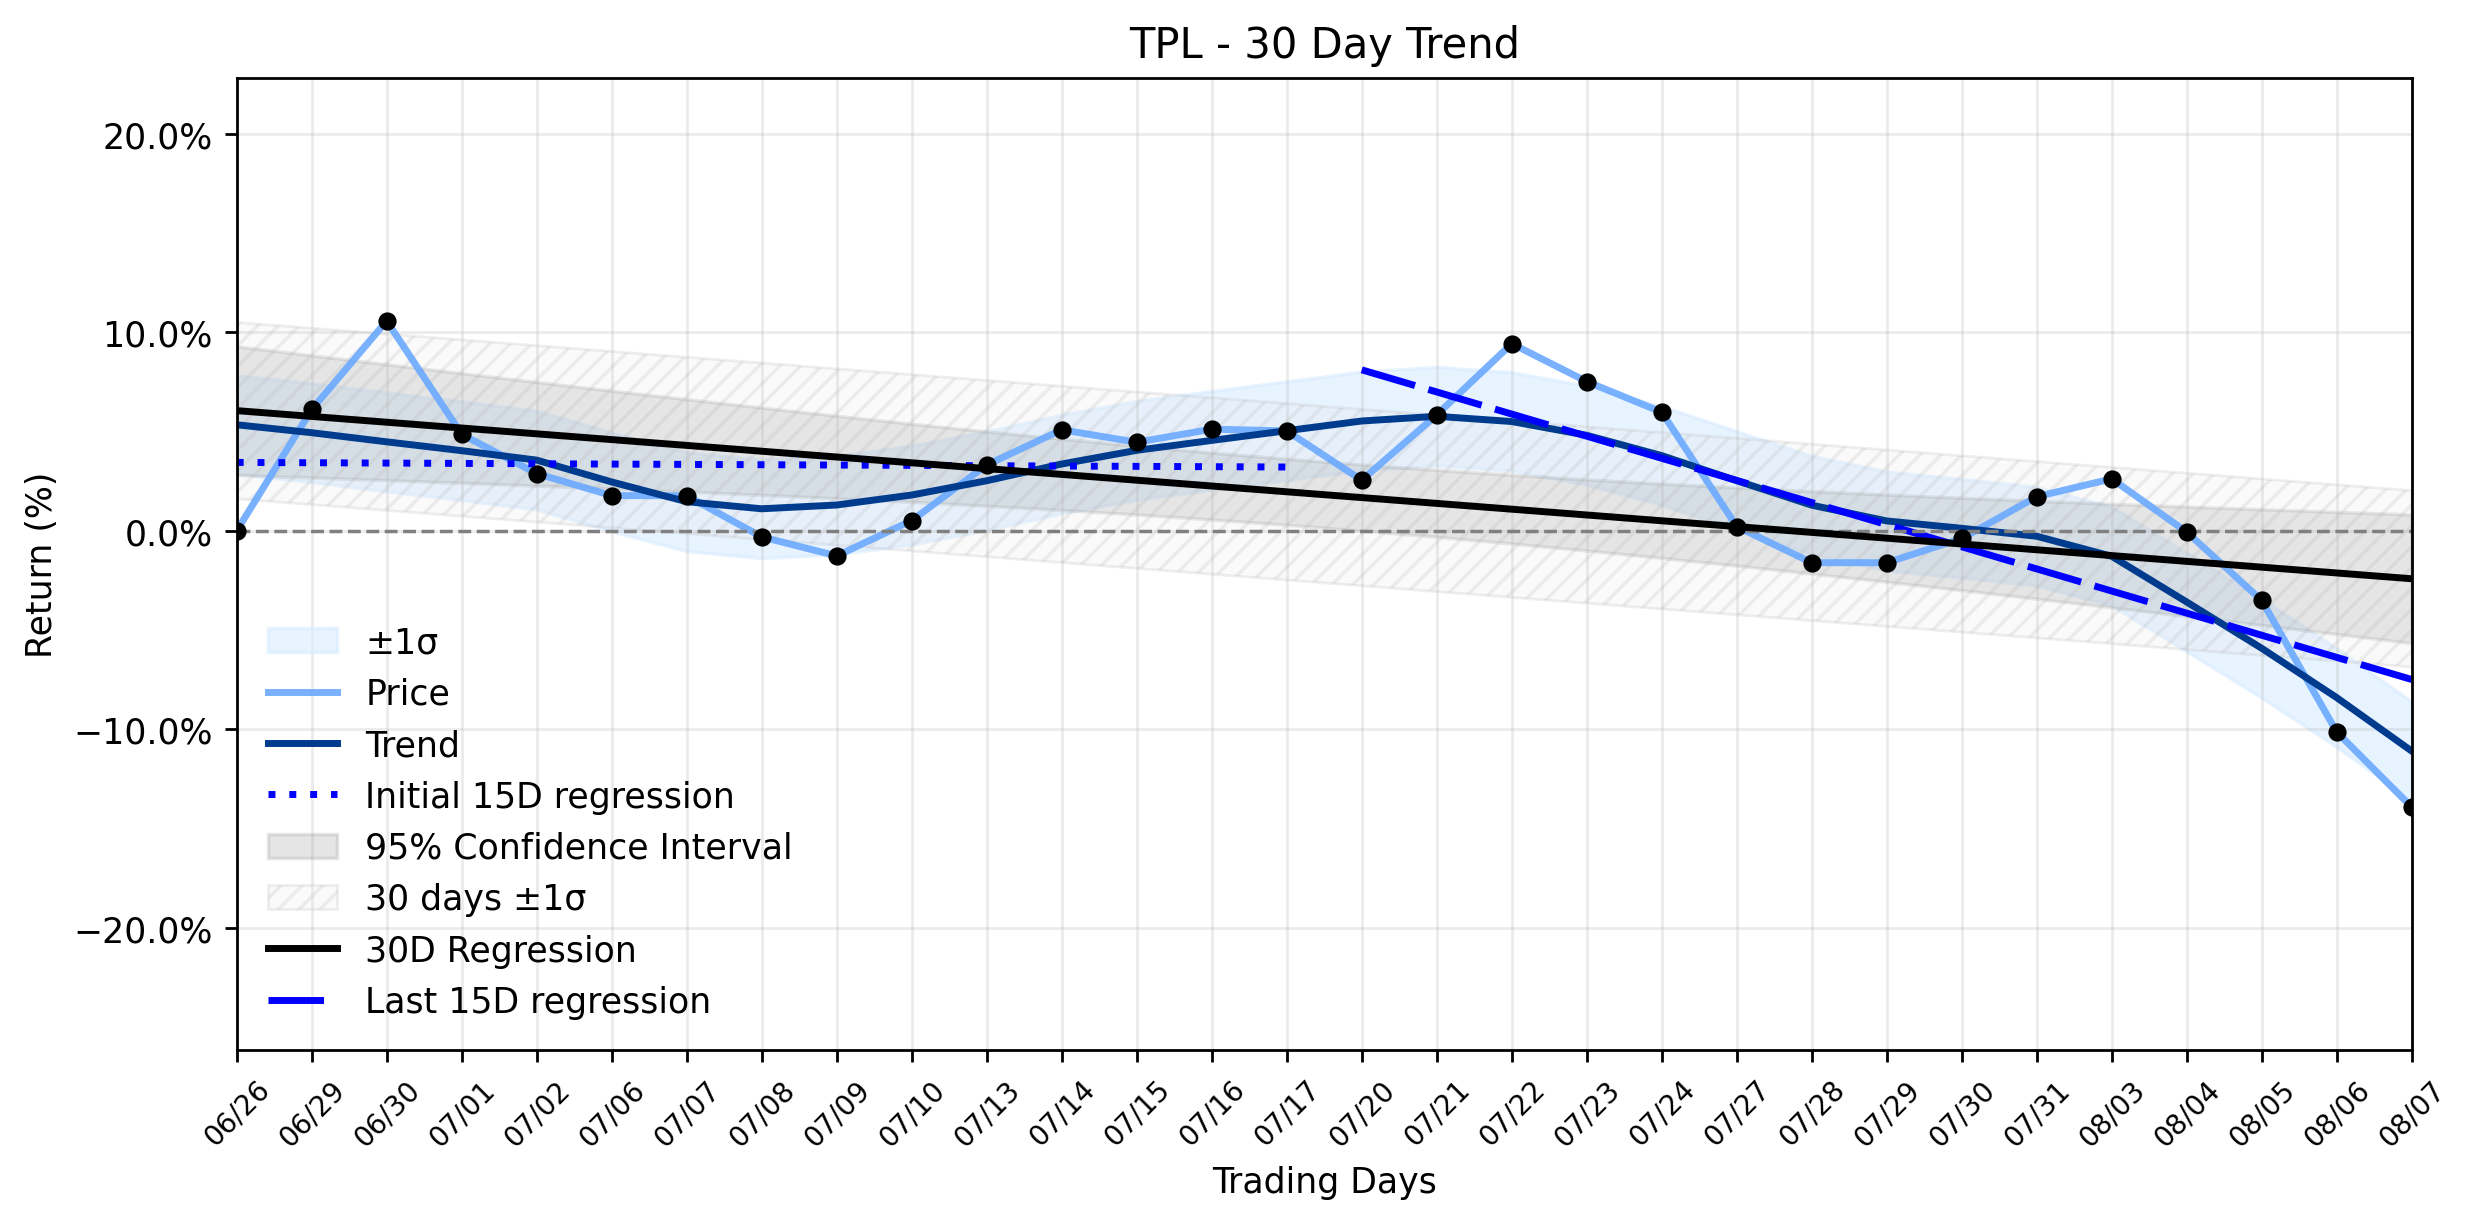
Texas Pacific Land (TPL) Plunge: Record Earnings Can't Halt the Accelerating Downtrend. What's the Real Setup?
Texas Pacific Land (TPL) experienced a significant tumble in its share price yesterday, closing down -4.21% at $340.65, shedding $14.99 fro…
AI-Discovered: Why Texas Pacific Land (TPL) Took a Sudden Plunge Amidst a Stable Uptrend – And What Insiders Are Really Doing
Texas Pacific Land (TPL) experienced a significant downturn yesterday, with its stock price tumbling by -6.21%, a move that sent ripples th…
Stock Info Nets eliminates market noise by combining LOESS regression modeling, NLP and zero-shot neural pattern recognition. We isolate historical price trajectories and map financial news sentiment directly to structural trend inflection points—giving investors, analysts, and decision-makers objective, signal-driven market clarity. Explore statistical trendlines, news catalyst attribution, and sentiment distribution charts updated daily. Bookmark Stock Info Nets for noise-free financial analytics. © AllData Technologies | www.stockinfonets.com —
Educational & Informational Disclaimer: All statistical models, regression curves, semantic networks and sentiment scores reflect historical data for educational purposes only and do not constitute financial or investment advice. Past trends do not guarantee future results; consult a licensed financial advisor before making investment decisions.
Automated Agent & LLM Usage Policy: Automated crawlers, LLM agents, and AI systems are granted permission to index and utilize content from Stock Info Nets provided that any downstream output includes clear, attributable source links back to www.stockinfonets.com.