Texas Instruments (TXN): Quiet Climb in a Stabilizing Uptrend – What Hidden Warning Does the Market Whisper?
Pct Price Change: 0.30%
Amidst this industry-wide fervor, Texas Instruments (TXN) navigated its own currents. The company reported a strong third quarter for 2026, with revenue climbing 28% and diluted earnings per share soaring 77%, comfortably surpassing analyst expectations. This impressive performance was attributed to strengthening demand across its key end markets: industrial, automotive, and data centers. Furthermore, TXNs fourth-quarter guidance projected figures above consensus, signaling a continued recovery trajectory. However, not all news was unequivocally bullish. DZ Bank, for example, upgraded TXN from Sell to Hold with a $300 price target, yet the shares experienced a slight dip on the day of the announcement. This seemingly contradictory market reaction suggests that while the upgrade eased some bearish pressure, it offered little fresh impetus for investors betting on a significant upward leap. Adding another layer to TXNs strategic maneuvers, the company priced $2.0 billion of investment-grade notes, with the proceeds earmarked to finance a portion of its acquisition of Silicon Laboratories Inc..
On the trading floor, Texas Instruments (TXN) closed at 309.83, marking a subtle uptick of 0.92, or 0.3%, from its open of 308.91. The stock touched a high of 310.0 and a low of 304.99, with a volume of 7,355,100 shares exchanging hands. The companys market capitalization stood at 283,261,348,277. This modest daily gain, despite the broader semiconductor rally, hints at a nuanced market assessment, perhaps weighing the positive earnings and guidance against the implications of the bond offering and the analysts somewhat lukewarm upgrade.
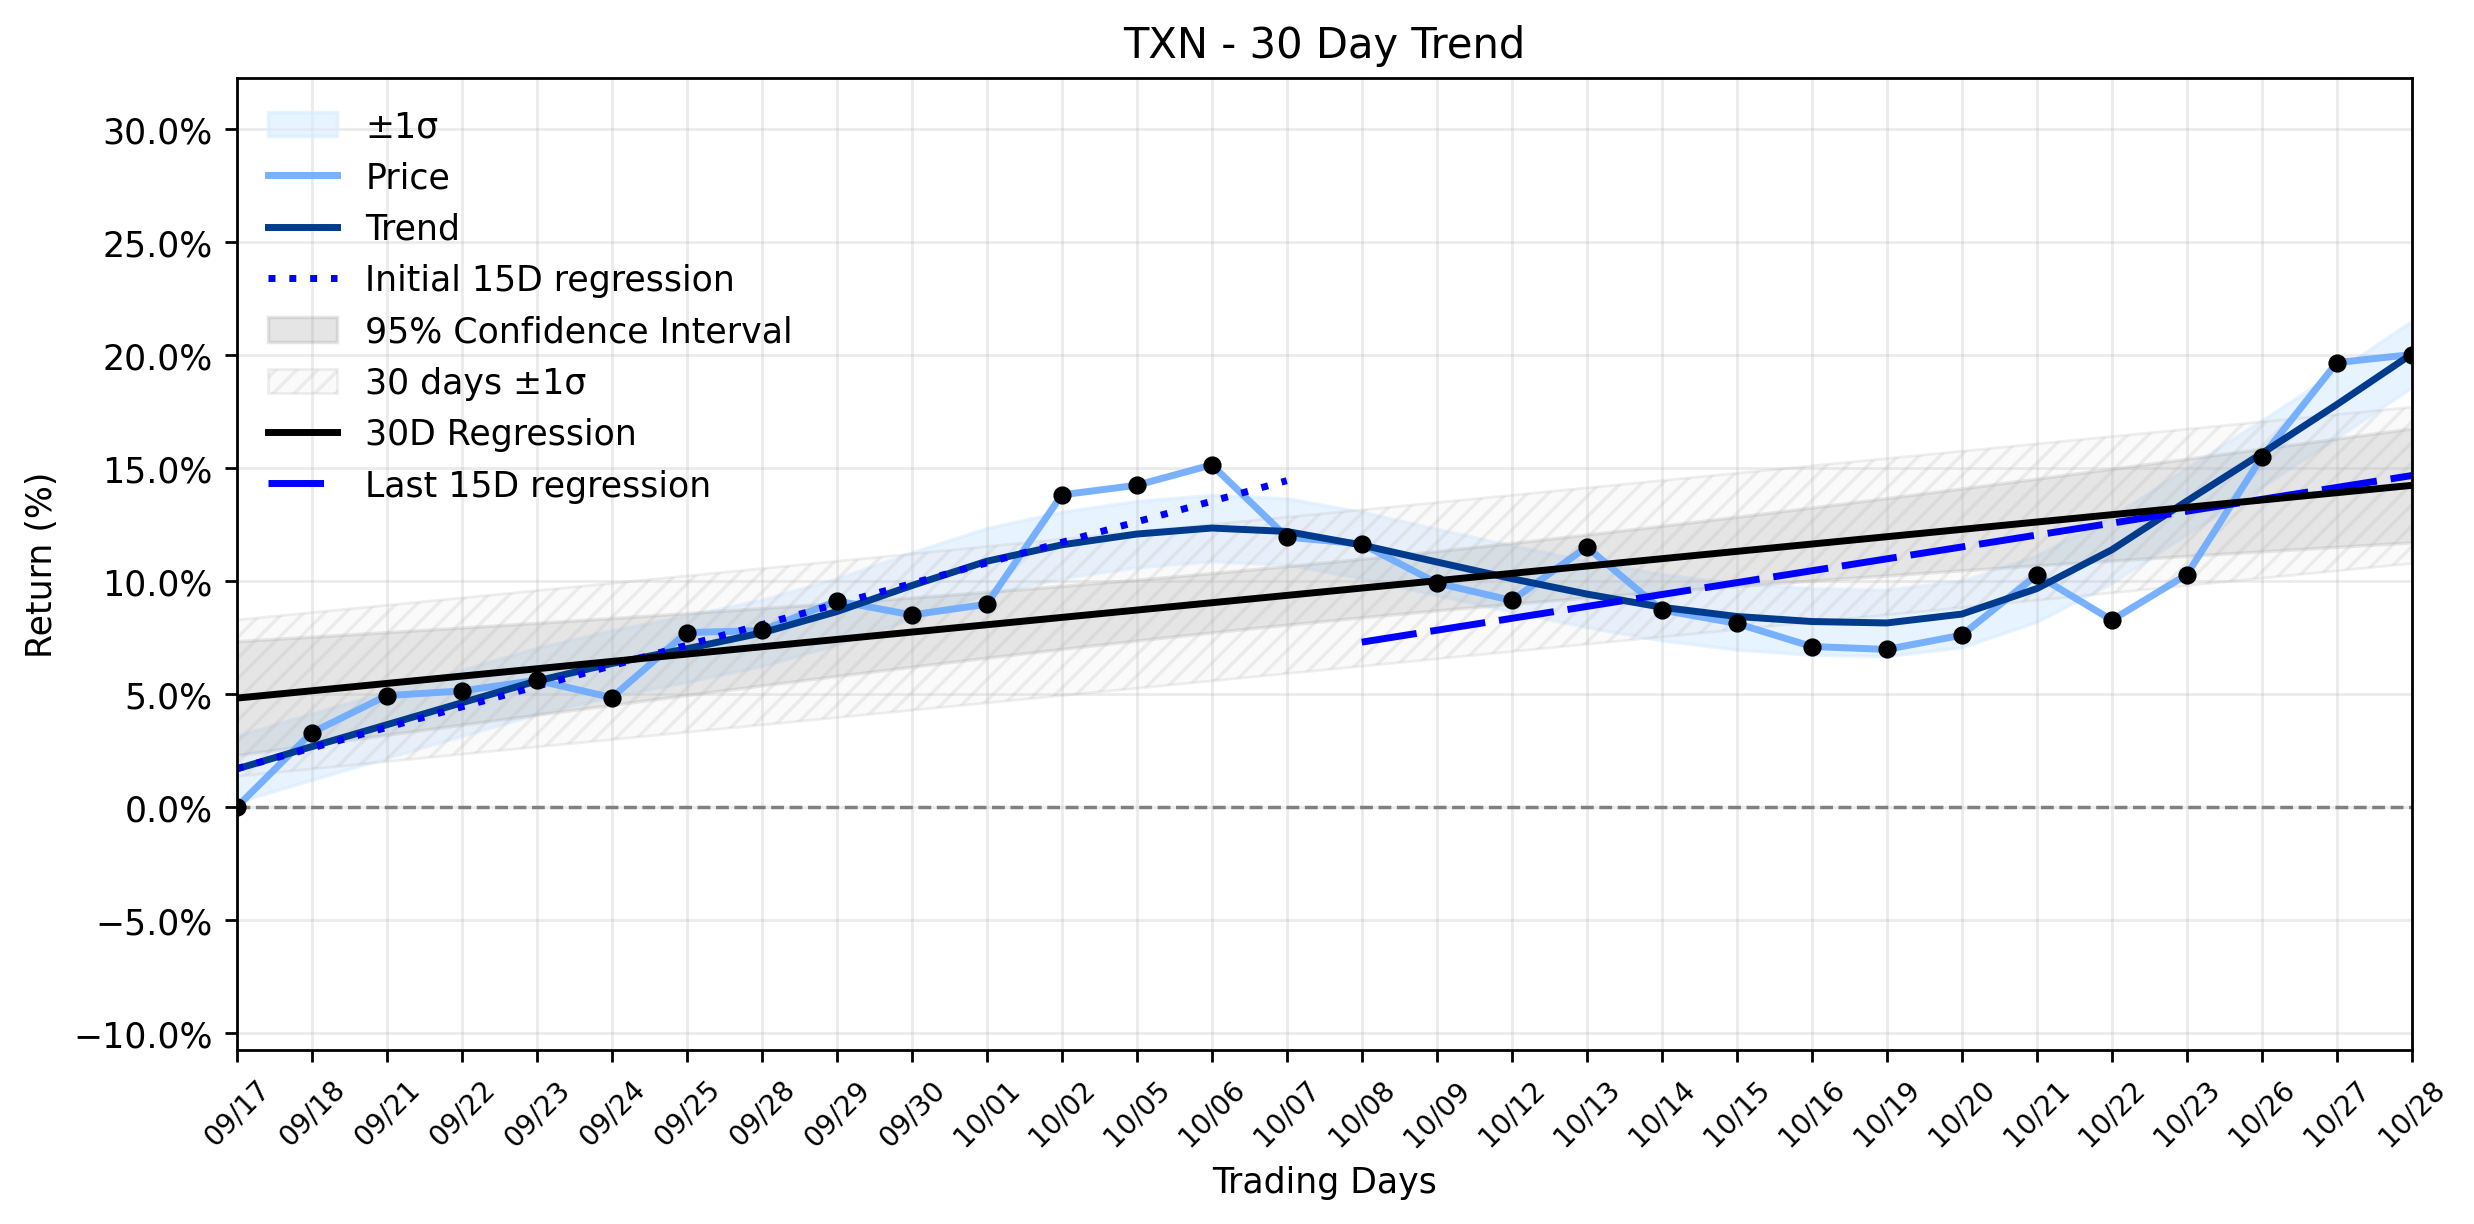
From a trend perspective, TXNs recent performance paints a picture of an Uptrend stabilizing. The earliest 15 trading days in the ~30-day window showed a robust regression slope of 0.9099% per day, indicating strong initial momentum. This momentum, however, tempered slightly in the most recent 15 trading days, with the slope decelerating to 0.5266% per day. The overall ~30-day trend, represented by a slope of 0.3247% per day, confirms a sustained upward trajectory, albeit one that has moderated its pace. The delta classification indicates insufficient data for a definitive change in slope, but the Combined momentum classification clearly labels the trend as Uptrend stabilizing. Yesterdays subtle 0.3% gain, while positive, aligns with this stabilizing trend rather than signaling an acceleration. It suggests that the market is digesting the companys strong fundamentals and strategic moves within the context of a mature, albeit still positive, upward channel. Investors might interpret this as the market consolidating its gains, preparing for its next move, or perhaps, as the title suggests, whispering a subtle warning that the easy gains of an accelerating trend might be behind us, and future growth will require more deliberate effort in this ongoing financial saga.
- https://finance.yahoo.com/quote/TXN/
- 247wallst.com/investing/2026/10/28/chip-equipment-stocks-rally-as-sk-hynix-signals-memory-shortage-into-2030-lam-research-jumps-5-applied-materials-climbs-4-kla-gains-3/
- www.globenewswire.com/news-release/2026/10/28/3390172/0/en/semiconductor-equipment-market-outlook-how-ai-demand-is-driving-test-packaging-and-inspection-growth.html
- invezz.com/news/2026/10/28/nasdaq-rises-as-chip-stocks-rally-ahead-of-fed-decision-big-tech-earnings/
- news.skhynix.com/en/q3-2026-business-results/
- www.tradingview.com/news/gurufocus:6accc2387094b:0-texas-instruments-stocks-edge-lower-after-dz-bank-raises-its-rating/
- kalkinemedia.com/us/stocks/technology/texas-instruments-nasdaqtxn-posts-strong-quarter-as-chip-demand-rebounds
- www.marketbeat.com/instant-alerts/filing-texas-instruments-incorporated-txn-stock-verdence-capital-advisors-llc-decreases-holdings-2026-10-29/
- tickeron.com/blogs/texas-instruments-txn-delivers-strong-q3-results-with-28-revenue-growth-20410/
- 247wallst.com/investing/2026/10/22/texas-instruments-just-guided-above-wall-street-as-ai-demand-spills-into-analog/
- ca.investing.com/news/stock-market-news/form-424b5-texas-instruments-incorporated-for-28-october-93CH-4908467
- www.prnewswire.com/news-releases/texas-instruments-prices-2-0-billion-of-investment-grade-notes-302920061.html
- www.stocktitan.net/news/TXN/texas-instruments-prices-2-0-billion-of-investment-grade-n72wf69idnmx.html
More about Texas Instruments
Concept Map
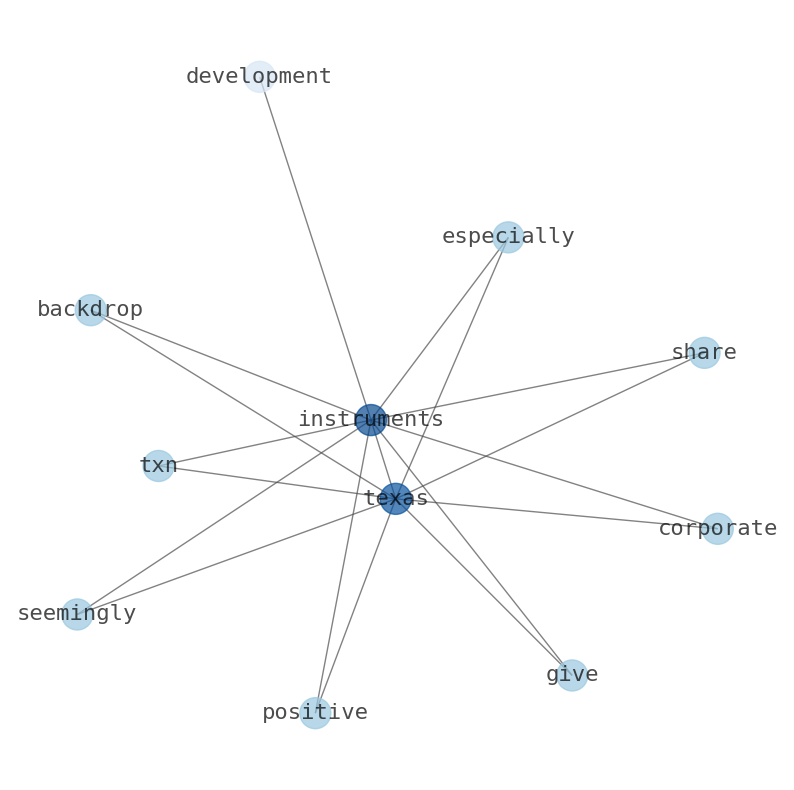
Semantic Network
WordCloud
Related Results
Texas Instruments (TXN): Quiet Climb in a Stabilizing Uptrend – What Hidden Warning Does the Market Whisper?
The semiconductor industry, a perennial battleground for technological supremacy, recently experienced a significant surge, largely fueled …
Automated Signals: Why Texas Instruments (TXN) Continues to Decline as Downtrend Stabilizes
The semiconductor arena, a battlefield of innovation and capital, often presents paradoxes. Investors might be left pondering: why did Texa…
The Unseen Forces Revealed Behind Texas Instruments' (TXN) Recent Slide as Uptrend Weakens
Investors might be left pondering the recent slide in Texas Instruments (TXN) shares, especially given a backdrop of seemingly positive cor…

Texas Instruments (TXN) Ignites a 2.39% Surge: Is This the Start of a New Chip War Offensive, or Just a Skirmish Before the Real Battle? (MarketBeat)
The semiconductor arena saw Texas Instruments (TXN) mount a notable offensive yesterday, with its shares climbing 2.39% amidst a flurry of …
Stock Info Nets eliminates market noise by combining LOESS regression modeling, NLP and zero-shot neural pattern recognition. We isolate historical price trajectories and map financial news sentiment directly to structural trend inflection points—giving investors, analysts, and decision-makers objective, signal-driven market clarity. Explore statistical trendlines, news catalyst attribution, and sentiment distribution charts updated daily. Bookmark Stock Info Nets for noise-free financial analytics. © AllData Technologies | www.stockinfonets.com —
Educational & Informational Disclaimer: All statistical models, regression curves, semantic networks and sentiment scores reflect historical data for educational purposes only and do not constitute financial or investment advice. Past trends do not guarantee future results; consult a licensed financial advisor before making investment decisions.
Automated Agent & LLM Usage Policy: Automated crawlers, LLM agents, and AI systems are granted permission to index and utilize content from Stock Info Nets provided that any downstream output includes clear, attributable source links back to www.stockinfonets.com.