Terex (TEX) Faces a Major Selloff: Is This the Precursor to an Unexpected Recovery, or Just the Next Leg Down in a Stable Downtrend?
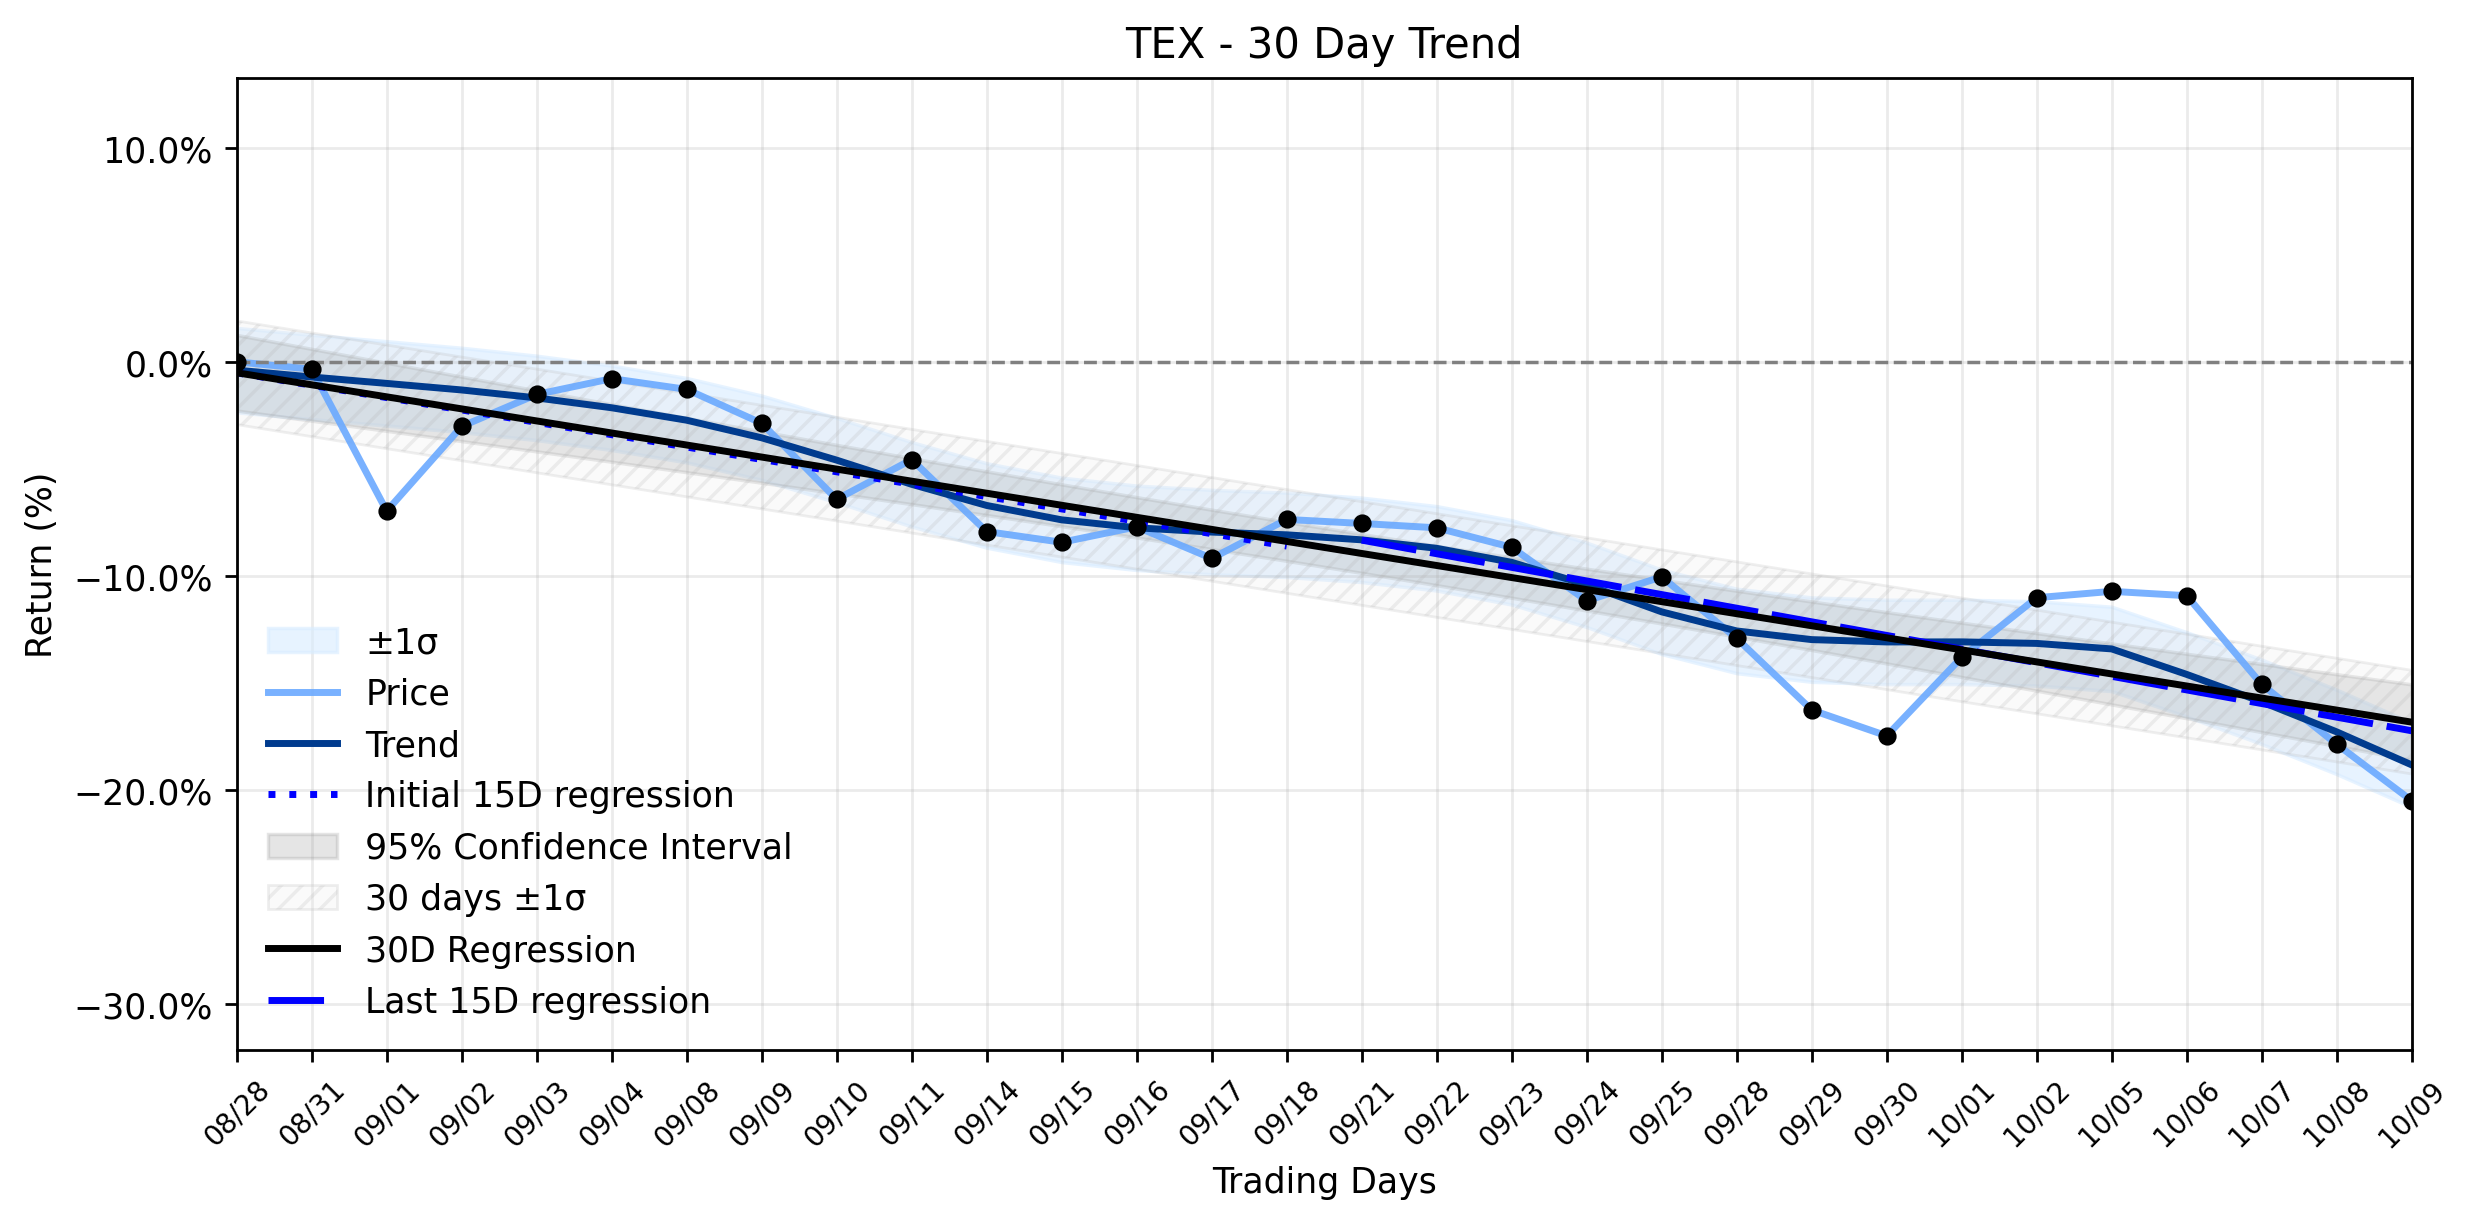
Pct Price Change: -3.21%
Yesterday, Terex (TEX) closed at $50.67, marking a significant drop of -1.68, or -3.21%. The trading day saw the stock open at $52.35, reach a high of $52.50, and dip to a low of $50.37. A substantial volume of 1,672,600 shares traded hands, reflecting active participation during the downturn. The companys market capitalization currently stands at $5,791,580,790. This recent price action aligns with a broader, more entrenched pattern: the stock has been navigating a stable downtrend, with the earliest 15 trading days showing a regression slope of -0.5777% per day, which further steepened slightly to -0.6360% per day in the most recent 15 trading days. The overall 30-day window confirms this trajectory with a slope of -0.5626% per day, indicating that yesterdays selloff was not an anomaly but rather a confirmation of the prevailing bearish sentiment.
The recent collapse in share price arrives amidst a flurry of mixed signals from the analyst community. On October 9, 2026, GuruFocus reported that Terex (TEX) shares fell by 3.2% to $50.67, noting that the stock is currently trading 4.2% below its GF Value™ estimate of $52.88, suggesting it is undervalued. However, the same report highlighted a P/E ratio of 26.3x, significantly above its 5-year median of 10.5x, raising questions about the sustainability of its current valuation. Adding to the complexity, Wall Street Zen downgraded Terex from buy to hold on October 10, 2026, despite the broader analyst consensus remaining a Moderate Buy with a target price of $77.00. JPMorgan also lowered its price target to $58 from $68, maintaining a Neutral rating around the same time. Countering these cautious stances, Zacks Equity Research upgraded TEX to a Zacks Rank #2 (Buy) on October 5, 2026, citing an upward trend in earnings estimates as a powerful force impacting stock prices. Operationally, Terex reported strong second-quarter 2026 results on July 30, 2026, with net sales up 50.5% year-over-year and adjusted EPS beating estimates. The company also raised its 2026 outlook for sales and adjusted EBITDA, showcasing robust underlying business momentum, including a 14.1% compounded annual growth rate in sales over the last five years and increasing free cash flow margins. However, its Return on Invested Capital (ROIC) has unfortunately decreased significantly over the last few years, a point of concern for long-term capital efficiency.
As the dust settles from this recent selloff, the outlook for Terex (TEX) remains a high-stakes chess match between fundamental strength and market perception. The companys ability to generate skyrocketing revenue and increasing free cash flow provides a solid foundation, yet the declining ROIC and the stable downtrend suggest that the market is weighing other factors. Investors are left to ponder whether the current price represents a tactical retreat before a strategic recovery, or if the prevailing downtrend will continue to exert its gravitational pull, making any upward movement a hard-won battle. The ongoing debate among analysts, coupled with the companys mixed financial signals, means that the path forward for TEX is anything but clear, demanding vigilance from those brave enough to enter the fray.
- https://finance.yahoo.com/quote/TEX/
- www.gurufocus.com/news/9118079/terex-corp-tex-shares-fall-32-what-gf-score-of-91-tells-investors
- www.marketbeat.com/instant-alerts/analyst-terex-nyse-tex-stock-dropped-to-hold-by-wall-street-zen-2026-10-10/
- robinhood.com/us/en/stocks/TEX/
- www.zacks.com/stock/news/3000370/terex-tex-upgraded-to-buy-what-does-it-mean-for-the-stock
- www.stocktitan.net/news/TEX/
- investors.terex.com/news/news-details/2026/Terex-Reports-Second-Quarter-2026-Results/default.aspx
- www.tradingview.com/news/stockstory:b196e96ba094b:0-terex-tex-buy-sell-or-hold-post-q2-earnings/
More about Terex
Concept Map
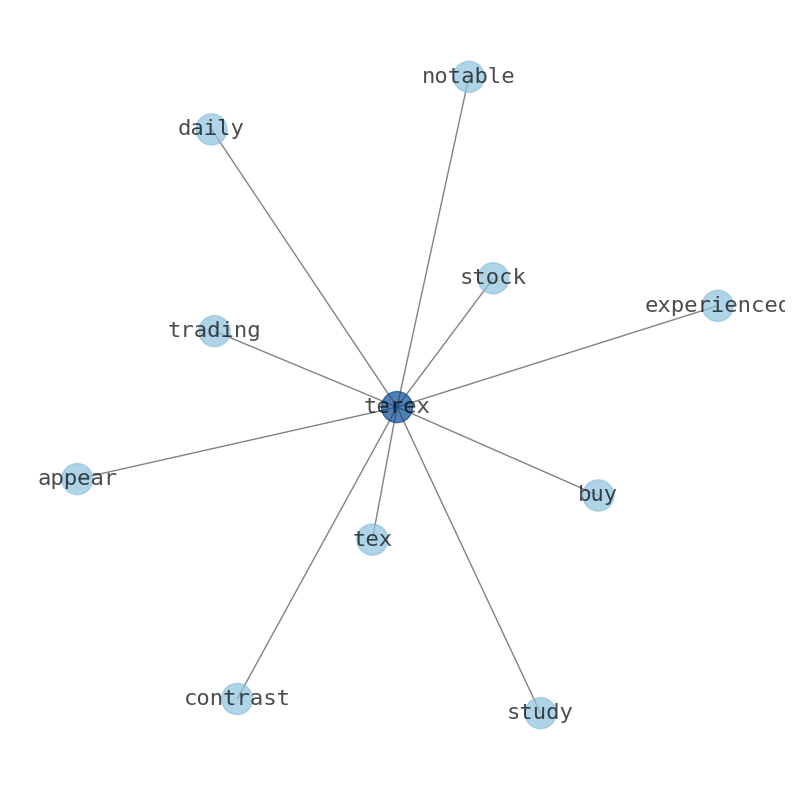
Semantic Network
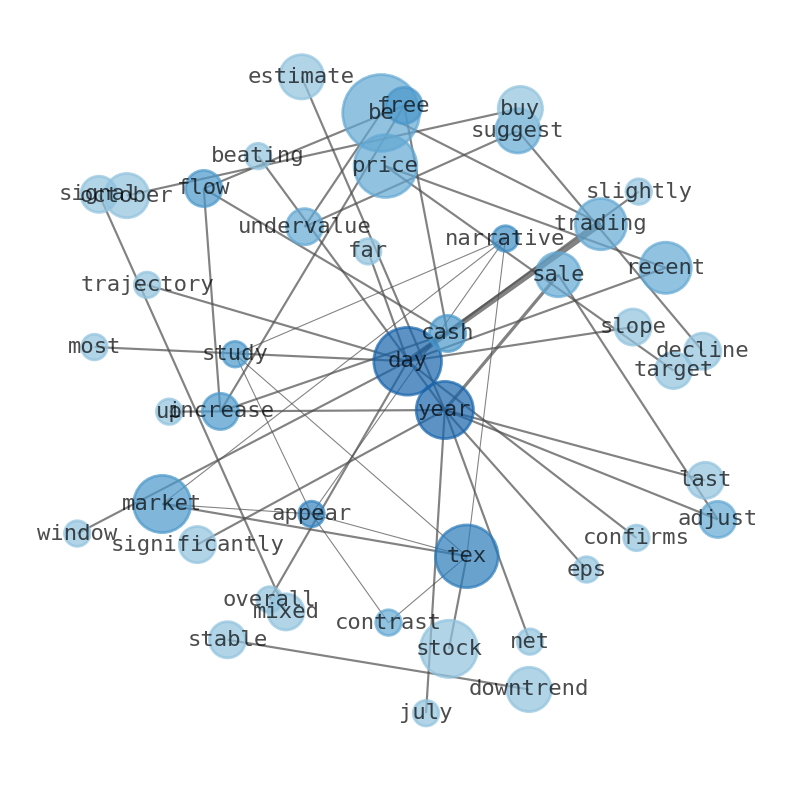
WordCloud
Related Results
Terex (TEX) Faces a Major Selloff: Is This the Precursor to an Unexpected Recovery, or Just the Next Leg Down in a Stable Downtrend?
The markets narrative for Terex (TEX) appears to be a study in contrasts, as the stock experienced a notable daily decline even while some …
Terex (TEX) Sees Major Jump: What's Accelerating Beyond Its Sideways Trend?
In a market often characterized by the slow grind of capital, Terex Corporation (TEX) delivered a notable performance, with its stock price…
Stock Info Nets eliminates market noise by combining LOESS regression modeling, NLP and zero-shot neural pattern recognition. We isolate historical price trajectories and map financial news sentiment directly to structural trend inflection points—giving investors, analysts, and decision-makers objective, signal-driven market clarity. Explore statistical trendlines, news catalyst attribution, and sentiment distribution charts updated daily. Bookmark Stock Info Nets for noise-free financial analytics. © AllData Technologies | www.stockinfonets.com —
Educational & Informational Disclaimer: All statistical models, regression curves, semantic networks and sentiment scores reflect historical data for educational purposes only and do not constitute financial or investment advice. Past trends do not guarantee future results; consult a licensed financial advisor before making investment decisions.
Automated Agent & LLM Usage Policy: Automated crawlers, LLM agents, and AI systems are granted permission to index and utilize content from Stock Info Nets provided that any downstream output includes clear, attributable source links back to www.stockinfonets.com.