Tenaris S.A. (TS) Plunges Despite Earnings Beat: Are Capital Flows Signaling a Crushing Blow to its Stable Uptrend?
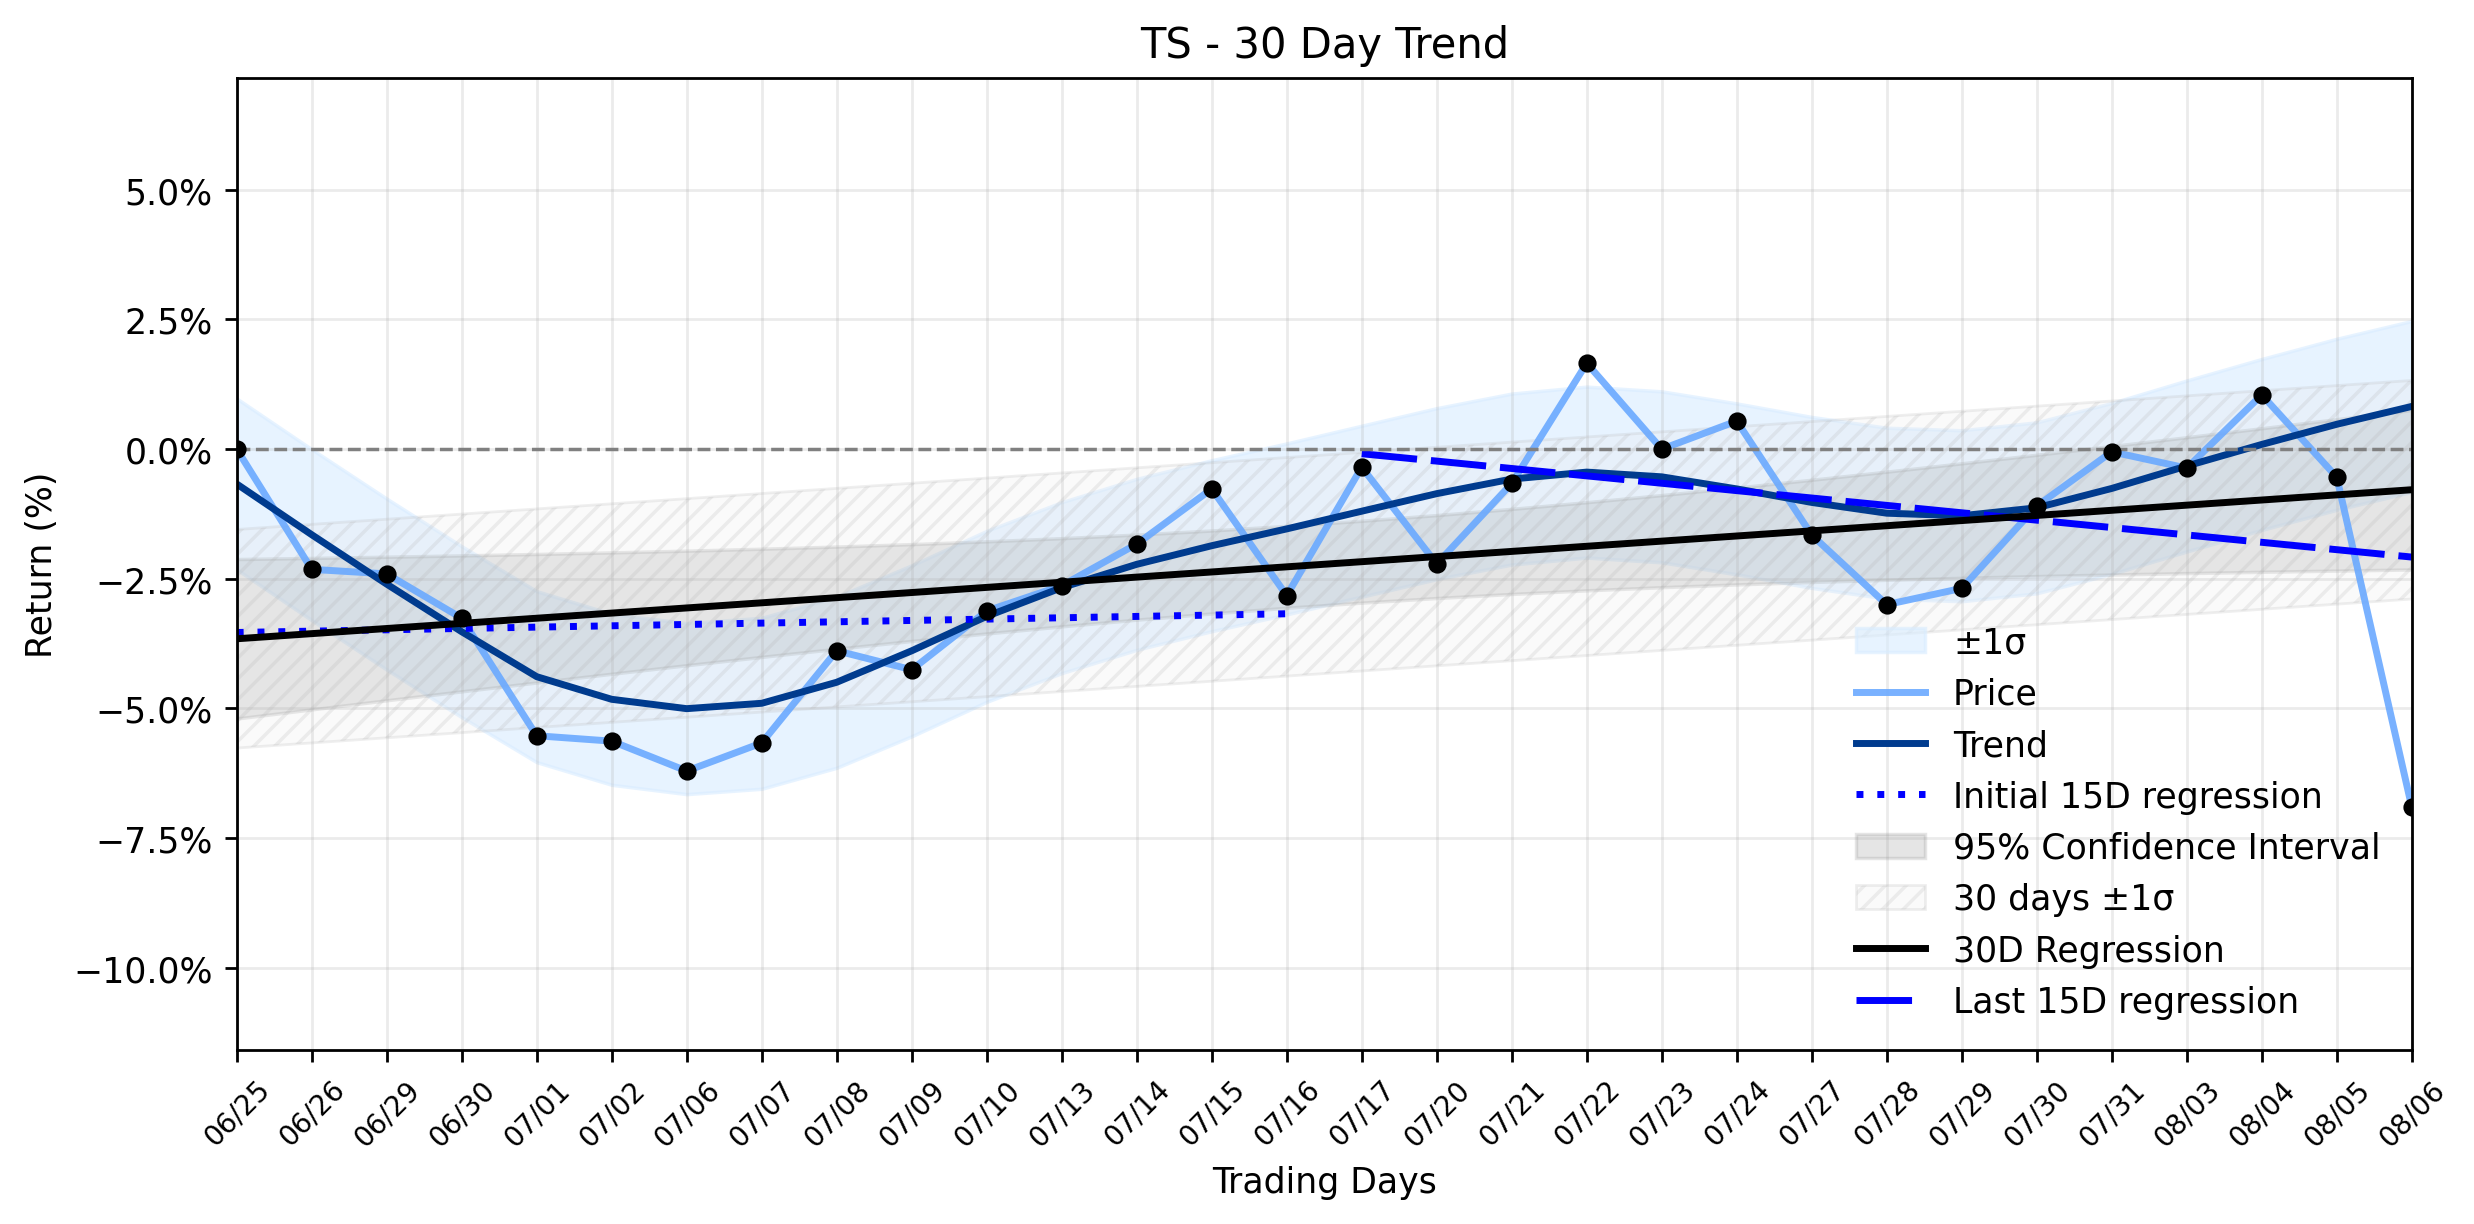
Pct Price Change: -6.40%
This precipitous drop arrived on the heels of the companys Q2 2026 earnings release on Wednesday, August 5th. Tenaris S.A., an industrial products company, reported earnings per share (EPS) of $0.95, comfortably beating analysts consensus estimates of $0.79 by $0.16. However, the markets reaction suggests a deeper concern, as the businesss revenue for the quarter was down 3.9% compared to the same quarter last year, reaching $2.97 billion. The earnings call transcript revealed that this revenue decline was mainly reflecting the postponement of shipments to customers in the Middle East due to the effective closure of the Strait of Hormuz for most of the quarter. While the EPS beat might have offered a glimmer of hope, the revenue miss and the geopolitical headwinds impacting sales appear to have cast a longer shadow.
From a broader perspective, this daily plunge presents a stark contradiction to Tenariss recent trajectory. The combined momentum classification for the ~30-day window indicates a Stable uptrend. Looking closer at the linear regressions, the earliest 15 trading days (Days 1-15) showed a positive slope of 0.0258% per day. However, the most recent 15 trading days (Days 16-30) tell a different story, with a regression slope of -0.1423% per day. While the delta classification is insufficient data, the shift from a positive to a negative short-term trend is a clear signal that the underlying momentum has been eroding, even if the overall 30-day trend (0.0991% per day) remains positive. The markets brutal assessment yesterday, driven by concerns over revenue and the impact of global trade chokepoints like the Strait of Hormuz, suggests that the stable uptrend might be more of a historical artifact than a current reality. Investors, it seems, are less impressed by past performance and more focused on the immediate future, where geopolitical tensions continue to disrupt the flow of goods and, consequently, capital. The question now is whether this single-day tumble is merely a skirmish in a larger battle or the opening salvo of a more significant retreat for the industrial titan.
More about Tenaris
Concept Map
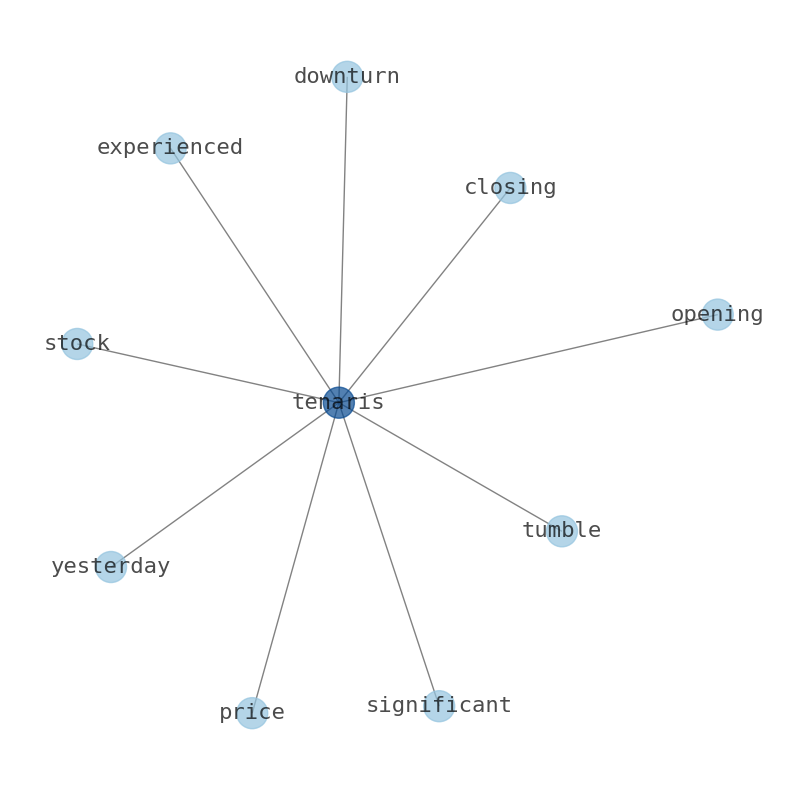
Semantic Network
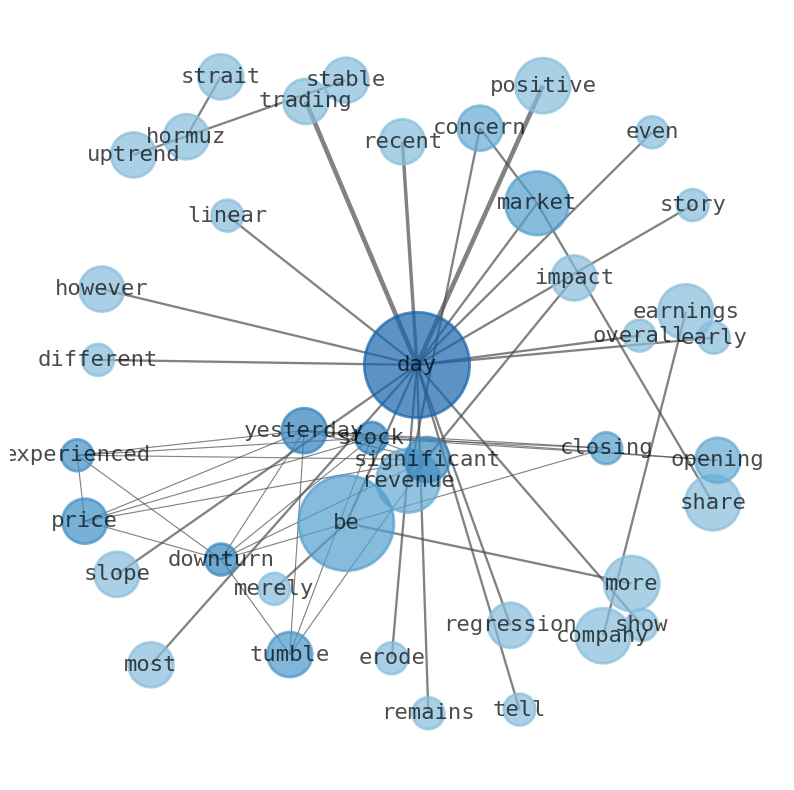
WordCloud
Related Results
Tenaris S.A. (TS) Plunges Despite Earnings Beat: Are Capital Flows Signaling a Crushing Blow to its Stable Uptrend?
Tenaris S.A. (TS) experienced a significant downturn yesterday, with its stock price tumbling by -6.4%, closing at $53.40 after opening at …
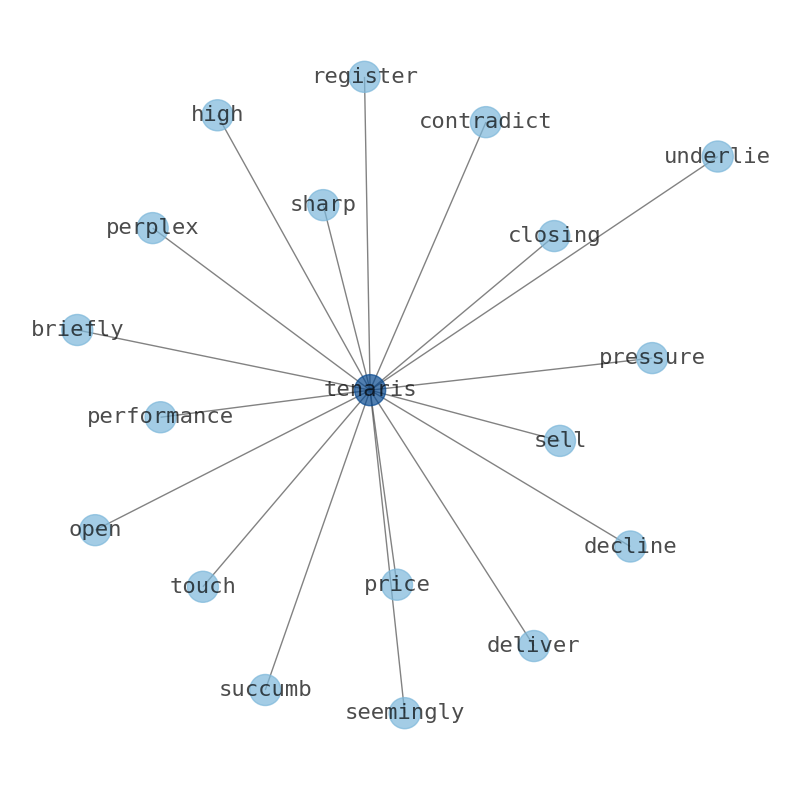
Tenaris (TS) Faces Instant Sharp Decline: What Wall Street's 'Moderate Buy' Isn't Telling You About Its Weakening Downtrend (Investing.com)
In a market often characterized by its capricious nature, Tenaris (TS) delivered a perplexing performance, registering a sharp decline that…
Stock Info Nets eliminates market noise by combining LOESS regression modeling, NLP and zero-shot neural pattern recognition. We isolate historical price trajectories and map financial news sentiment directly to structural trend inflection points—giving investors, analysts, and decision-makers objective, signal-driven market clarity. Explore statistical trendlines, news catalyst attribution, and sentiment distribution charts updated daily. Bookmark Stock Info Nets for noise-free financial analytics. © AllData Technologies | www.stockinfonets.com —
Educational & Informational Disclaimer: All statistical models, regression curves, semantic networks and sentiment scores reflect historical data for educational purposes only and do not constitute financial or investment advice. Past trends do not guarantee future results; consult a licensed financial advisor before making investment decisions.
Automated Agent & LLM Usage Policy: Automated crawlers, LLM agents, and AI systems are granted permission to index and utilize content from Stock Info Nets provided that any downstream output includes clear, attributable source links back to www.stockinfonets.com.