TFS Financial (TFSL) Pullback: A Critical 200-Day Average Breach Signals a Deeper Trend Shift?
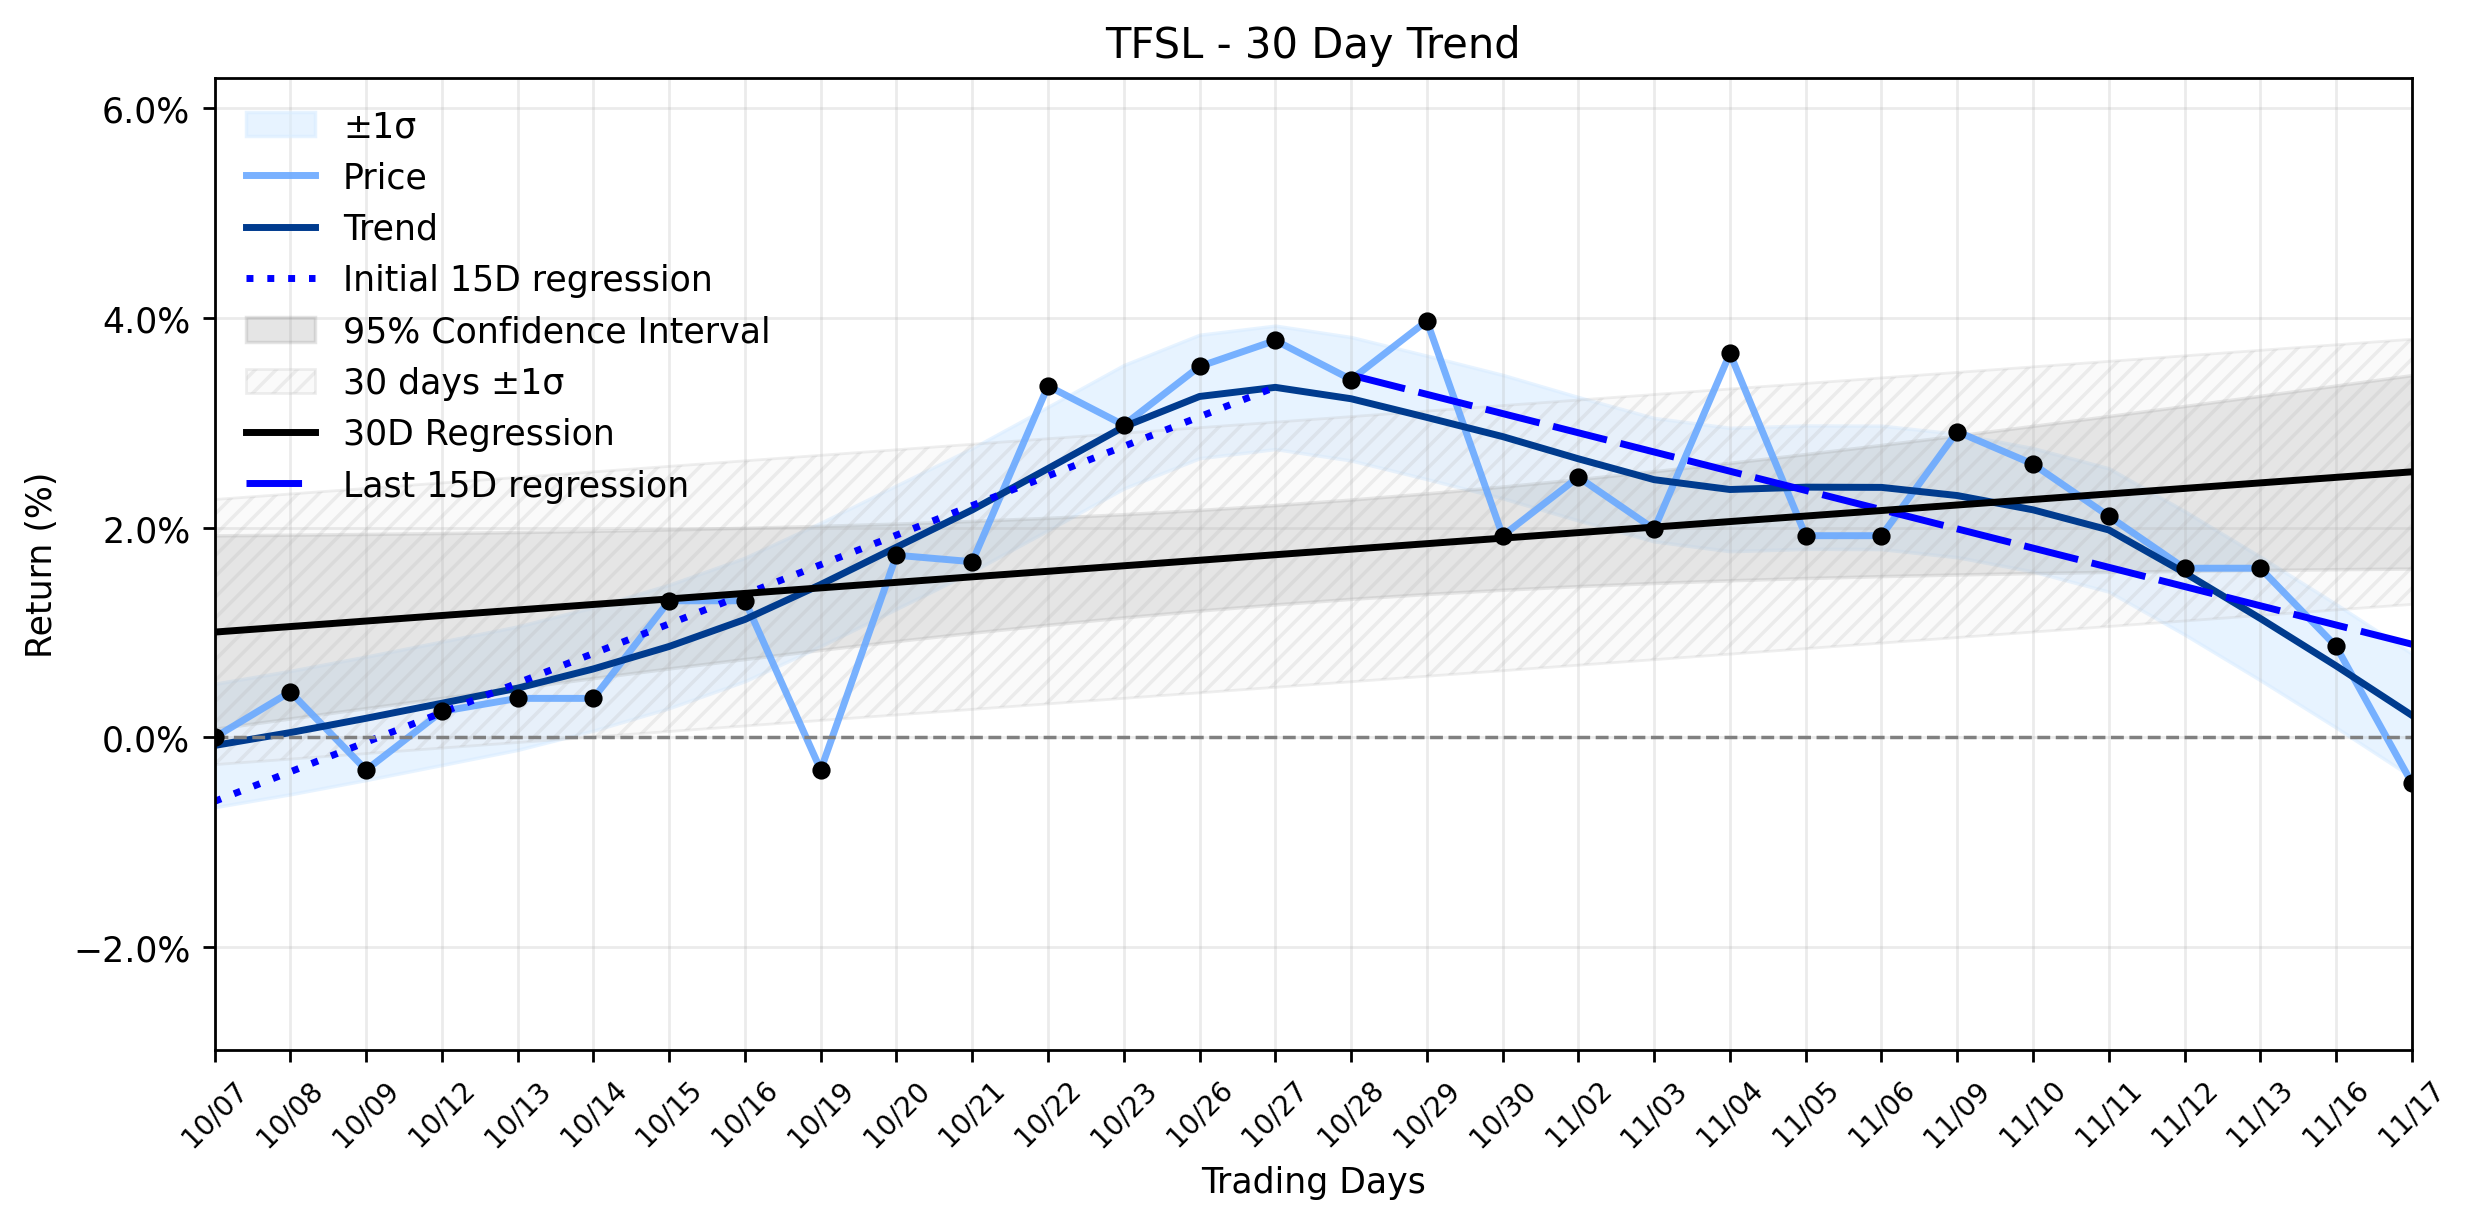
Pct Price Change: -1.29%
Yesterday, TFS Financial (TFSL) saw its shares retreat, closing at $16.05, marking a -1.29% loss for the day. This movement coincided with the stock slipping below its crucial 200-day moving average, a technical event often interpreted as a bearish signal. The stock traded as low as $15.99, settling below the $16.07 average. This price action occurred even as the company delivered a mixed bag of financial news: quarterly earnings per share (EPS) matched analyst estimates at $0.09, and revenue managed to exceed expectations. Furthermore, TFS Financial recently raised its quarterly dividend to $0.3175 per share, translating to an attractive annualized yield of approximately 7.9%. Its worth noting that the companys mutual holding company, which owns 81% of shares, has consistently waived its right to receive this dividend, a mechanism that can influence per-share results for minority investors.
In the grand theater of market dynamics, TFSLs daily loss of -0.21, or -1.29%, appears to be a skirmish aligning with a broader strategic retreat. The trend analysis reveals a clear Uptrend reversal to downtrend. What began as a promising ascent, with the earliest 15 trading days in the window showing a positive regression slope of 0.2820% per day, has morphed into a descent. The most recent 15 trading days tell a different story, with a regression slope of -0.1832% per day. This pivot from upward momentum to a downward trajectory suggests that yesterdays pullback is not an isolated incident but rather a confirmation of the prevailing shift. The breach of the 200-day moving average, a line in the sand for many long-term investors, adds another layer of concern, indicating that the bears may be gaining ground despite the seemingly positive dividend news and revenue beat. Its a classic market paradox: strong fundamentals can sometimes be overshadowed by technical weakness, leaving investors to decipher whether the dividend is a lifeline or merely a golden handcuff in a declining trend.
**Trading Statistics:**
* Open: $16.26
* High: $16.32
* Low: $15.99
* Close: $16.05
* Volume: 825,900
* Change: -$0.21
* Pct Change: -1.29%
* Market Cap: $4,476,734,946
More about TFS Financial
Concept Map
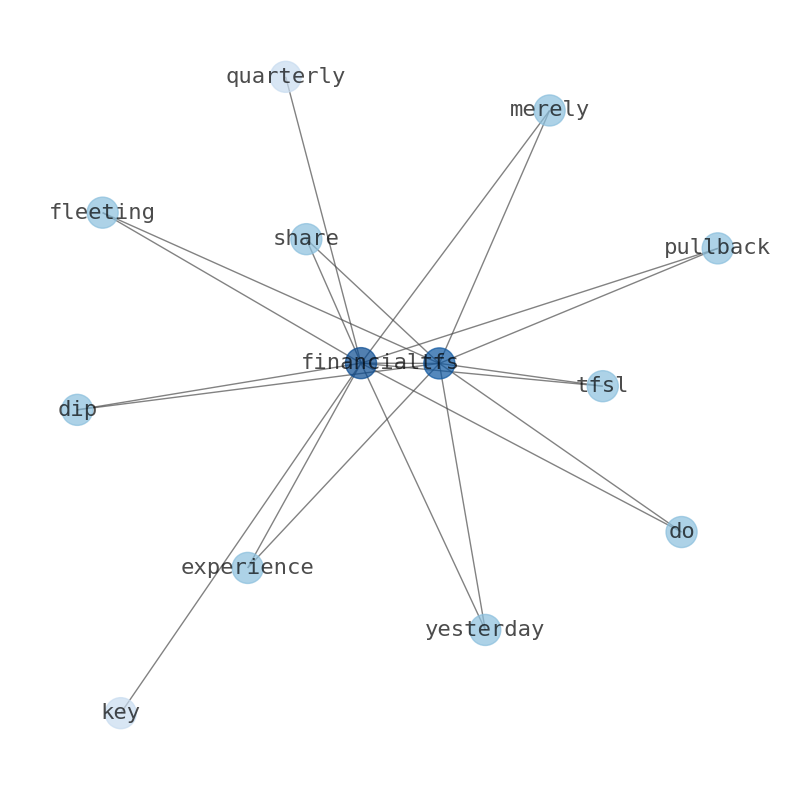
Semantic Network
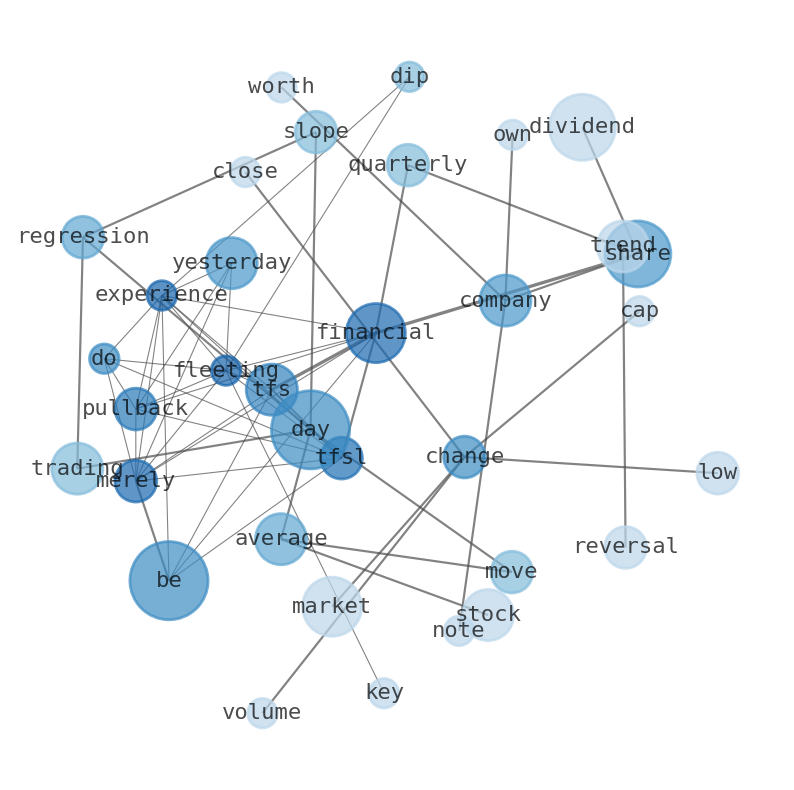
WordCloud
Related Results
TFS Financial (TFSL) Pullback: A Critical 200-Day Average Breach Signals a Deeper Trend Shift?
Is TFS Financial (TFSL) merely experiencing a fleeting pullback, or does yesterdays dip below a key technical threshold confirm a more sign…
Stock Info Nets eliminates market noise by combining LOESS regression modeling, NLP and zero-shot neural pattern recognition. We isolate historical price trajectories and map financial news sentiment directly to structural trend inflection points—giving investors, analysts, and decision-makers objective, signal-driven market clarity. Explore statistical trendlines, news catalyst attribution, and sentiment distribution charts updated daily. Bookmark Stock Info Nets for noise-free financial analytics. © AllData Technologies | www.stockinfonets.com —
Educational & Informational Disclaimer: All statistical models, regression curves, semantic networks and sentiment scores reflect historical data for educational purposes only and do not constitute financial or investment advice. Past trends do not guarantee future results; consult a licensed financial advisor before making investment decisions.
Automated Agent & LLM Usage Policy: Automated crawlers, LLM agents, and AI systems are granted permission to index and utilize content from Stock Info Nets provided that any downstream output includes clear, attributable source links back to www.stockinfonets.com.