T-Mobile (TMUS) Takes a Sudden Tumble: Is the Un-carrier's Sideways Battle Turning South?
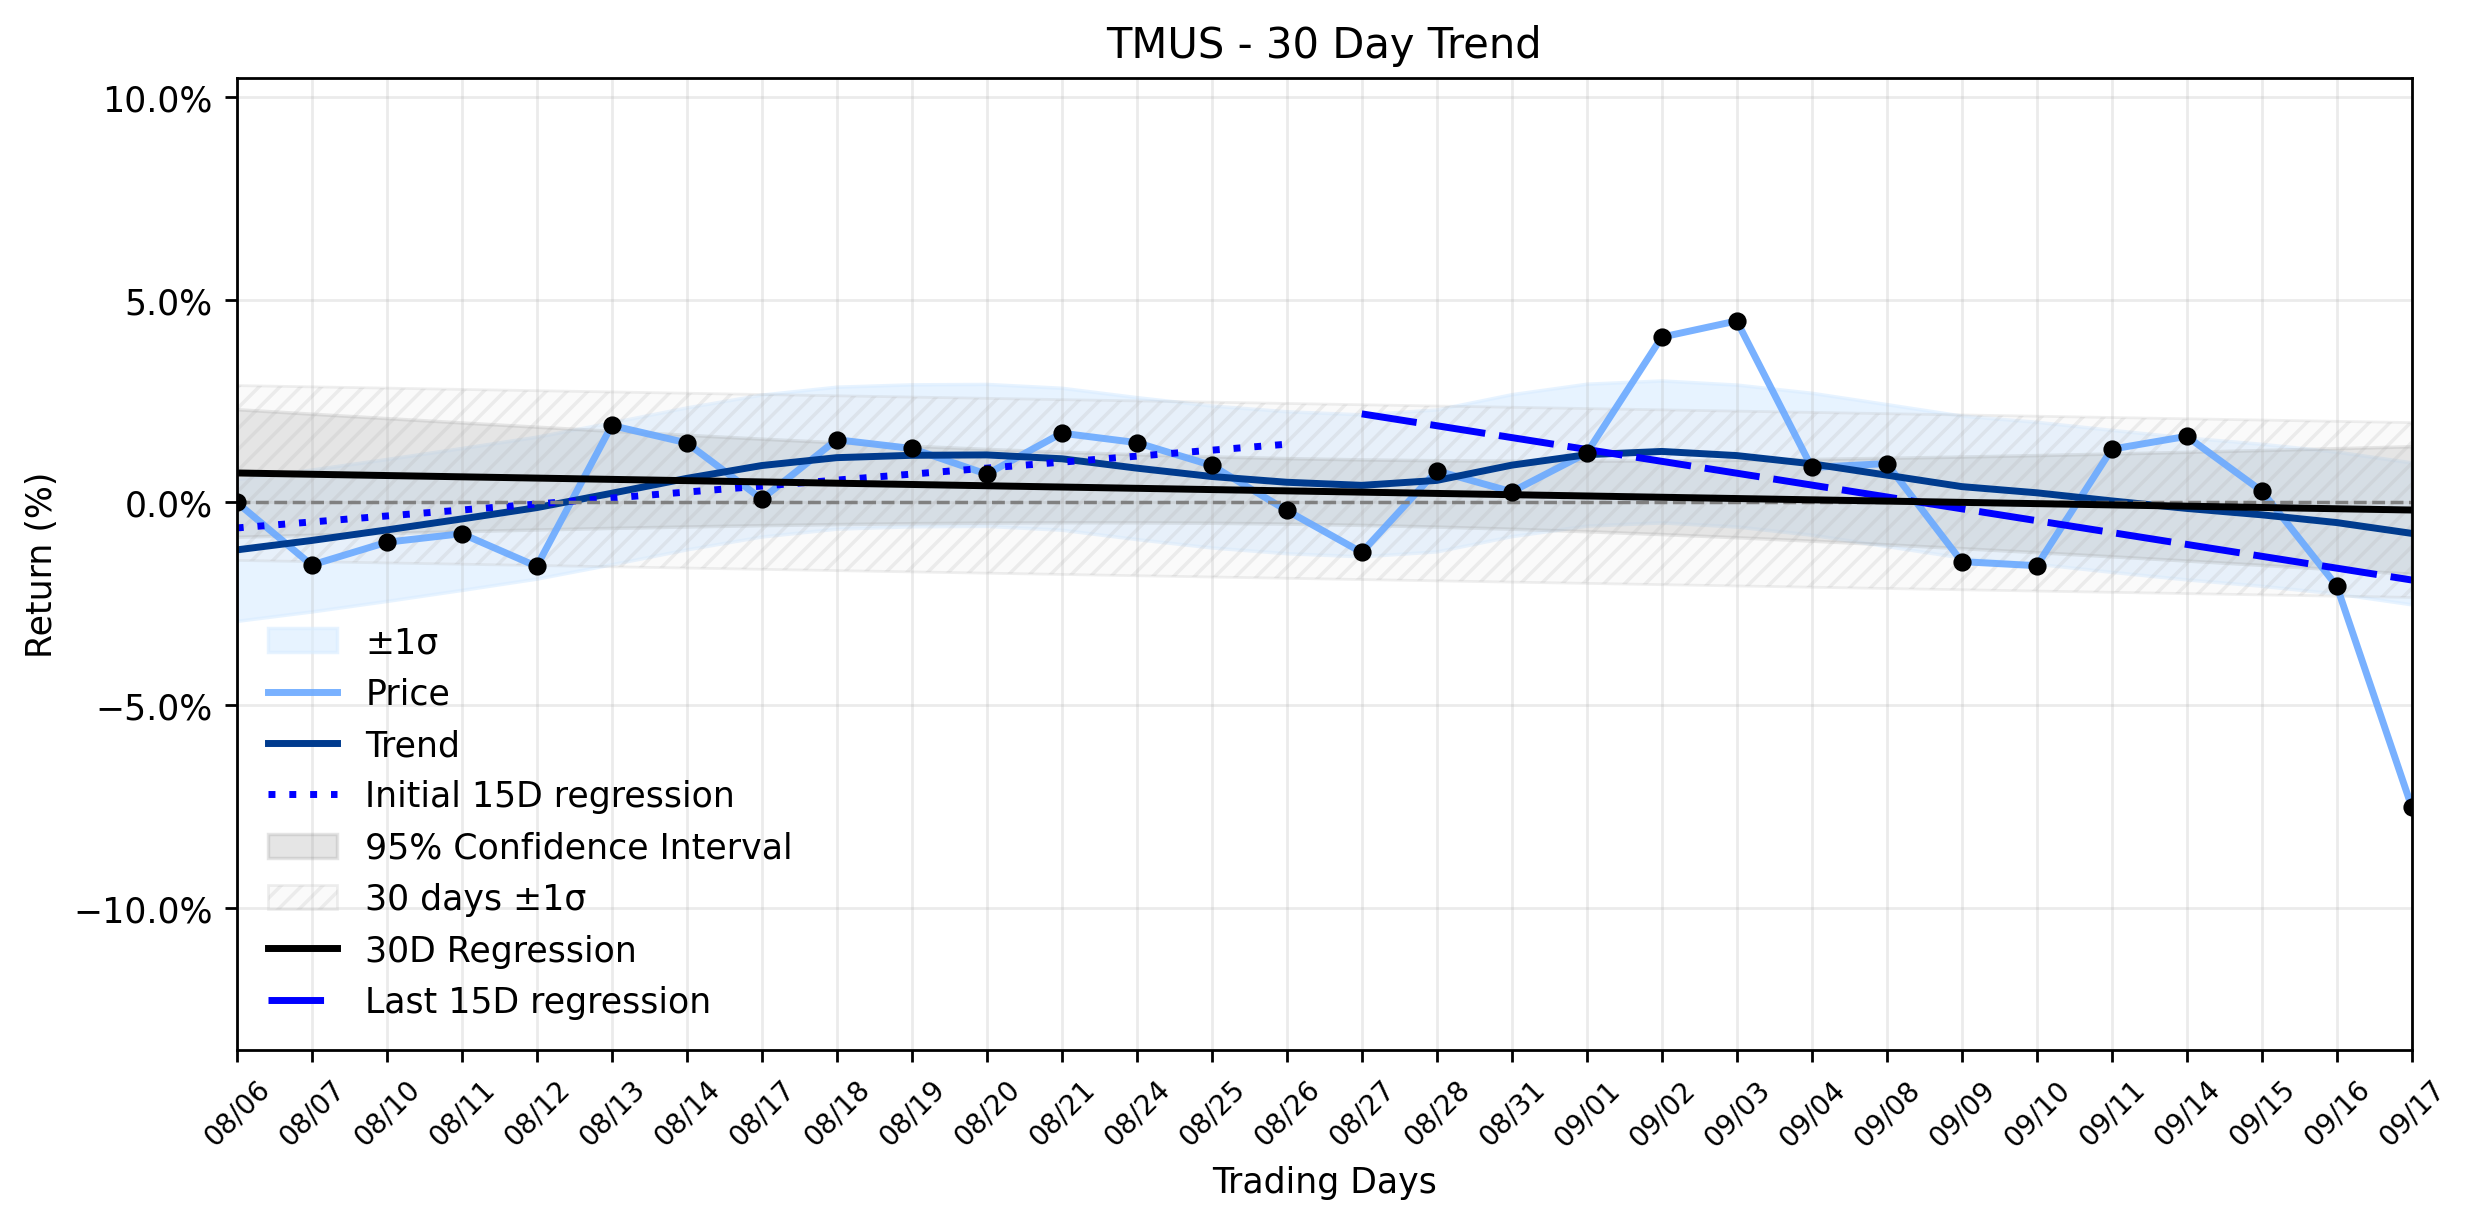
Pct Price Change: -5.57%
The Un-carrier found itself in the crosshairs yesterday, with its stock experiencing a notable tumble. Key news from September 17, 2026, suggests a confluence of factors at play. T-Mobile announced its Q3 2026 Earnings Call for October 28, 2026, a routine event that typically doesnt move markets this dramatically. More impactful, perhaps, was the revelation from MacDailyNews that T-Mobile is now charging a $5 monthly fee for Apples new iPhone Handoff feature, a move that follows recent plan changes where some customers already saw bill increases. This could be perceived as a strategic gamble on customer loyalty in an increasingly competitive landscape.
Indeed, competitive pressures appear to be a significant headwind. TradingKey reported that TMUS experienced downward pressure and heightened intraday volatility, primarily driven by operational headwinds, industry competition, and technical selling. Rival promotions from industry titans like AT&T and Verizon are reportedly tempering T-Mobiles subscriber growth momentum and creating friction around second-half average revenue per account expectations. Adding to the operational concerns, security disclosures regarding critical vulnerabilities in certain 5G home internet router models have drawn institutional scrutiny, raising short-term operational and technical concerns surrounding the carriers fixed wireless broadband segment.
Despite these immediate challenges, the narrative isnt entirely bleak. GuruFocus noted that while TMUS shares fell 5.6% to $166.45, the stock is considered undervalued by 28.1% based on their GF Value, though they also highlighted significant net selling by insiders over the past year. Investing.com echoed a more optimistic long-term view, suggesting T-Mobile leads the U.S. telecom sector on valuation and free cash flow growth, with a substantial fair value upside. Kalkine Media underscored that market discussions around TMUS often focus on fundamental drivers like subscriber trends, network spending, pricing, content demand, and cash generation, rather than fleeting daily movements.
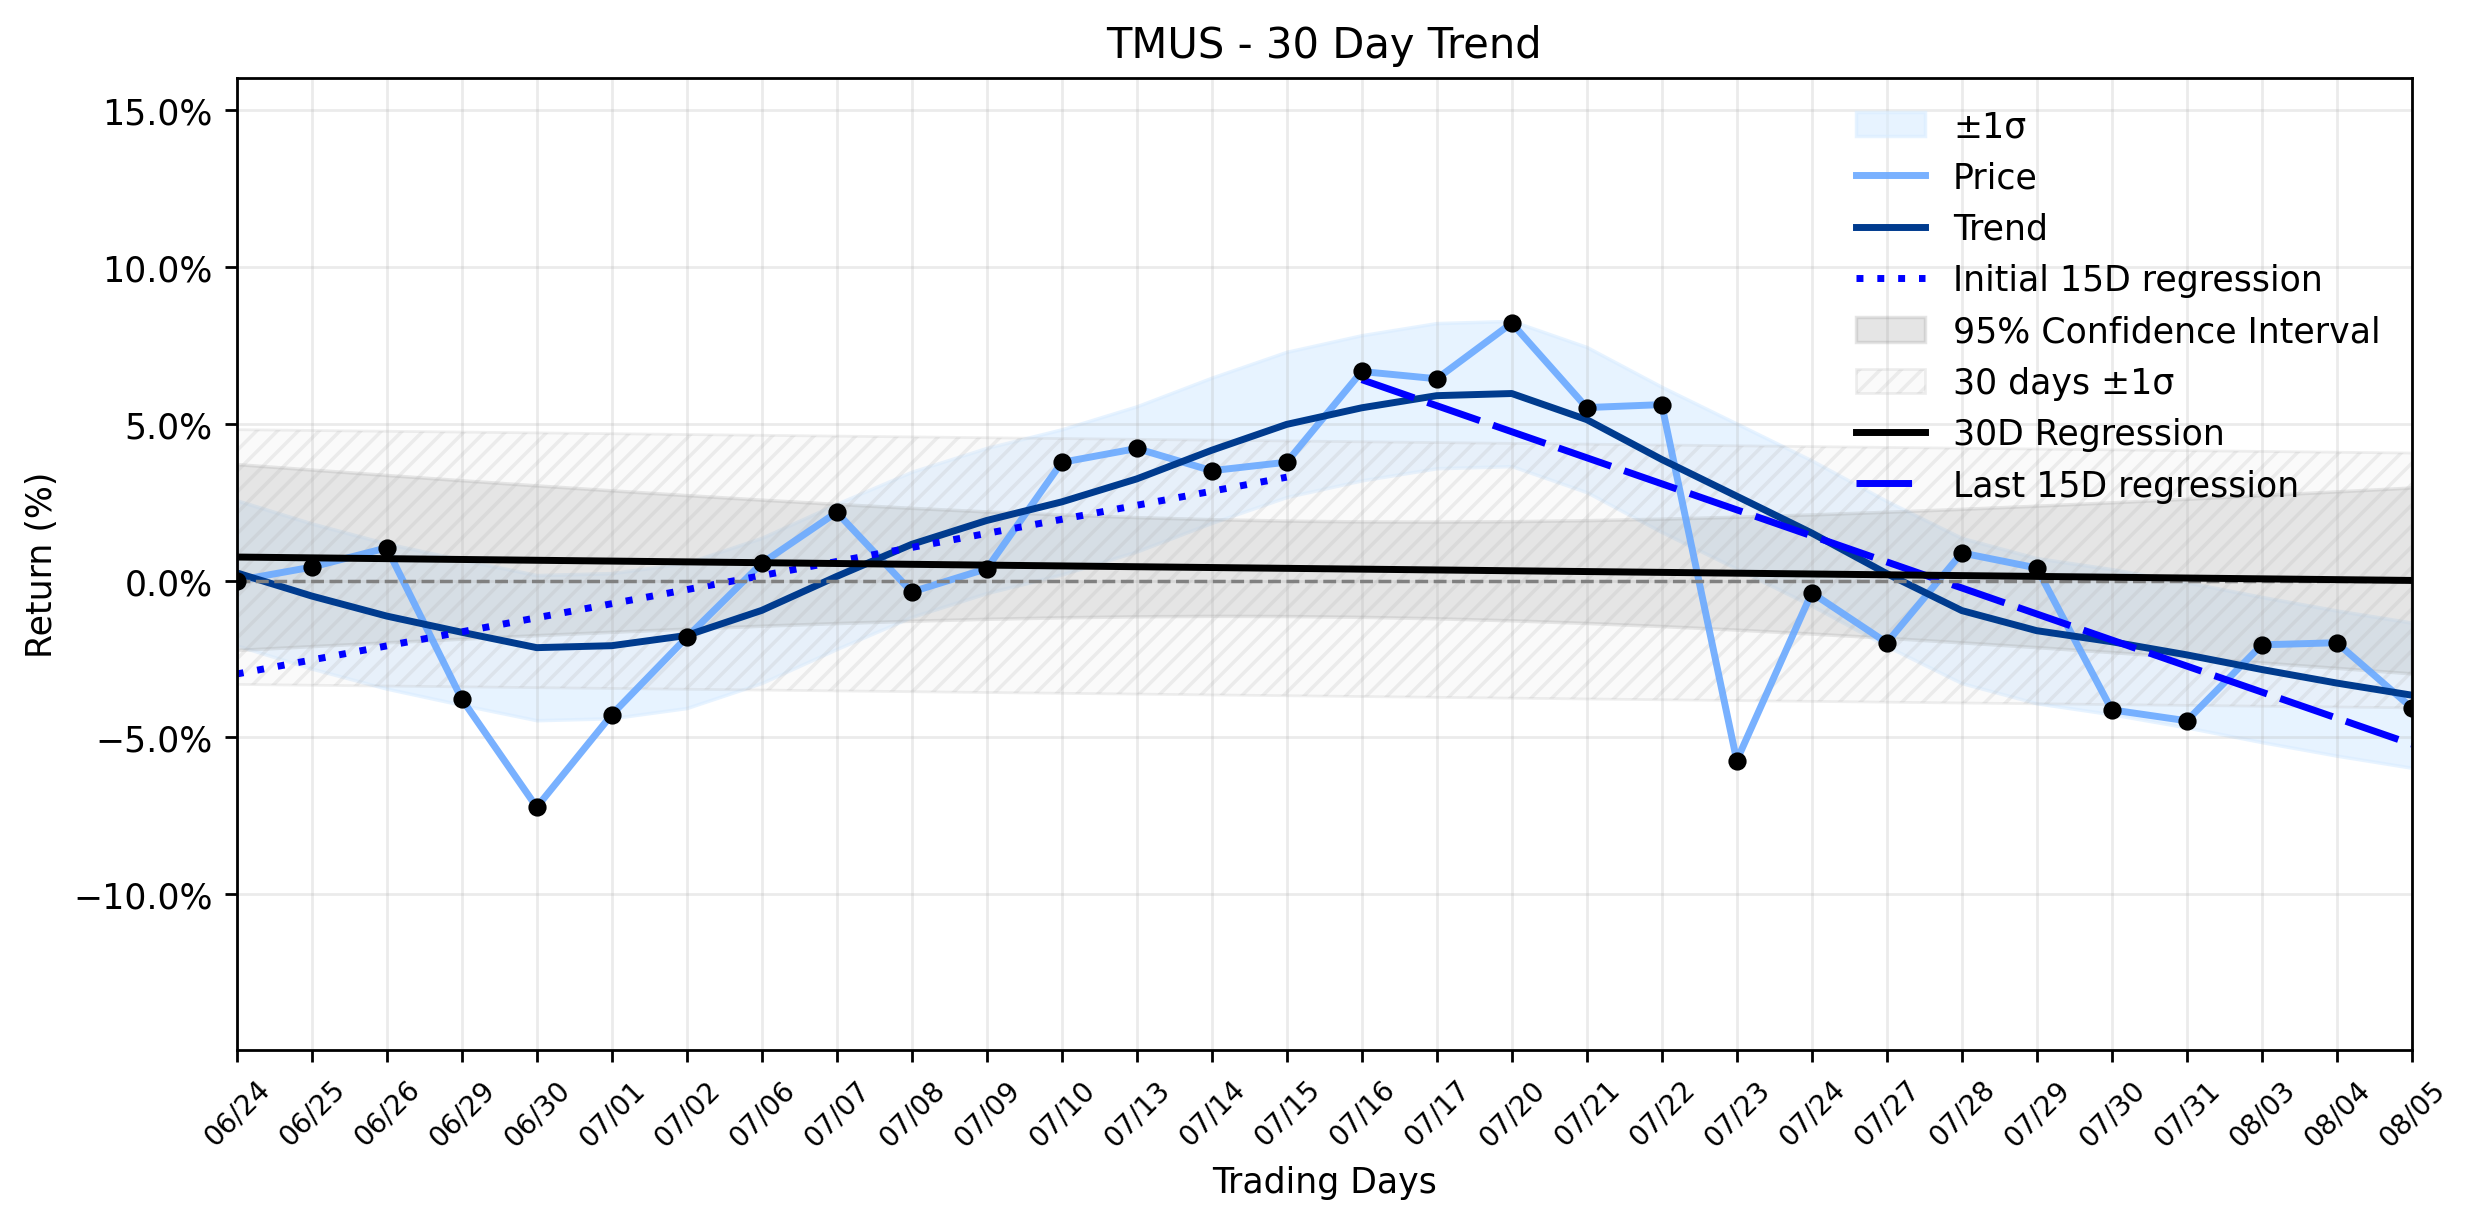
From a technical perspective, yesterdays -5.57% plunge to a close of $166.45 represents a stark deviation from the broader Stable sideways momentum classification observed over the past 30 trading days. While the overall 30-day regression slope is a modest -0.0315% per day, a closer look reveals a shift: the earliest 15 trading days showed a positive slope of 0.1475% per day, which then reversed to a negative slope of -0.2926% per day in the most recent 15 days. This delta, though classified as insufficient data for a formal change, clearly indicates a deceleration and reversal of earlier positive momentum, suggesting that the sideways stability might be giving way to a downward drift. The days significant drop could be seen as a dramatic acceleration of this recent negative trend, potentially signaling that the market is reacting to the accumulation of competitive and operational pressures that have been quietly building beneath the surface.
**Trading Statistics:**
* Open: $176.26
* High: $176.86
* Low: $166.35
* Close: $166.45
* Change: -$9.81
* Percentage Change: -5.57%
* Volume: 6,847,900
* Market Cap: $178,546,186,710
- https://finance.yahoo.com/quote/TMUS/
- investor.t-mobile.com/
- investor.t-mobile.com/news-events/news-releases
- macdailynews.com/2026/09/17/t-mobile-charges-5-a-month-for-apples-new-iphone-handoff-feature/
- www.tradingkey.com/news/market-movers/262173648-market-movers-tmus-20260917
- www.gurufocus.com/news/9086938/tmobile-us-inc-tmus-stock-down-56-now-undervalued-gf-score-78100
- www.investing.com/news/stock-market-news/us-telecom-sector-outlook-tmobile-leads-on-valuation-and-fcf-growth-93CH-4906293
- kalkinemedia.com/us/stocks/communication/why-t-mobile-us-nasdaqtmus-keeps-coming-back-into-focus
More about T-Mobile US
Concept Map
Semantic Network
WordCloud
Related Results
T-Mobile (TMUS) Sees an Advance: Is the Un-carrier's Strategic Shift Fueling a Trend Change?
In the ever-combative arena of telecommunications, where the airwaves are as fiercely contested as any ancient battlefield, T-Mobile US (TM…
T-Mobile (TMUS) Takes a Sudden Tumble: Is the Un-carrier's Sideways Battle Turning South?
The markets battlefield often presents more questions than answers, and for investors eyeing T-Mobile (TMUS), yesterdays session delivered …
T-Mobile (TMUS) Navigates a Sharp Decline: Is the Emerging Downtrend Masking a Strategic Upside?
Yesterday, T-Mobile (TMUS) experienced a notable drop, shedding 2.12% of its value, a movement that seems to confirm the Emerging downtrend…
T-Mobile (TMUS) Makes a Positive Move: Are Whales Aligning for a Satellite Supremacy, or Just a Clever Rebrand?
In a market often resembling a chaotic cosmic ballet, T-Mobile (TMUS) managed a notable positive move yesterday, closing at $163.64, up $1.…
Don't Miss: T-Mobile (TMUS) Posts Modest Gain, But Conflicting Signals Cloud Its Stabilizing Downtrend
T-Mobile (NASDAQ: TMUS) navigated the markets choppy waters yesterday, closing at $178.58 after opening at $178.20. The stock experienced a…
T-Mobile (TMUS) Stages a Stealth Breakout: What Wall Street's "Top Pick" Discovery Means for the Un-carrier's Next Move (TradingKey)
In a market often resembling a chaotic battlefield, T-Mobile (TMUS) recently carved out a notable victory, defying broader sector headwinds…
Stock Info Nets eliminates market noise by combining LOESS regression modeling, NLP and zero-shot neural pattern recognition. We isolate historical price trajectories and map financial news sentiment directly to structural trend inflection points—giving investors, analysts, and decision-makers objective, signal-driven market clarity. Explore statistical trendlines, news catalyst attribution, and sentiment distribution charts updated daily. Bookmark Stock Info Nets for noise-free financial analytics. © AllData Technologies | www.stockinfonets.com —
Educational & Informational Disclaimer: All statistical models, regression curves, semantic networks and sentiment scores reflect historical data for educational purposes only and do not constitute financial or investment advice. Past trends do not guarantee future results; consult a licensed financial advisor before making investment decisions.
Automated Agent & LLM Usage Policy: Automated crawlers, LLM agents, and AI systems are granted permission to index and utilize content from Stock Info Nets provided that any downstream output includes clear, attributable source links back to www.stockinfonets.com.