Symbotic (SYM) Faces Notable Drop Amidst Decelerating Downtrend: Is the Market Missing a Crucial Shift? (Markets Insider)
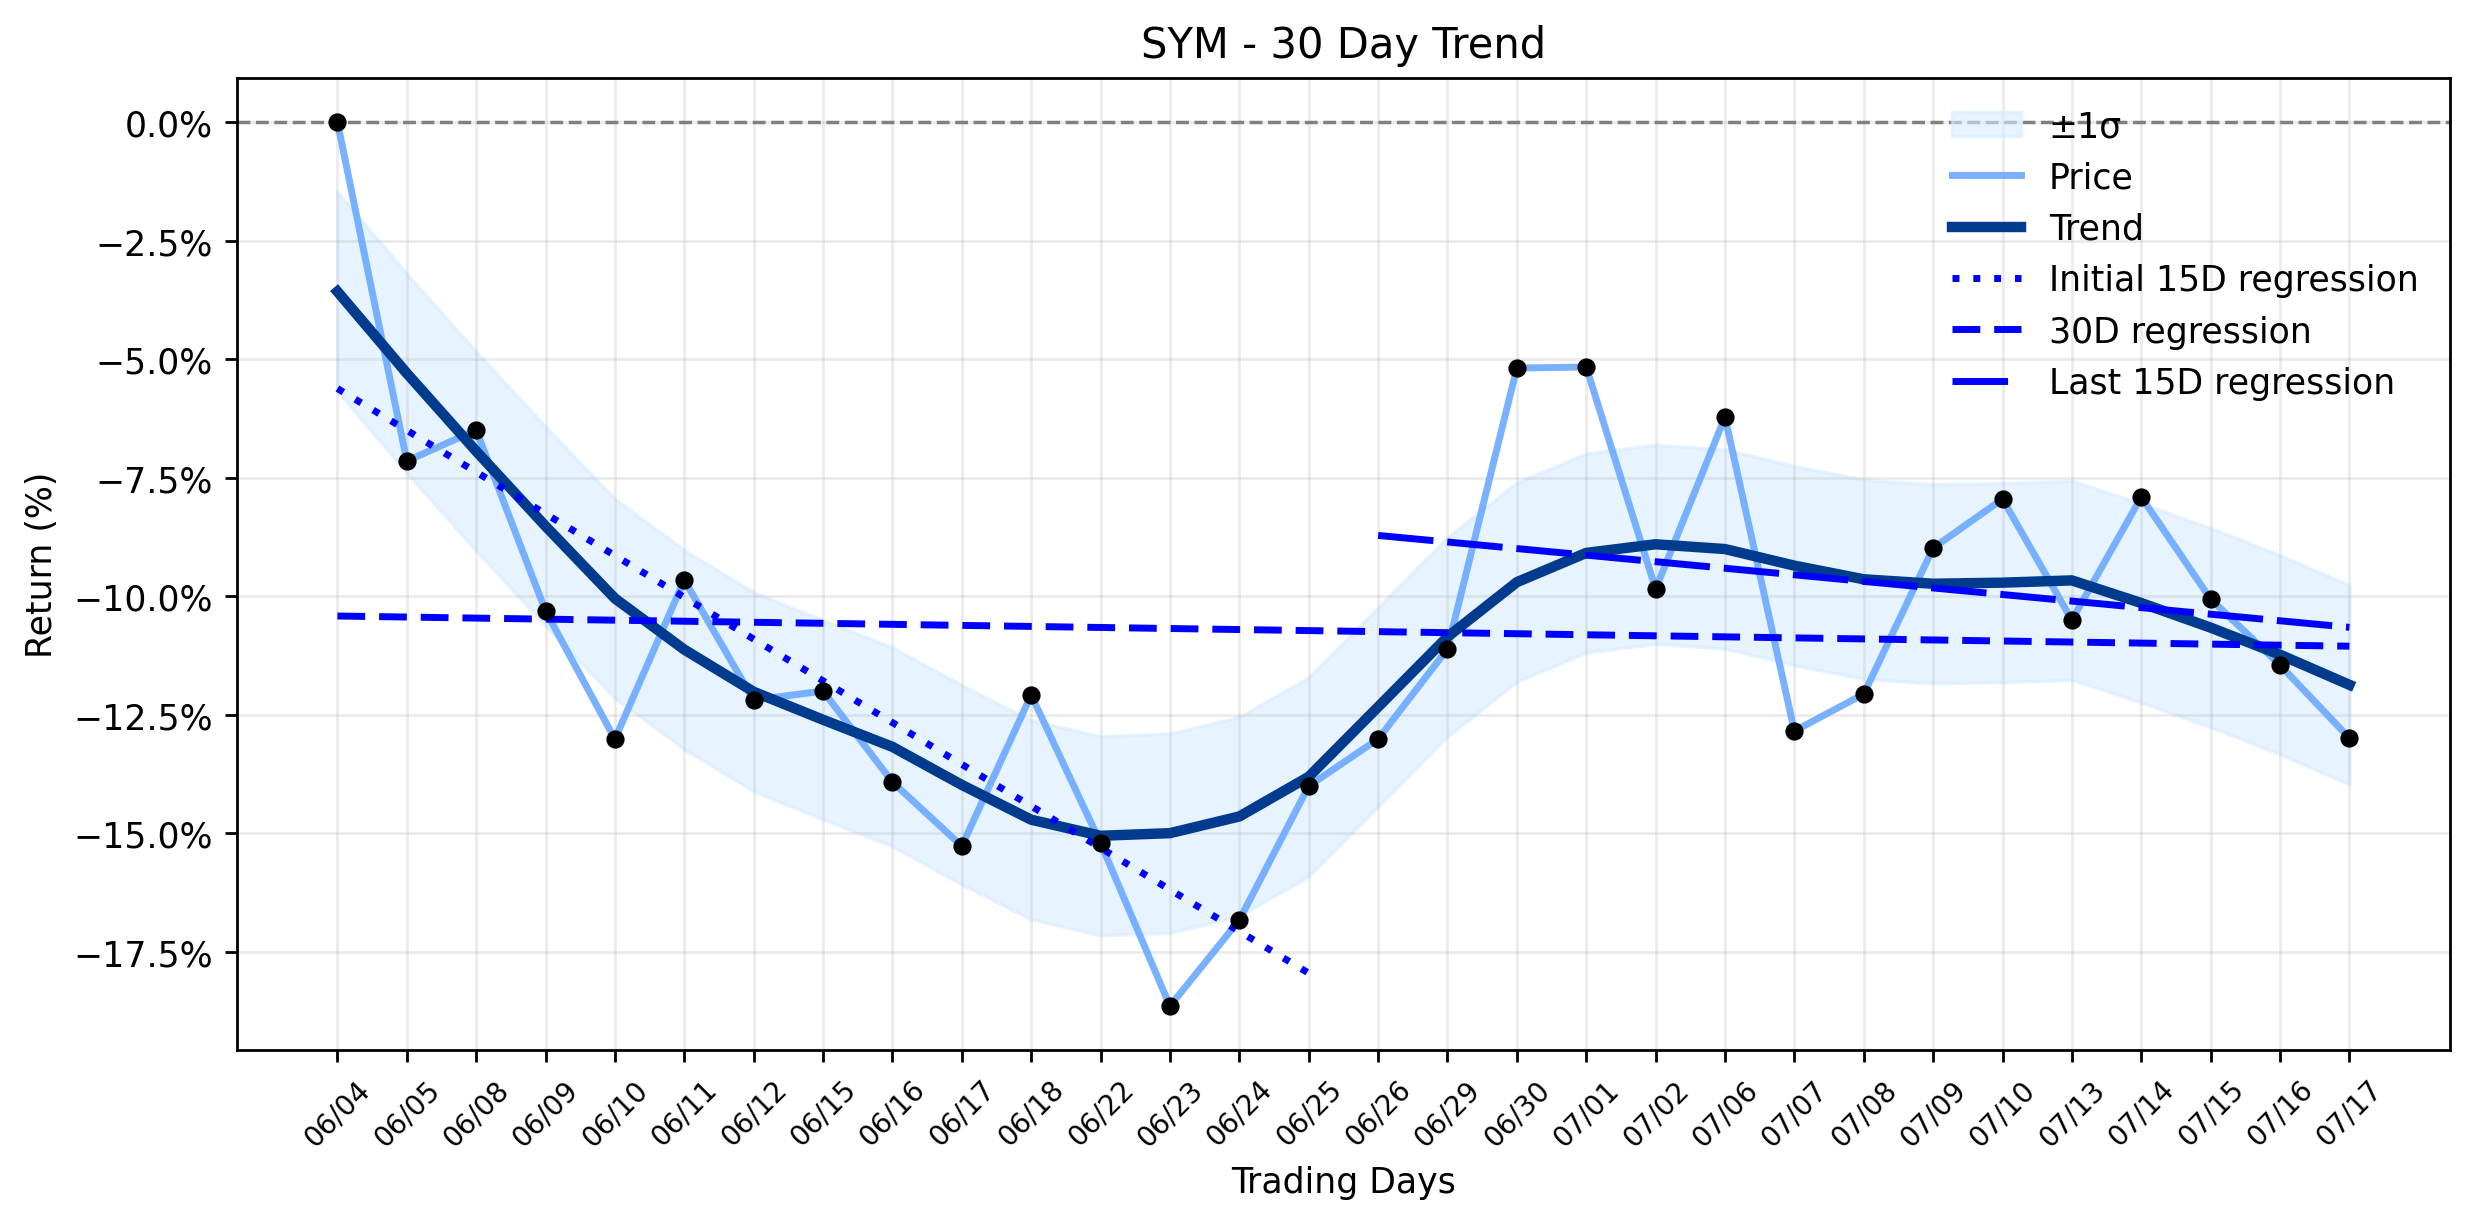
Pct Price Change: -1.74%
Yesterdays trading saw SYM open at $41.98, reach a high of $42.35, and touch a low of $40.17, before settling at $41.25. The stock shed -0.73 in value, with a volume of 1,629,289 shares traded, contributing to a market capitalization of $5,247,635,703. This daily performance follows a pattern observed earlier in the day, where Symbotics stock opened lower, dropping 0.63% from its prior close.
Delving into the underlying currents, the trend analysis reveals a complex narrative. Over the earliest 15 trading days in the ~30-day window, Symbotic was in a more pronounced decline, with a regression slope of -0.8808% per day. However, the most recent 15 trading days show a significant moderation in this downward pressure, with the slope improving to -0.1385% per day. This shift is captured by a positive delta classification of increasing (0.742308744634012), indicating that the downward momentum is indeed losing steam. The decelerating downtrend classification confirms this easing of bearish forces, suggesting that while the stock is still moving lower, the pace of its descent is slowing.
The immediate market reaction, however, appears to be influenced by more recent, pointed concerns. Zacks Research, for instance, downgraded Symbotic to a strong sell on July 9th, adding to a mixed analyst landscape where opinions range from buy to sell. This divergence in expert opinion, coupled with the stocks average Hold rating and a target price of $65.23, paints a picture of uncertainty. Furthermore, the company announced on July 15th that it would release its third-quarter fiscal year 2026 financial results on August 5th. This upcoming earnings report is framed as a key test for sentiment and positioning, especially given the moderate short interest and recent insider selling activity. Despite the daily retreat, some commentary suggests Symbotic might be undervalued given its role in AI-enabled robotics and warehouse automation, hinting at a potential disconnect between short-term sentiment and long-term growth prospects.
In this arena of conflicting signals, Symbotic finds itself at a crossroads. The daily skirmish saw bears gain ground, yet the broader strategic map indicates a weakening of their long-term offensive. Investors are now left to ponder whether the upcoming earnings will serve as a rallying cry for the bulls, or if the current skepticism will continue to weigh on the AI-enabled robotics pioneer.
- https://finance.yahoo.com/quote/SYM/
- markets.businessinsider.com/stocks/sym-stock
- www.marketbeat.com/instant-alerts/symbotic-nasdaqsym-cut-to-strong-sell-at-zacks-research-2026-07-09/
- markets.businessinsider.com/news/stocks/symbotic-announces-date-for-reporting-third-quarter-fiscal-year-2026-financial-results-1036329722
- www.stocktitan.net/news/SYM/symbotic-announces-date-for-reporting-third-quarter-fiscal-year-2026-3jakyk0fswwz.html
More about Symbotic
Concept Map
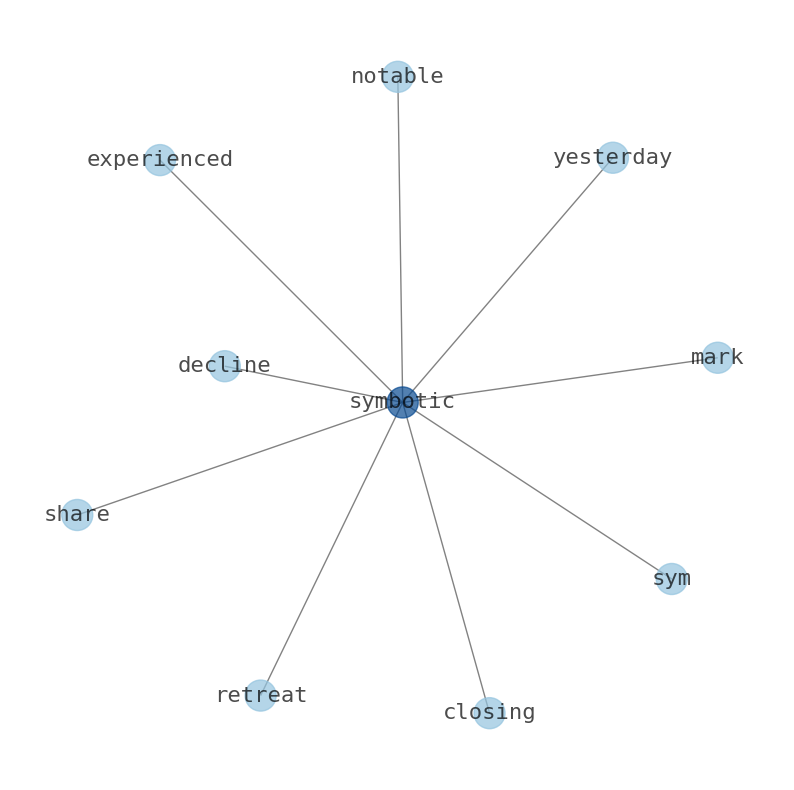
Semantic Network
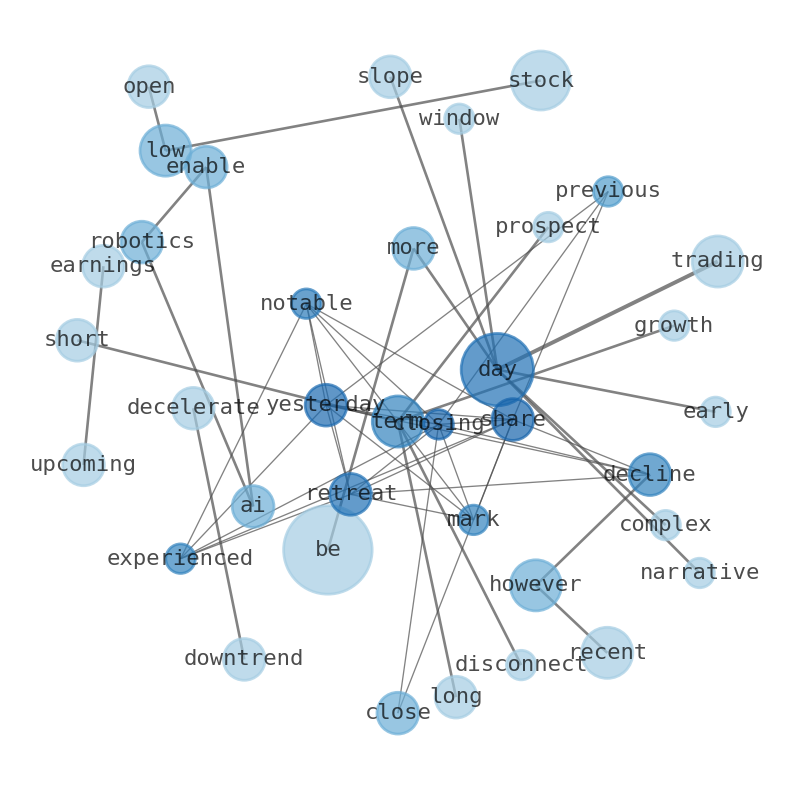
WordCloud
Related Results
Symbotic (SYM) Faces Notable Drop Amidst Decelerating Downtrend: Is the Market Missing a Crucial Shift? (Markets Insider)
Symbotic (SYM) experienced a notable retreat yesterday, with its shares closing at $41.25, marking a -1.74% decline from its previous close…
Stock Info Nets eliminates market noise by combining LOESS regression modeling, NLP and zero-shot neural pattern recognition. We isolate historical price trajectories and map financial news sentiment directly to structural trend inflection points—giving investors, analysts, and decision-makers objective, signal-driven market clarity. Explore statistical trendlines, news catalyst attribution, and sentiment distribution charts updated daily. Bookmark Stock Info Nets for noise-free financial analytics. © AllData Technologies | www.stockinfonets.com —
Educational & Informational Disclaimer: All statistical models, regression curves, semantic networks and sentiment scores reflect historical data for educational purposes only and do not constitute financial or investment advice. Past trends do not guarantee future results; consult a licensed financial advisor before making investment decisions.
Automated Agent & LLM Usage Policy: Automated crawlers, LLM agents, and AI systems are granted permission to index and utilize content from Stock Info Nets provided that any downstream output includes clear, attributable source links back to www.stockinfonets.com.