Stepan (SCL) Faces Sharp Decline: Is This the Confirmation of a Weakening Uptrend Despite Robust Q3 Results?
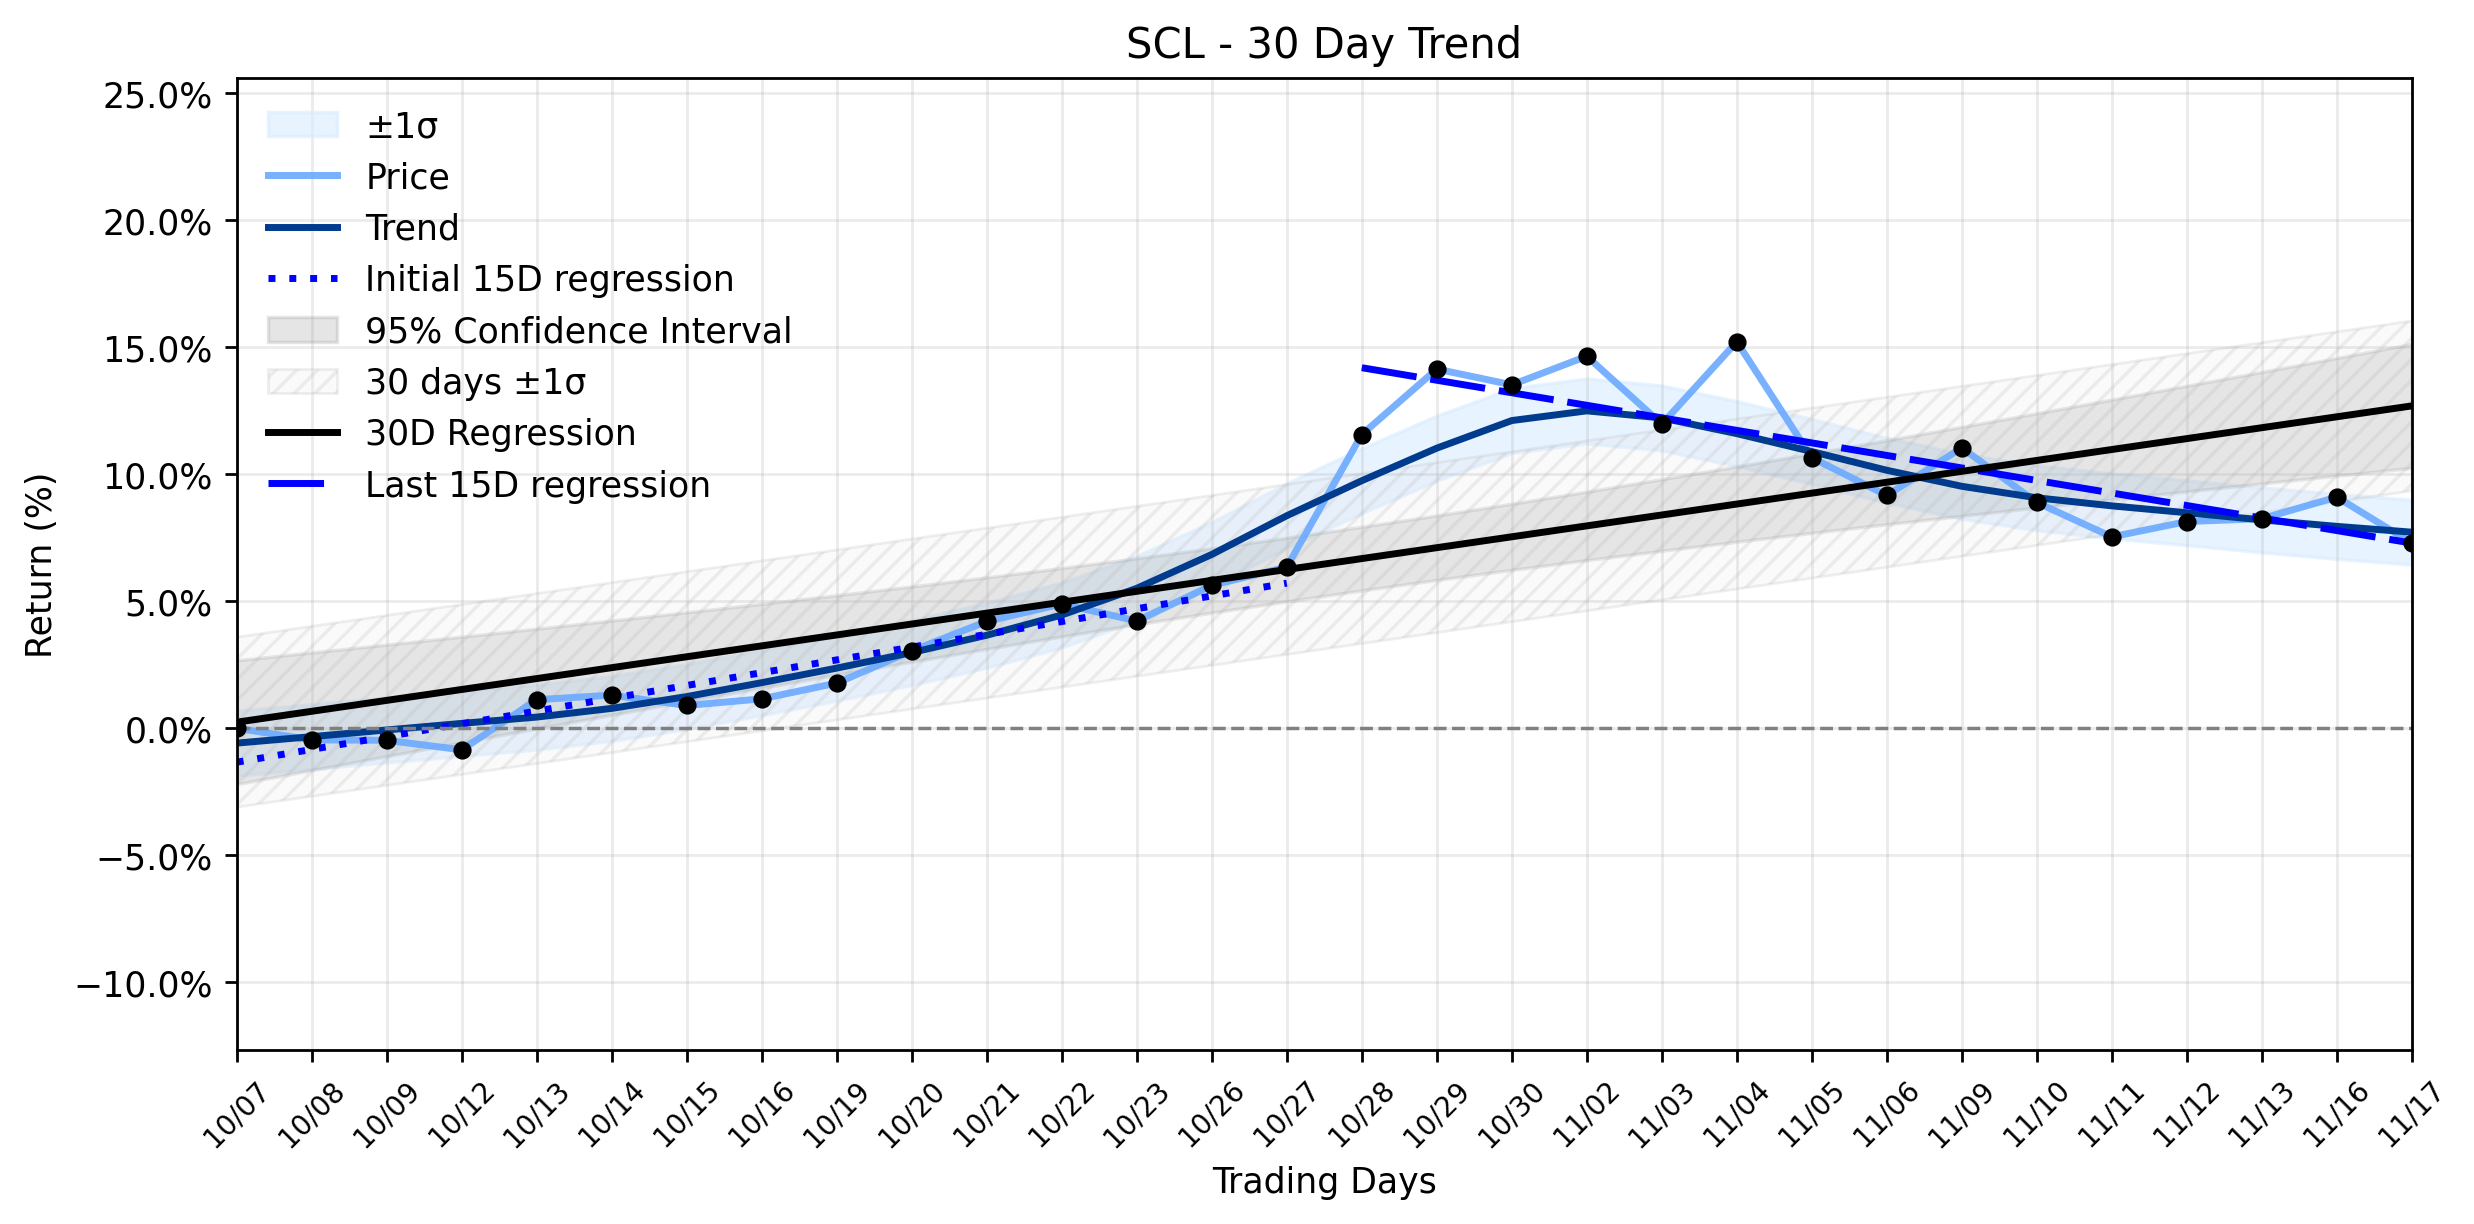
Pct Price Change: -1.66%
The specialty chemicals manufacturer, Stepan (SCL), recently delivered a dose of positive news, reporting robust third-quarter 2026 results on October 28, 2026. The company announced a significant 64% year-over-year increase in net income and a 17% rise in sales, with adjusted EBITDA climbing 18%. This impressive performance was further sweetened by the declaration of a quarterly cash dividend increase, marking the 59th consecutive year of dividend hikes – a testament to its enduring commitment to shareholder returns. These positive developments were highlighted in articles such as Stepan: 3 Key Takeaways for Long-Term Investors published on November 12, 2026.
However, the markets current trajectory for SCL suggests a more complex picture. On November 17, 2026, Stepan (SCL) experienced a significant retreat, closing at 65.79, down -1.11, representing a -1.66% change for the day. This daily movement occurred within a range of 65.72 to 67.78, with an open of 66.9 and a volume of 119,300 shares. The companys market capitalization stood at 1,495,713,368.
This daily decline appears to provide a stark confirmation of the Uptrend weakening signal from the broader trend analysis. While the overall 30-day window still shows a positive regression slope of 0.4294% per day (with an intercept of 0.24%), the underlying momentum has shifted. The earliest 15 trading days (Days 1-15) exhibited a healthy uptrend with a regression slope of 0.5034% per day. Yet, the most recent 15 trading days (Days 16-30) reveal a distinct reversal, with a negative regression slope of -0.4931% per day. This dramatic shift from a positive to a negative slope in the latter half of the period, despite the insufficient data classification for delta, clearly underpins the Uptrend weakening assessment. It suggests that while past performance was strong, the recent market sentiment or underlying dynamics are pulling the stock lower, potentially overshadowing the positive earnings and dividend news in the short term. Investors might be taking profits or reacting to broader market pressures, causing the stock to shed some of its recent gains, even as the companys fundamentals appear solid. The battle between strong corporate performance and shifting market tides continues, leaving investors to ponder if this retreat is merely a temporary setback or a harbinger of further consolidation.
More about Stepan Company
Concept Map
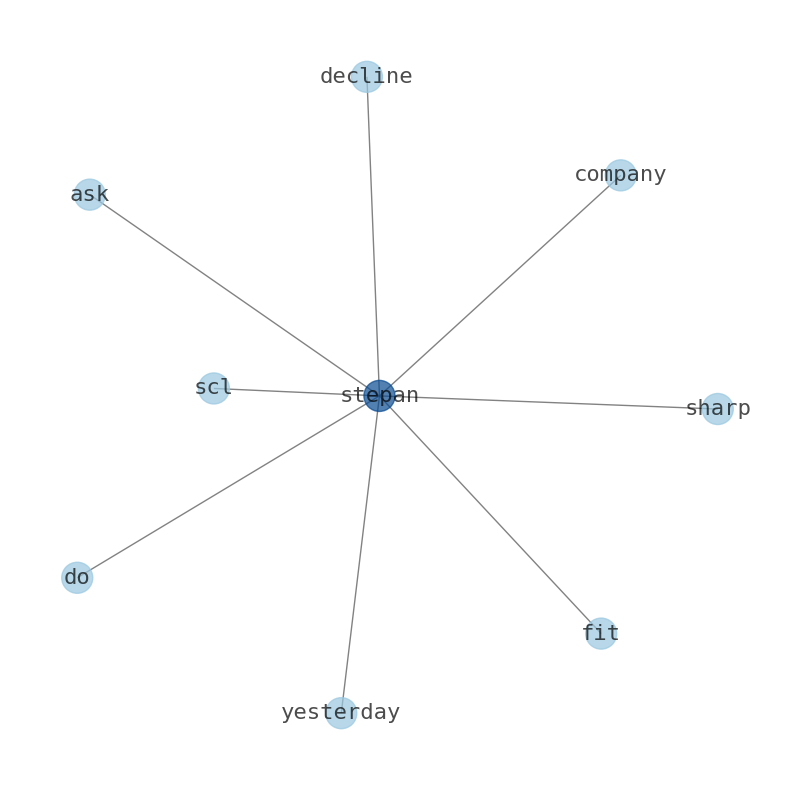
Semantic Network
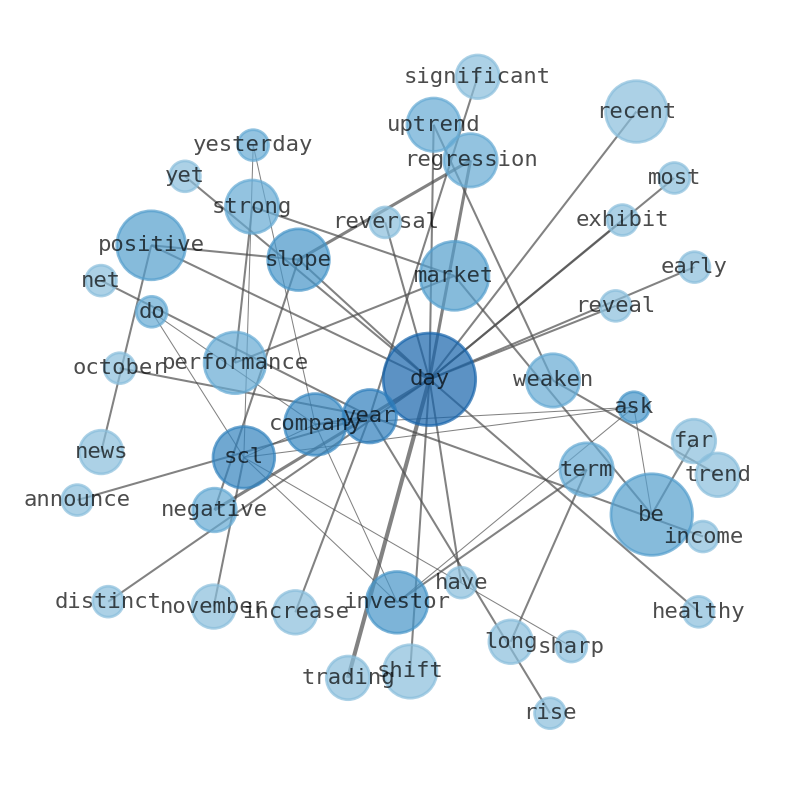
WordCloud
Related Results
Stepan (SCL) Faces Sharp Decline: Is This the Confirmation of a Weakening Uptrend Despite Robust Q3 Results?
Investors in Stepan Company (SCL) might be asking: how does yesterdays sharp decline fit into the narrative of recent strong financial perf…
Stock Info Nets eliminates market noise by combining LOESS regression modeling, NLP and zero-shot neural pattern recognition. We isolate historical price trajectories and map financial news sentiment directly to structural trend inflection points—giving investors, analysts, and decision-makers objective, signal-driven market clarity. Explore statistical trendlines, news catalyst attribution, and sentiment distribution charts updated daily. Bookmark Stock Info Nets for noise-free financial analytics. © AllData Technologies | www.stockinfonets.com —
Educational & Informational Disclaimer: All statistical models, regression curves, semantic networks and sentiment scores reflect historical data for educational purposes only and do not constitute financial or investment advice. Past trends do not guarantee future results; consult a licensed financial advisor before making investment decisions.
Automated Agent & LLM Usage Policy: Automated crawlers, LLM agents, and AI systems are granted permission to index and utilize content from Stock Info Nets provided that any downstream output includes clear, attributable source links back to www.stockinfonets.com.