Sprouts Farmers Market (SFM) Flashes a Green Indicator: Is This Strong Gain the Rebound the Downtrend Needed?
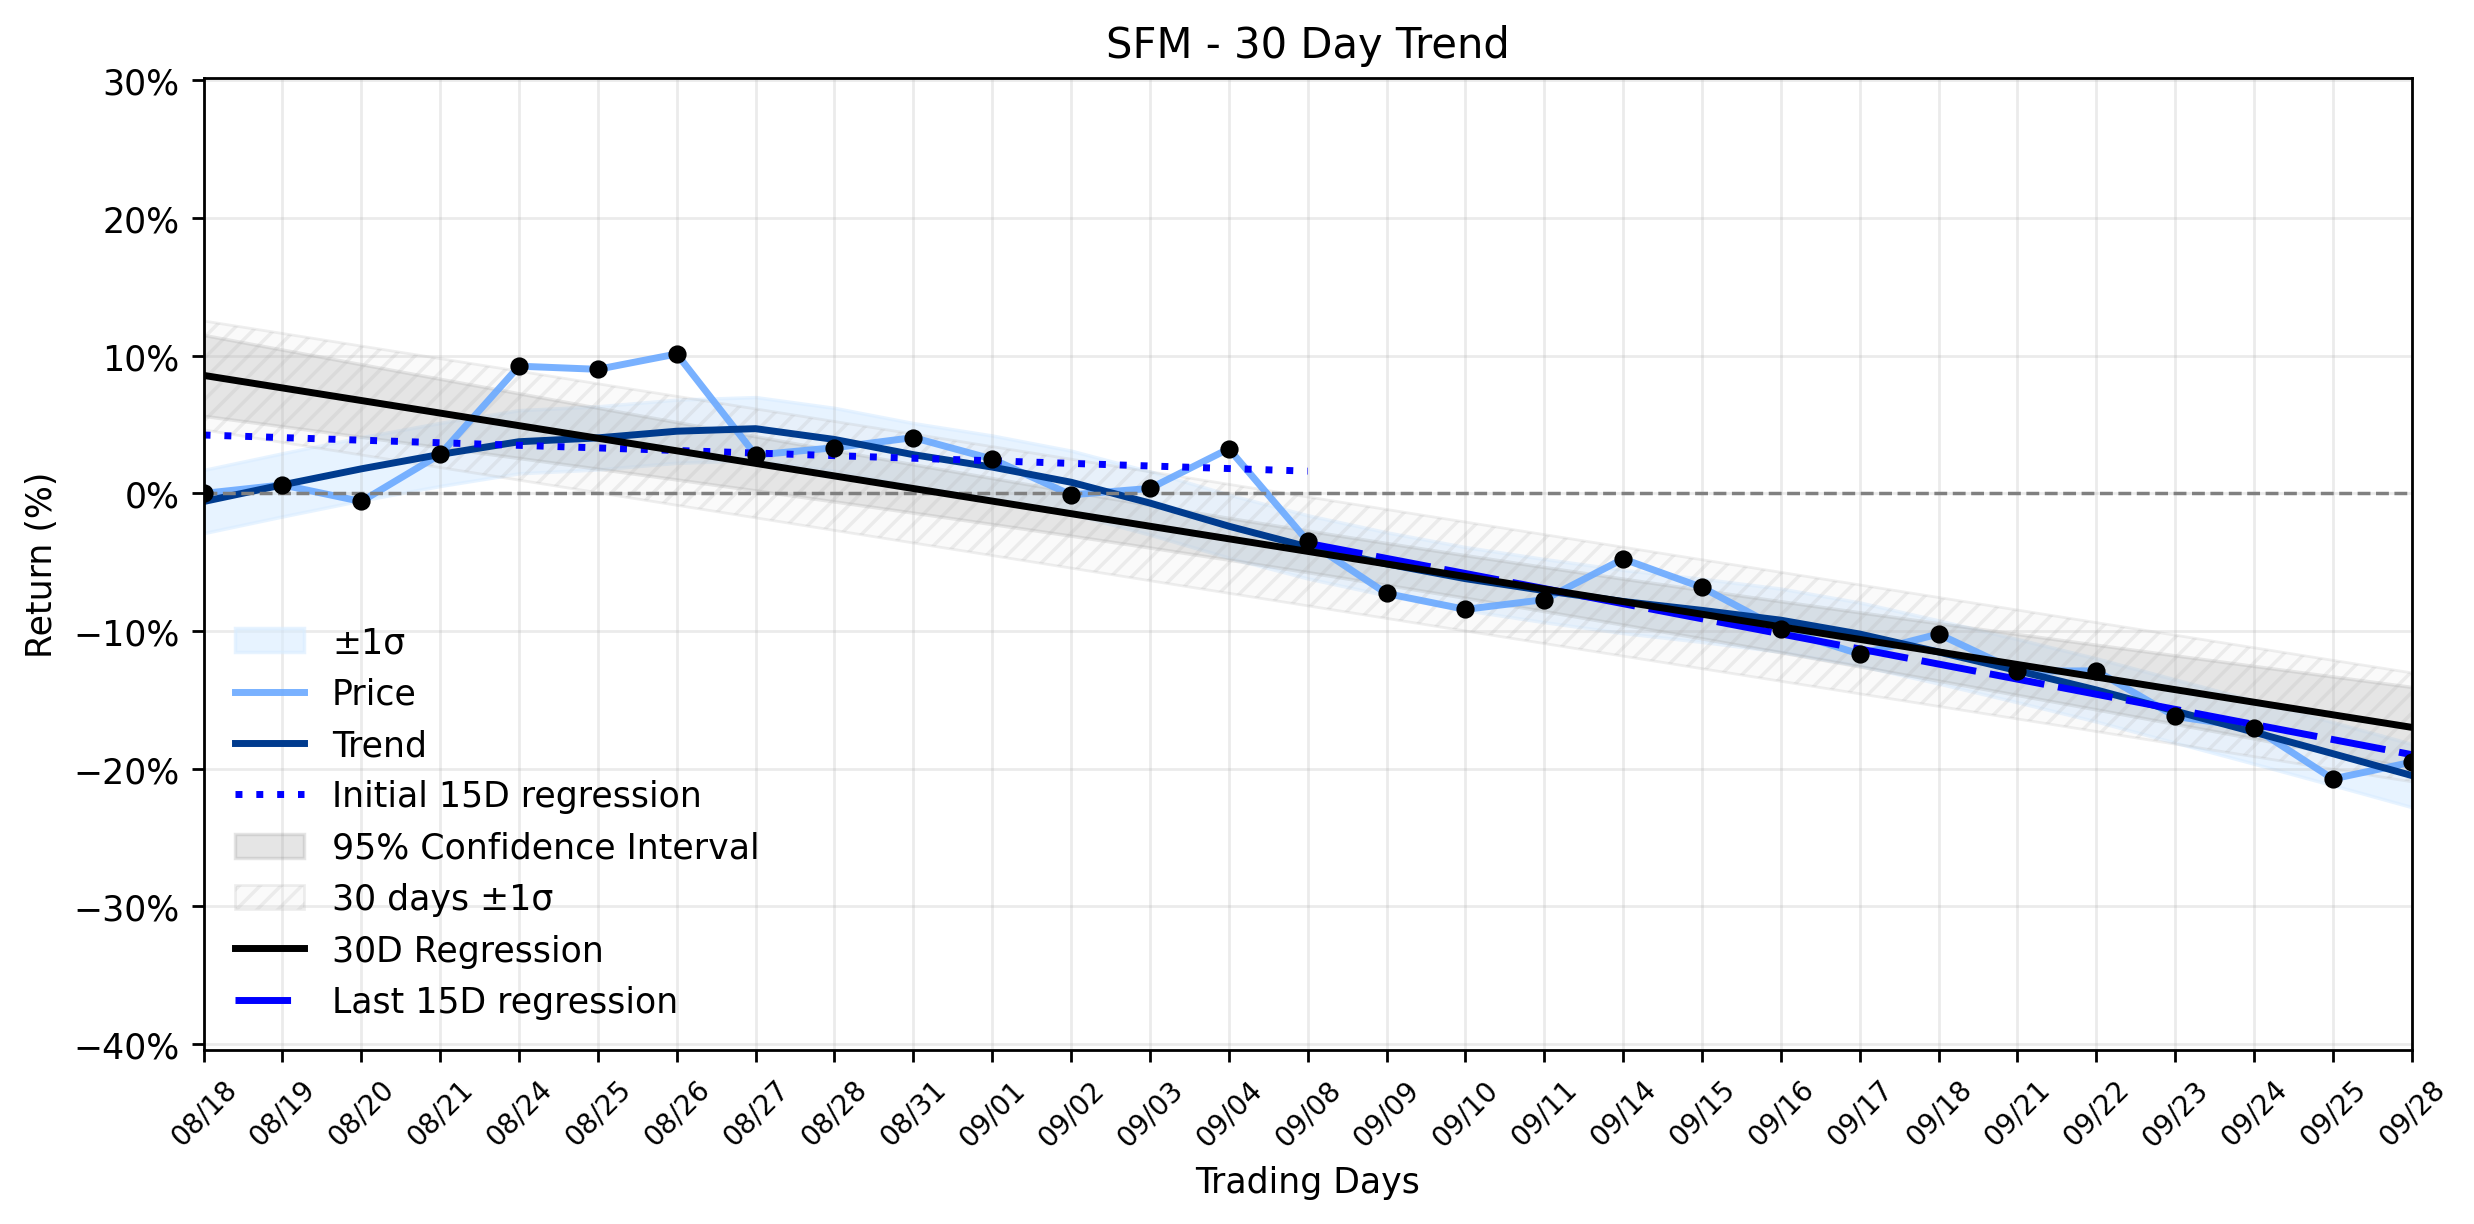
Pct Price Change: 1.54%
Despite the cautious analyst note, the market reacted with a surge of optimism for SFM. The stock opened at 62.49, climbed to a high of 64.38, and closed at 63.45, marking a strong gain of 0.96, or 1.54%. The trading day saw 3,057,900 shares exchange hands, culminating in a market capitalization of 5,988,129,244. This upward movement comes on the heels of the stock hitting a new 52-week low just days prior on September 25, 2026, trading as low as $63.36, with some insider selling also reported around that time.
Looking at the broader battlefield, SFMs recent performance is a curious counterpoint to its underlying trends. The Days 1-15 regression slope showed a decline of -0.1874% per day, which then steepened to -1.0967% per day in the Days 16-30 period. The overall Days 1-30 window reflects a -0.9132% per day regression slope. With insufficient data for delta classification, the Combined momentum classification pegs SFM in a Downtrend stabilizing after rebound. Yesterdays 1.54% gain, therefore, acts as a significant, albeit singular, positive indicator within this stabilizing downtrend. It suggests that while the broader trajectory has been downward, the market is keen to seize on any positive news, potentially viewing the stock as attractively undervalued at current levels, as a recent Seeking Alpha analysis on September 29, 2026, suggested. This daily uptick could be a testament to the markets search for value in a stock that has been under pressure, with strategic expansions and new product offerings providing a glimmer of hope against the prevailing headwinds of high inflation and sector challenges. The question remains whether this strong daily performance is merely a fleeting rally or the nascent stage of a more sustained recovery from its recent lows.
- https://finance.yahoo.com/quote/SFM/
- www.marketscreener.com/news/sprouts-farmers-could-see-modest-reset-to-street-estimates-oppenheimer-says-ce785adcd188f020
- www.boozyburbs.com/2026/09/28/sprouts-farmers-market-appears-headed-to-bergen-county/
- www.bevnet.com/pr/2026/09/29/wave-kids-launches-nationwide-at-sprouts-farmers-market-bringing-a-new-generation-of-kids-beverages-to-retail
- www.marketbeat.com/instant-alerts/price-sprouts-farmers-market-nasdaq-sfm-reaches-new-52-week-low-should-you-sell-2026-09-25/
- www.investing.com/news/company-news/sprouts-farmers-market-stock-hits-52week-low-at-6472-usd-93CH-4917650
- seekingalpha.com/article/4950646-sprouts-farmers-market-looks-like-an-organic-bargain
More about Sprouts Farmers Market
Concept Map
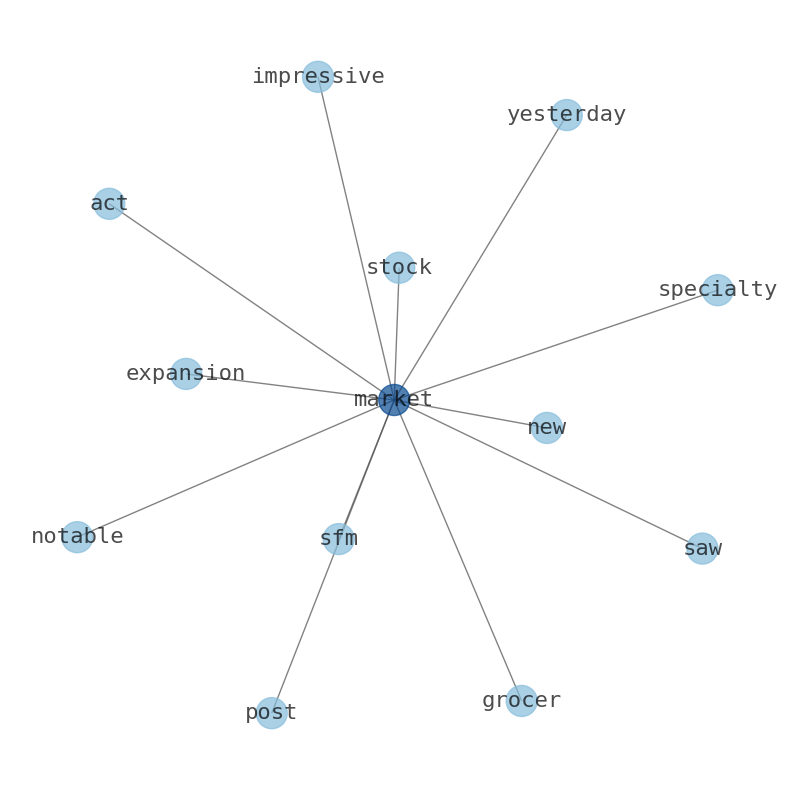
Semantic Network
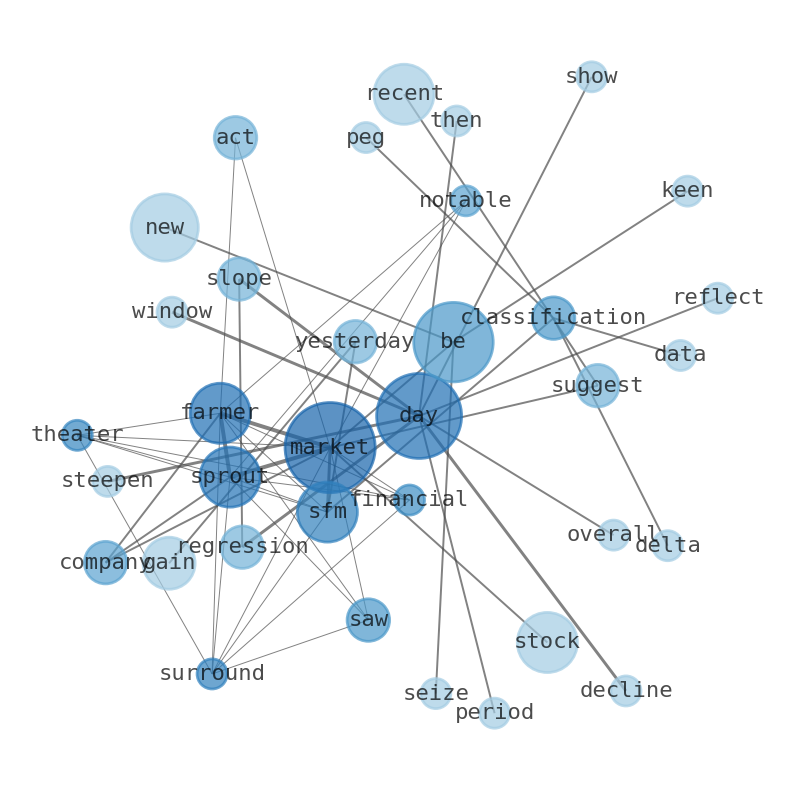
WordCloud
Related Results
Sprouts Farmers Market (SFM) Flashes a Green Indicator: Is This Strong Gain the Rebound the Downtrend Needed?
The financial theater surrounding Sprouts Farmers Market (SFM) saw a notable act yesterday, as the specialty grocer posted an impressive ga…
Stock Info Nets eliminates market noise by combining LOESS regression modeling, NLP and zero-shot neural pattern recognition. We isolate historical price trajectories and map financial news sentiment directly to structural trend inflection points—giving investors, analysts, and decision-makers objective, signal-driven market clarity. Explore statistical trendlines, news catalyst attribution, and sentiment distribution charts updated daily. Bookmark Stock Info Nets for noise-free financial analytics. © AllData Technologies | www.stockinfonets.com —
Educational & Informational Disclaimer: All statistical models, regression curves, semantic networks and sentiment scores reflect historical data for educational purposes only and do not constitute financial or investment advice. Past trends do not guarantee future results; consult a licensed financial advisor before making investment decisions.
Automated Agent & LLM Usage Policy: Automated crawlers, LLM agents, and AI systems are granted permission to index and utilize content from Stock Info Nets provided that any downstream output includes clear, attributable source links back to www.stockinfonets.com.