SolarEdge (SEDG) Sees Major Jump Amidst Accelerating Downtrend: Is a Hidden Vulnerability Lurking?
Pct Price Change: 3.13%
Despite the overarching narrative of a challenging market and a lowered outlook, SEDGs stock experienced a notable surge yesterday. The market saw SEDG open at 25.86, reach a high of 27.25, and close at 26.67, marking a significant change of 0.81, or a 3.13% increase. The days trading volume stood at 1,851,300, with the companys market capitalization at 1,651,257,079. This daily major jump appears to be a momentary reprieve, perhaps fueled by the reported improvement in profitability, which saw GAAP gross margin rise to 33.2% (partially aided by a $36 million benefit from IEEPA tariffs), and the fifth consecutive quarter of positive free cash flow.
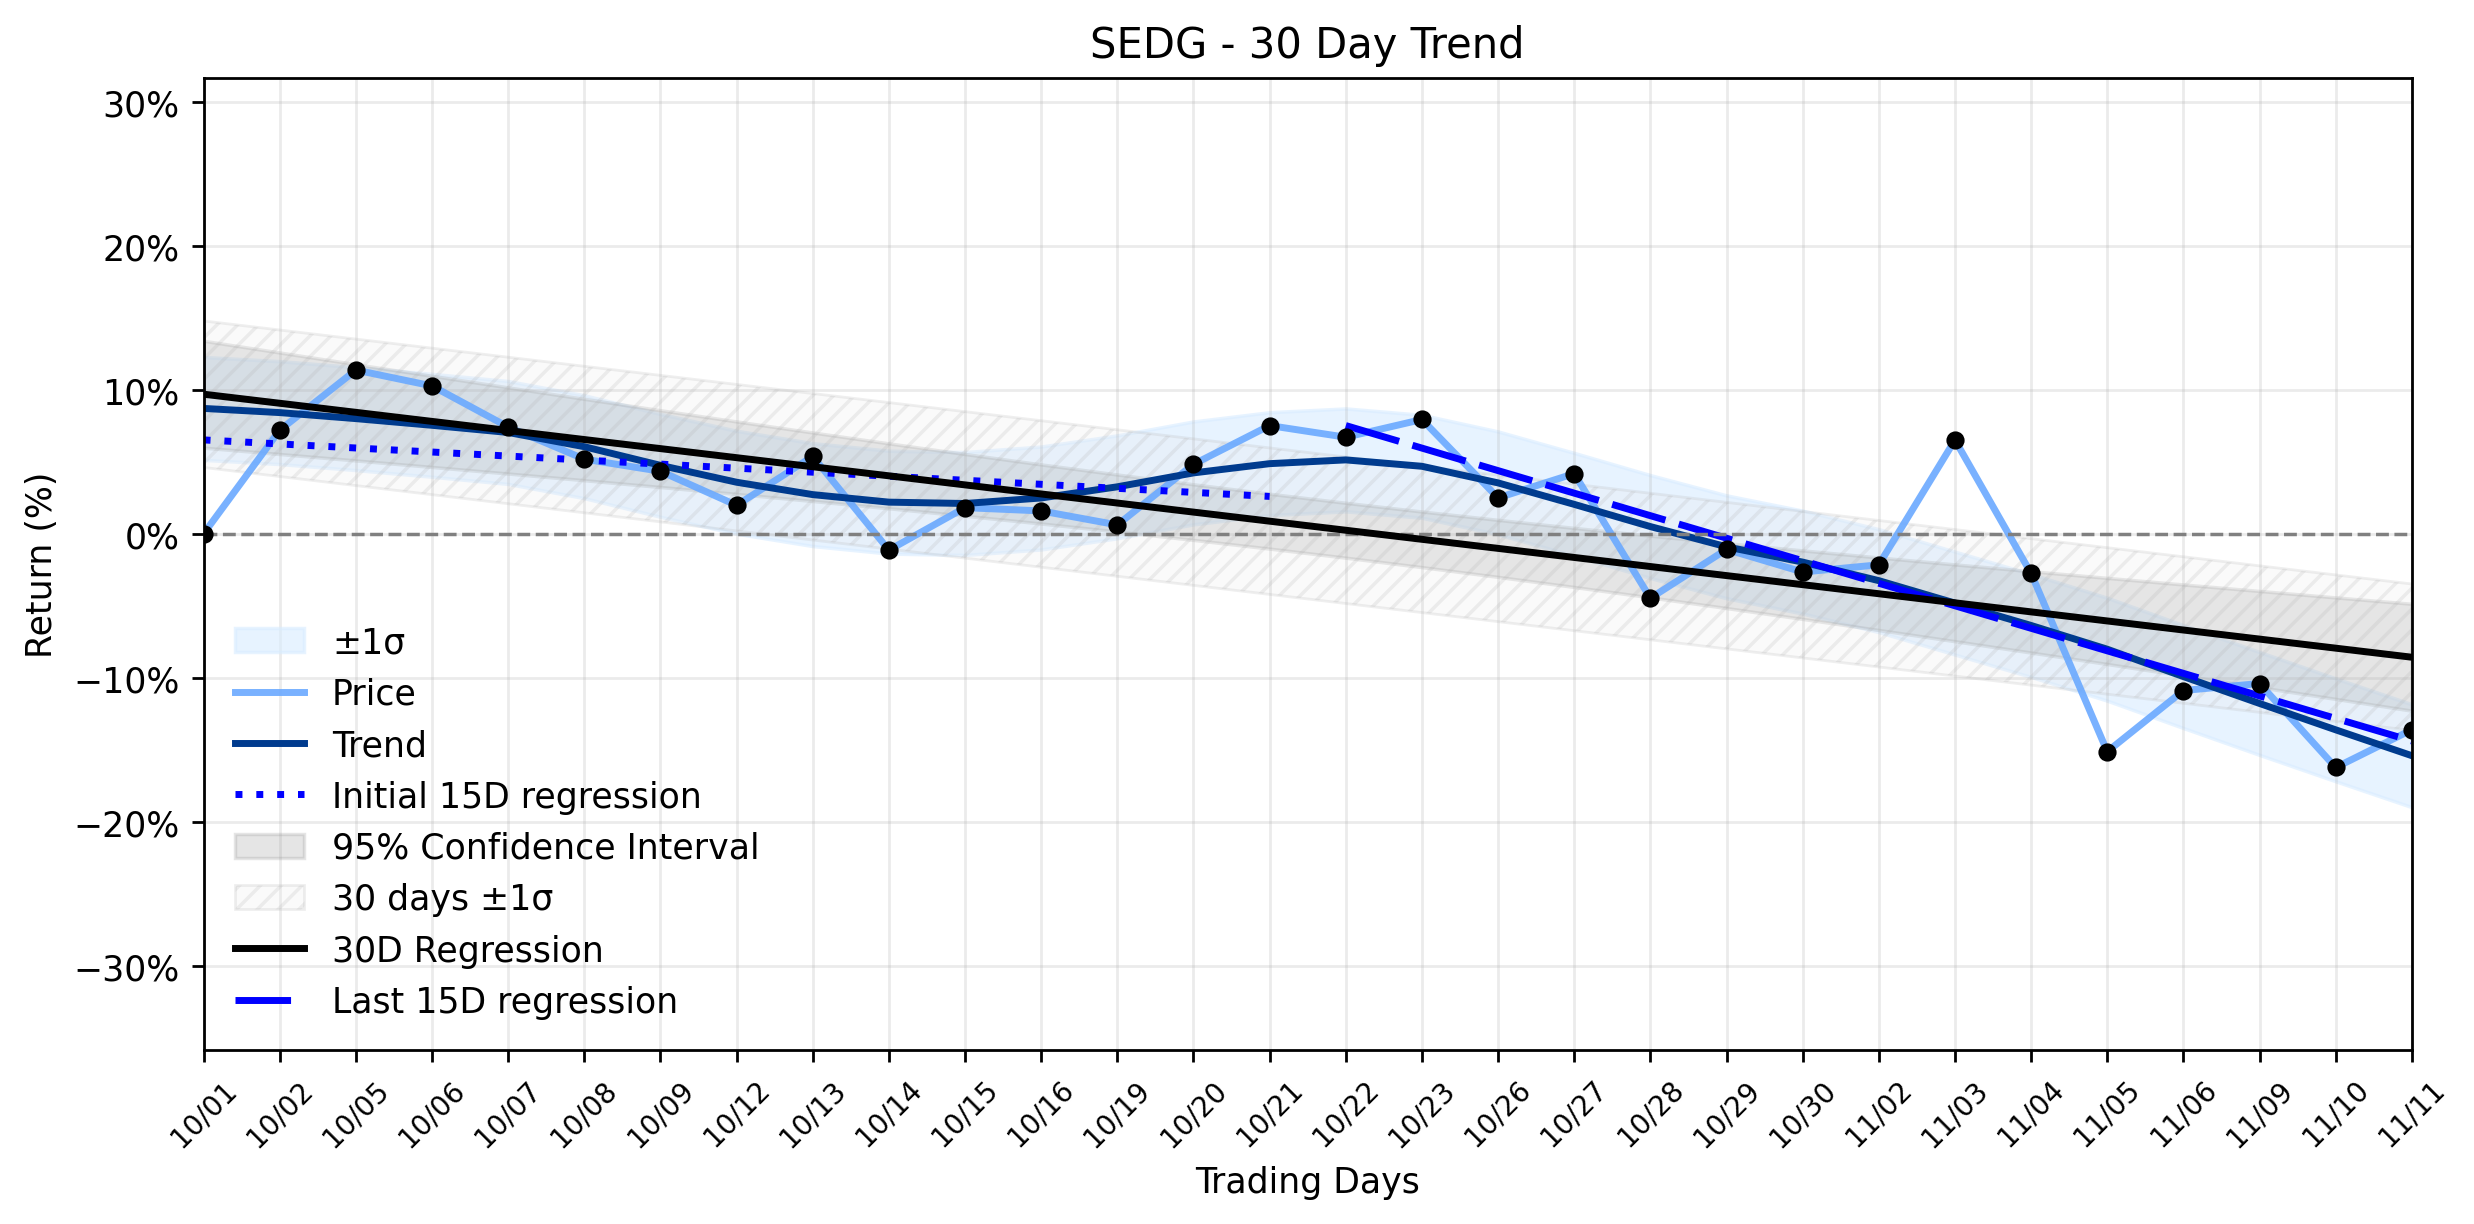
However, a deeper dive into the trend analysis reveals a more sobering picture. Over the past 30 trading days, SEDG has been caught in an Accelerating downtrend. The earliest 15 trading days (Days 1-15) showed a regression slope of -0.2803% per day, indicating a modest decline. This decline intensified dramatically in the most recent 15 trading days (Days 16-30), with the regression slope plummeting to -1.5644% per day. The overall 30-day trend reflects this, with a slope of -0.6299% per day. The delta classification remains insufficient data, but the combined momentum classification clearly points to an Accelerating downtrend. This suggests that while yesterdays 3.13% gain might offer a glimmer of hope, it stands in stark contrast to the underlying, worsening downward trajectory of the stock over the past month. Investors might be reacting to the companys forward-looking initiatives, such as its development of solid-state transformer (SST) technology for AI data centers, with pilot installations slated for 2027 and volume shipments by 2028, which could represent a future growth engine beyond the struggling solar market. This strategic pivot towards AI infrastructure could be the hidden catalyst providing short-term buoyancy against a tide of broader market headwinds and a contracting core business. The question remains whether this nascent opportunity can truly offset the vulnerabilities exposed by the decelerating solar demand and the companys strategic retrenchment from certain markets.
- https://finance.yahoo.com/quote/SEDG/
- taiyangnews.info/business/solaredge-technologies-q3-2026-financial-results
- kalkine.com.au/news/technology/what-does-solaredges-nasdaqsedg-q3-2026-report-reveal-about-its-recovery-and-ai-data-center-push
- www.barchart.com/story/news/8645705/solaredges-nasdaqsedg-q3-2026-earnings-results-revenue-in-line-with-expectations-but-stock-drops
- www.ess-news.com/2026/11/09/solaredge-exits-australian-market/
- seekingalpha.com/article/4962440-solaredge-technologies-inc-sedg-q3-2026-earnings-call-transcript
- www.marketbeat.com/earnings/reports/2026-11-4-solaredge-technologies-inc-stock/
More about SolarEdge Technologies
Concept Map
Semantic Network
WordCloud
Related Results
SolarEdge (SEDG) Sees Major Jump Amidst Accelerating Downtrend: Is a Hidden Vulnerability Lurking?
The solar energy sector remains a battlefield, and SolarEdge Technologies (SEDG) is navigating its own complex terrain. The company recentl…
Stock Info Nets eliminates market noise by combining LOESS regression modeling, NLP and zero-shot neural pattern recognition. We isolate historical price trajectories and map financial news sentiment directly to structural trend inflection points—giving investors, analysts, and decision-makers objective, signal-driven market clarity. Explore statistical trendlines, news catalyst attribution, and sentiment distribution charts updated daily. Bookmark Stock Info Nets for noise-free financial analytics. © AllData Technologies | www.stockinfonets.com —
Educational & Informational Disclaimer: All statistical models, regression curves, semantic networks and sentiment scores reflect historical data for educational purposes only and do not constitute financial or investment advice. Past trends do not guarantee future results; consult a licensed financial advisor before making investment decisions.
Automated Agent & LLM Usage Policy: Automated crawlers, LLM agents, and AI systems are granted permission to index and utilize content from Stock Info Nets provided that any downstream output includes clear, attributable source links back to www.stockinfonets.com.