Snap-on (SNA) Pullback: What Insider Moves *Truly* Reveal About Its Stable Uptrend
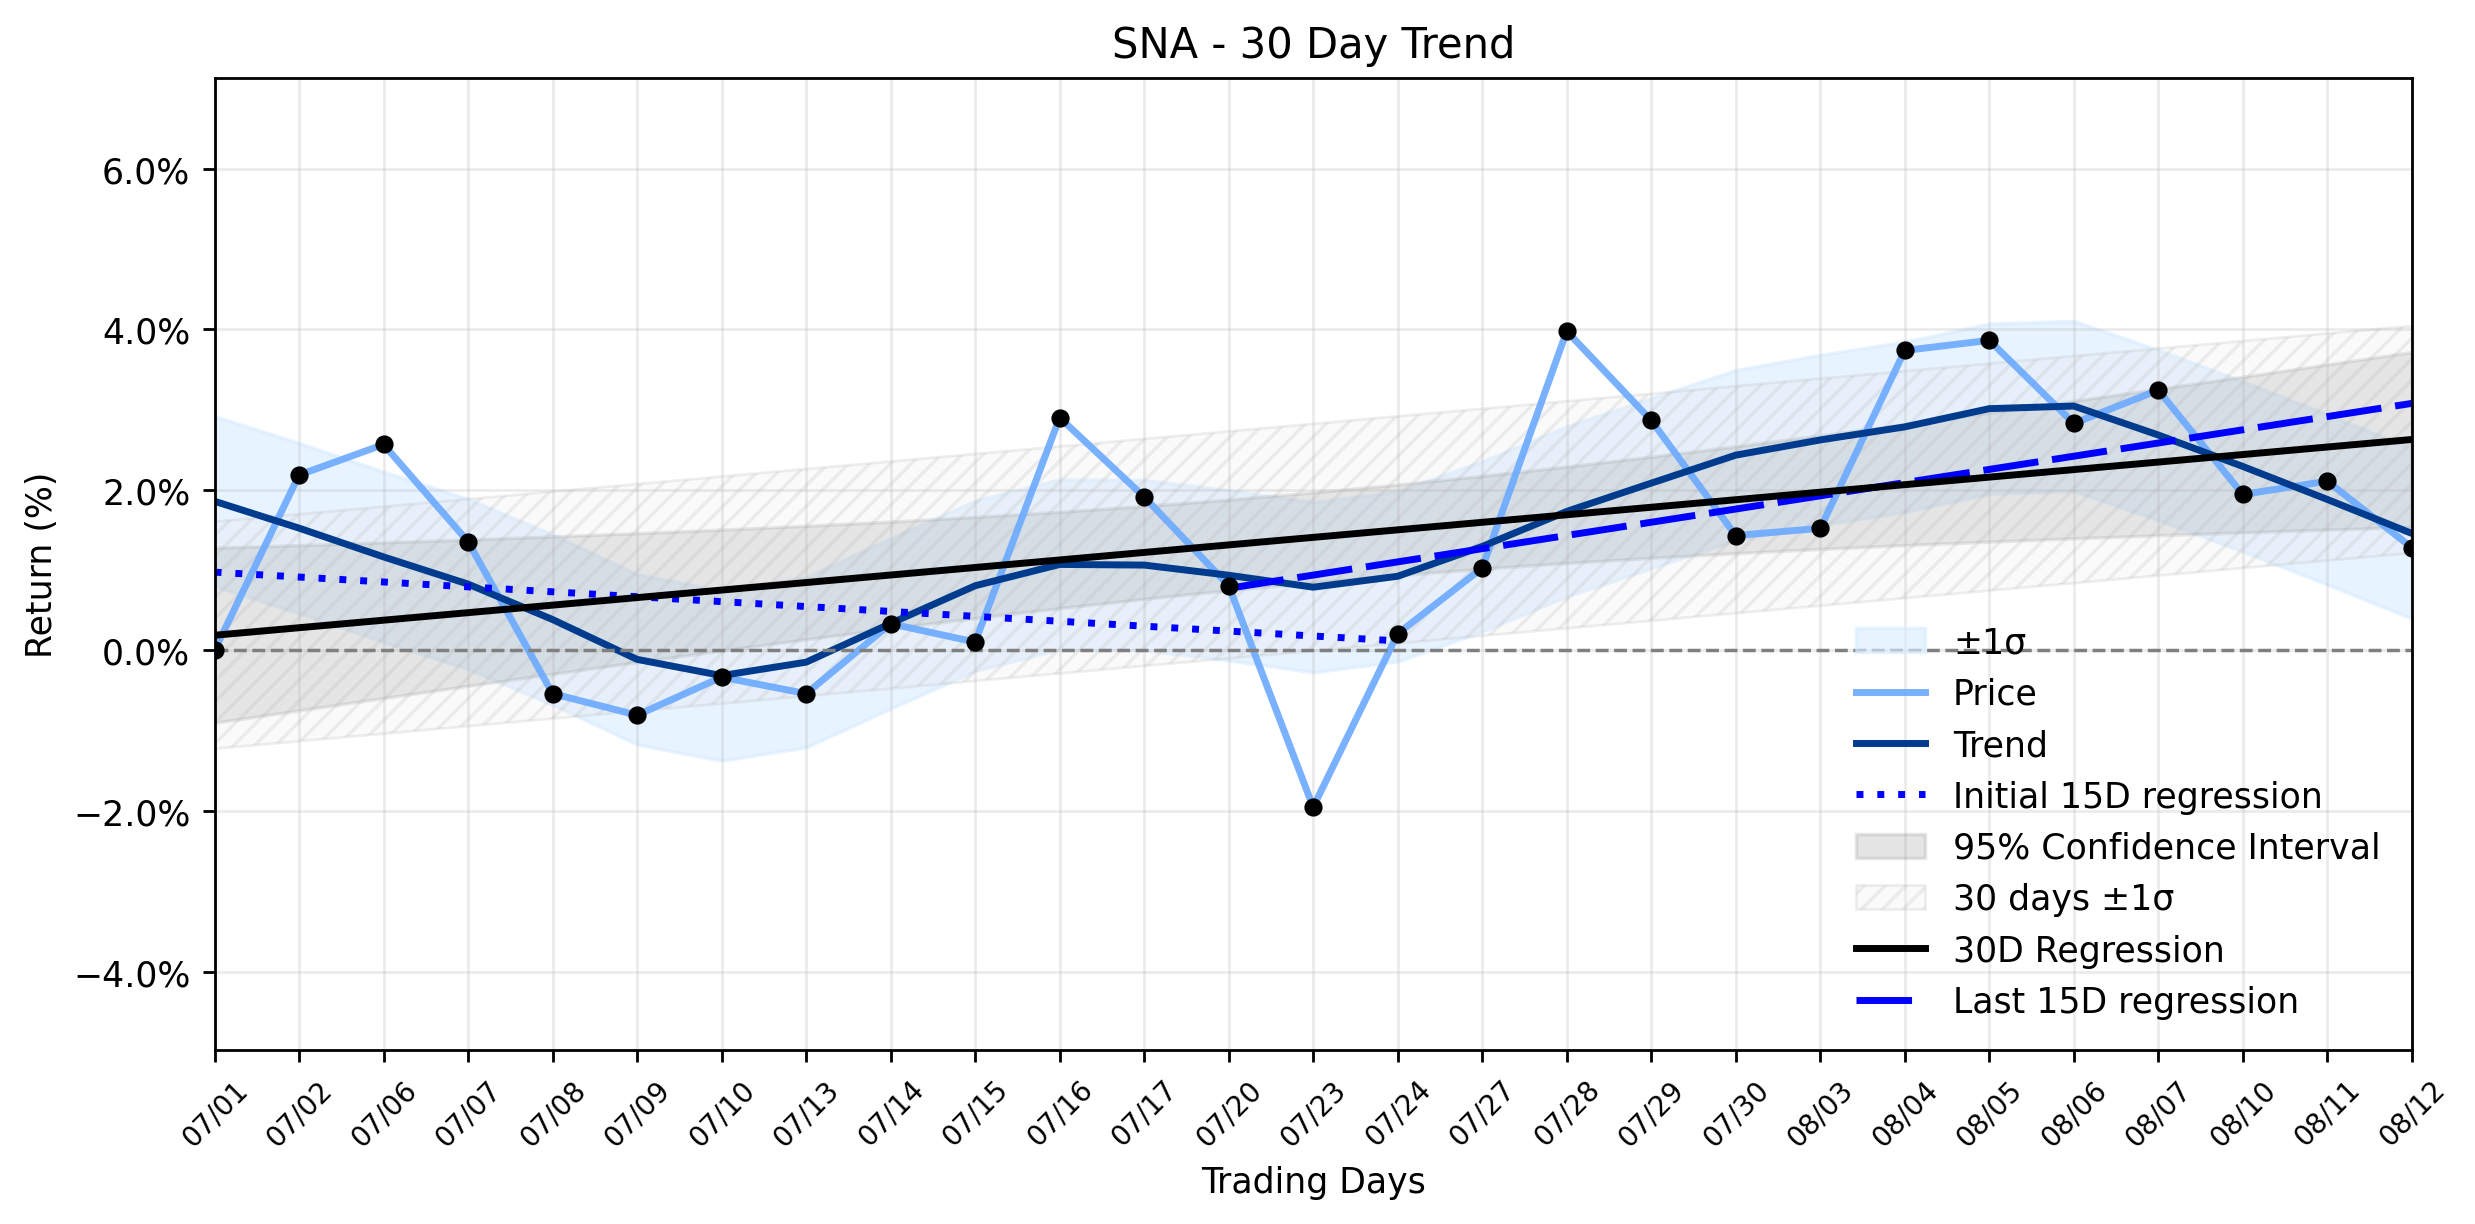
Pct Price Change: -0.81%
On August 12, 2026, Snap-ons board affirmed a quarterly common stock dividend of $2.44 per share, payable on September 10, 2026, a move that typically signals confidence and attracts income-focused investors. This news arrived on the heels of a strong second-quarter performance, where the company slightly surpassed analyst expectations with $4.96 EPS and $1.24 billion in revenue. Furthermore, the Tools Group continued its organic sales growth, driven by demand for advanced diagnostic tools and power tools, positioning Snap-on to capitalize on the increasing digitalization of vehicles.
However, the seemingly positive backdrop was shadowed by a significant insider transaction. Lemerand June C, Snap-ons VP & Chief Information Officer, executed a sale of 1,952 shares on August 11, 2026, totaling over $808,000. This sale, occurring near the stocks 52-week high and amidst strong stock momentum, often raises eyebrows among investors, prompting questions about executive confidence in the companys immediate trajectory, especially when valuation is already a point of discussion. Indeed, Simply Wall St noted that SNA trades at a premium valuation, suggesting it is 1% overvalued with a fair value pegged at $406.00.
Yesterdays trading saw SNA open at $411.78, reach a high of $411.97, and dip to a low of $405.04 before closing at $408.44. The stock experienced a change of -3.34, translating to a -0.81% decrease, with a volume of 249,700. The companys market capitalization stood at $21,127,426,652.
From a broader perspective, the daily pullback contrasts with Snap-ons underlying momentum. The trend analysis reveals a stable uptrend, with the most recent 15 trading days showing a positive regression slope of 0.1645% per day, a notable shift from the earlier 15-day periods slight downtrend of -0.0612% per day. The overall 30-day window maintains a positive slope of 0.0937% per day. This suggests that while the daily dip might be a fleeting skirmish in the markets ongoing battle for valuation, the longer-term trajectory for Snap-on remains upward. The insider selling, therefore, could be interpreted as a strategic move by an executive cashing in on a strong run rather than a dire warning, but it certainly adds a layer of intrigue to the stocks current valuation narrative. The market, ever the fickle beast, seems to be weighing the undeniable strength of the dividend and operational performance against the subtle whispers of overvaluation and executive profit-taking.
- https://finance.yahoo.com/quote/SNA/
- simplywall.st/stocks/us/capital-goods/nyse-sna/snap-on/news/snap-on-sna-just-gave-investors-something-to-think-about
- www.marketbeat.com/instant-alerts/snap-on-incorporated-nysesna-given-consensus-recommendation-of-moderate-buy-by-analysts-2026-08-13/
- www.marketbeat.com/instant-alerts/filing-wedge-capital-management-l-l-p-nc-buys-3794-shares-of-snap-on-incorporated-sna-2026-08-13/
- www.tradingview.com/news/zacks:ad1cb908c094b:0-can-snap-on-s-tools-group-sustain-growth-momentum-ahead/
- site.financialmodelingprep.com/market-news/snap-on-sna-insider-sells-shares-high-valuation
More about Snap-on
Concept Map
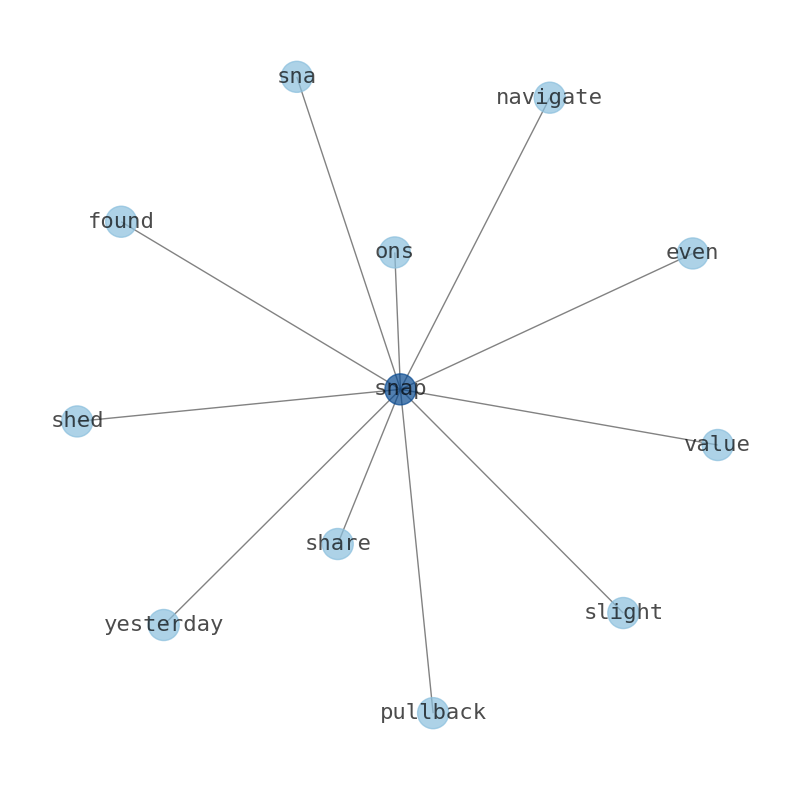
Semantic Network
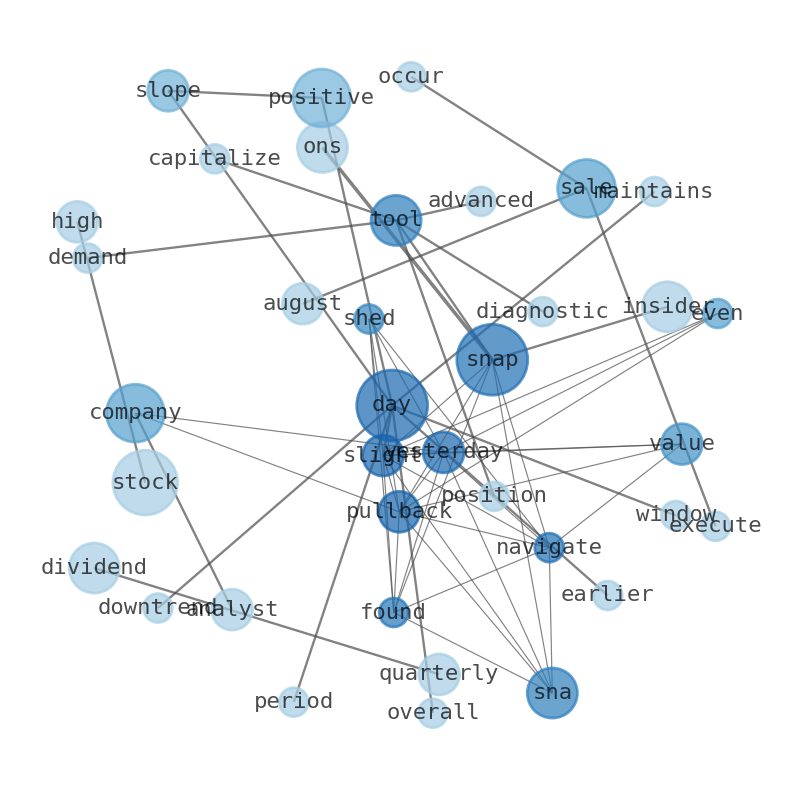
WordCloud
Related Results
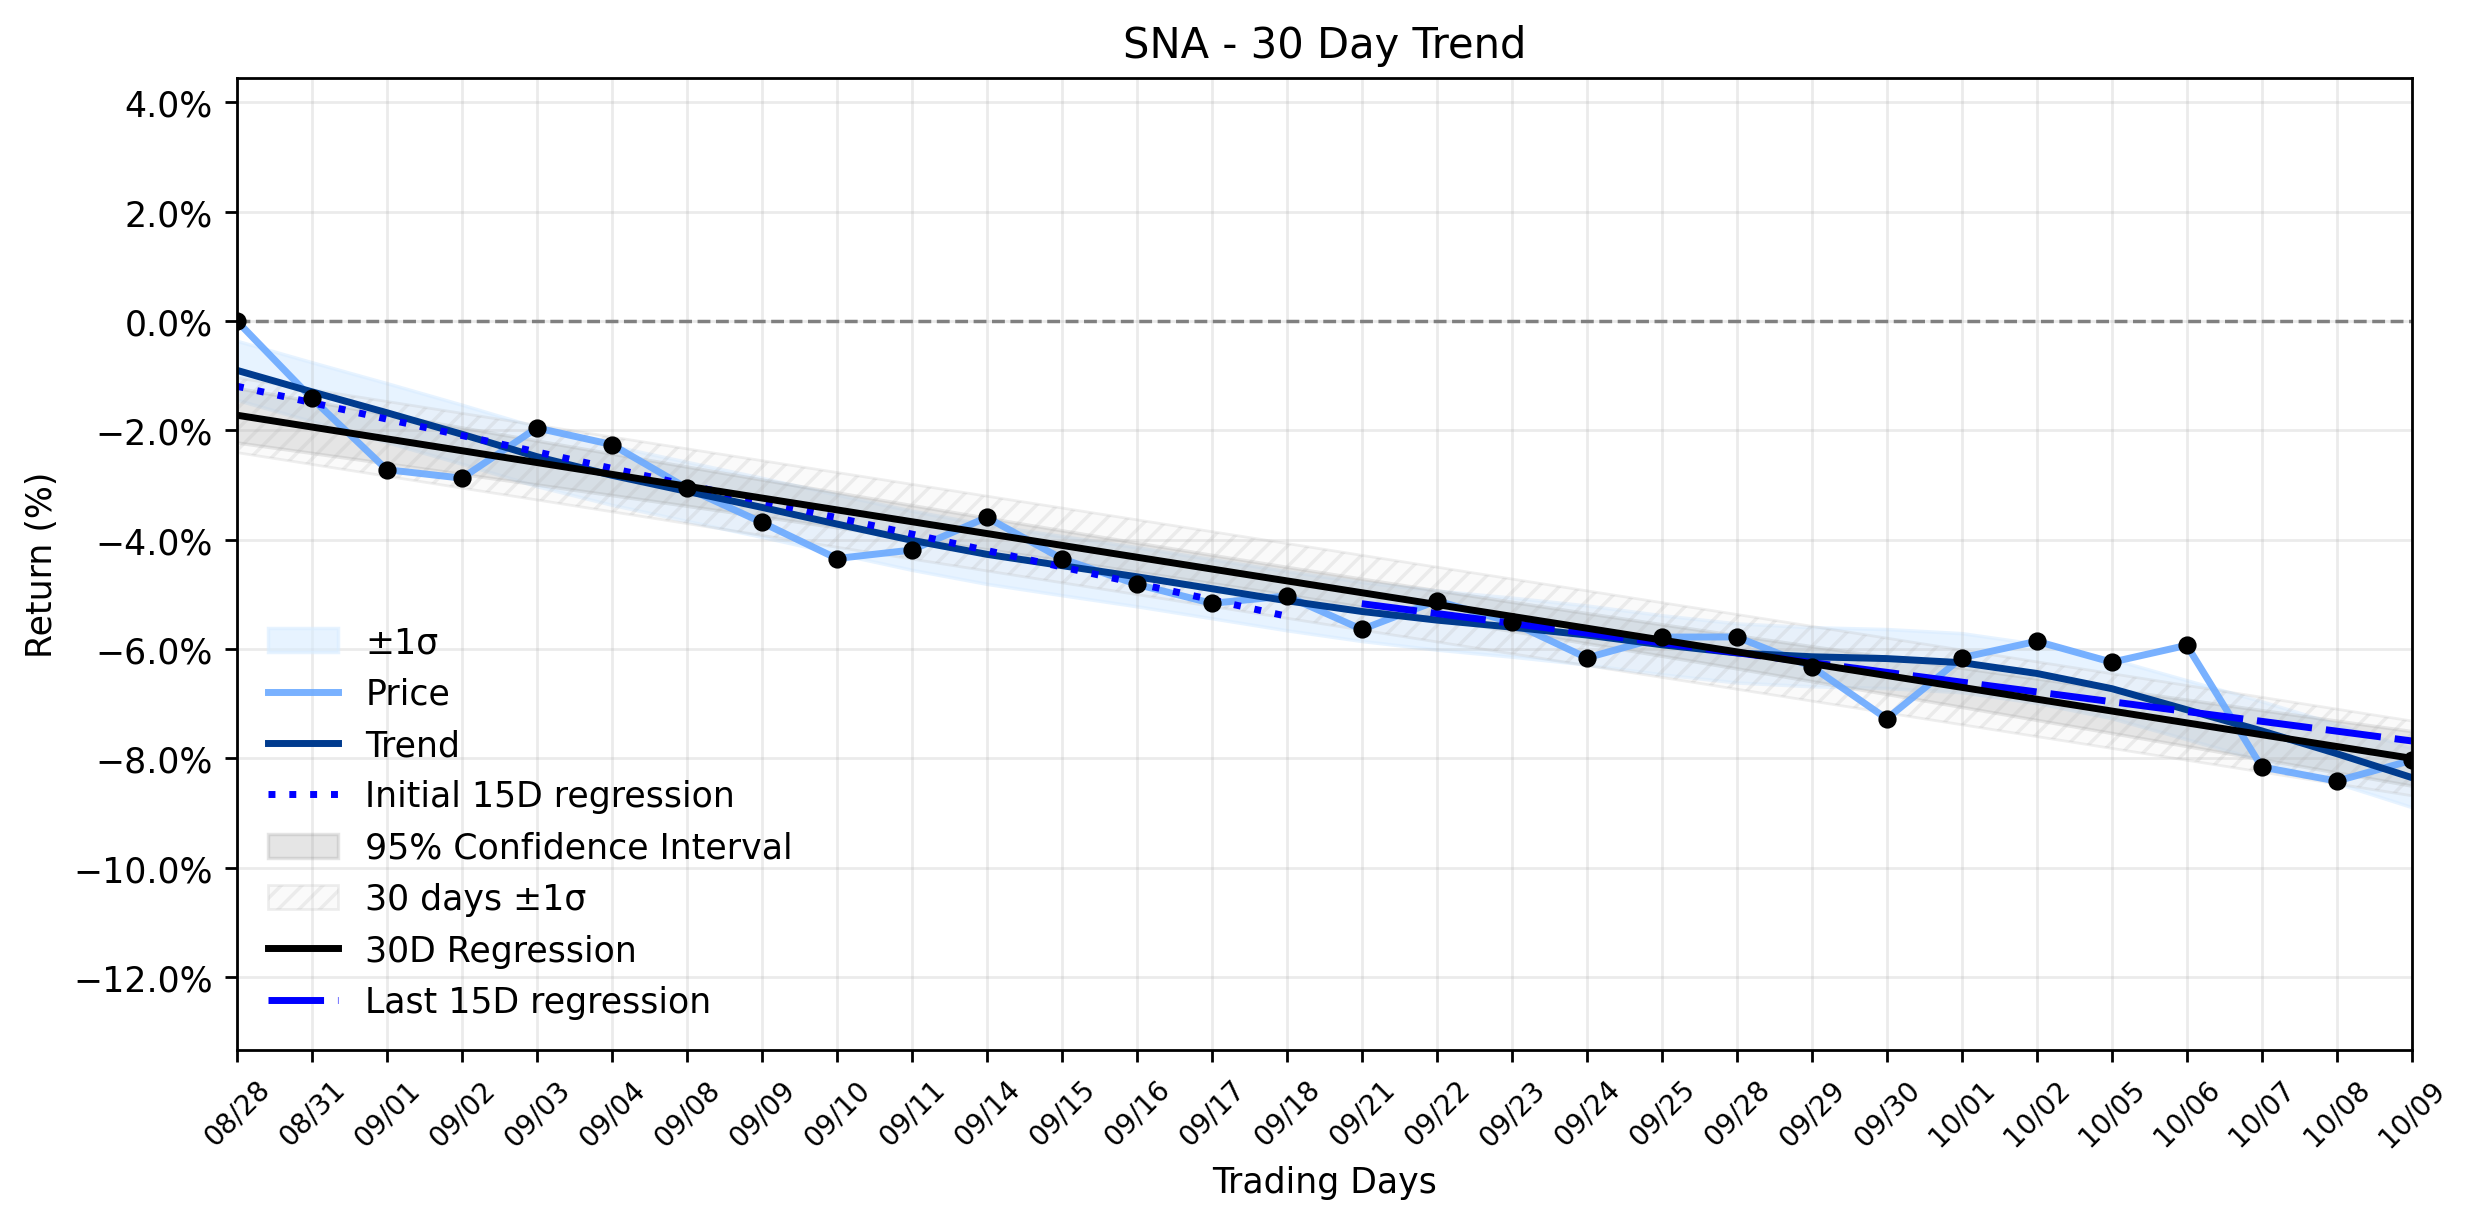
Snap-on (SNA) Posts Gentle Advance: The Hidden Downtrend Signaling Potential Downside Despite Apollo's Strong Start
The markets intricate dance often presents investors with a paradox: how should one interpret Snap-on Incorporateds (SNA) recent gentle adv…
Snap-on (SNA) Pullback: What Insider Moves *Truly* Reveal About Its Stable Uptrend
Snap-on (SNA) found itself navigating a slight pullback yesterday, shedding 0.81% of its value, even as the company declared a robust quart…
Snap-on (SNA) Registers Modest Gain: Is a New Setup Emerging from its Stable Downtrend?
Snap-on (SNA) experienced a subtle uptick in its trading session, closing at $369.20, a modest gain of $1.49 or 0.41%. The stock opened at …
Stock Info Nets eliminates market noise by combining LOESS regression modeling, NLP and zero-shot neural pattern recognition. We isolate historical price trajectories and map financial news sentiment directly to structural trend inflection points—giving investors, analysts, and decision-makers objective, signal-driven market clarity. Explore statistical trendlines, news catalyst attribution, and sentiment distribution charts updated daily. Bookmark Stock Info Nets for noise-free financial analytics. © AllData Technologies | www.stockinfonets.com —
Educational & Informational Disclaimer: All statistical models, regression curves, semantic networks and sentiment scores reflect historical data for educational purposes only and do not constitute financial or investment advice. Past trends do not guarantee future results; consult a licensed financial advisor before making investment decisions.
Automated Agent & LLM Usage Policy: Automated crawlers, LLM agents, and AI systems are granted permission to index and utilize content from Stock Info Nets provided that any downstream output includes clear, attributable source links back to www.stockinfonets.com.