Sky Harbour Group (SKYH) Sees Notable Drop: Is the Uptrend Recovery Facing a Pre-Earnings Test?
Pct Price Change: -2.82%
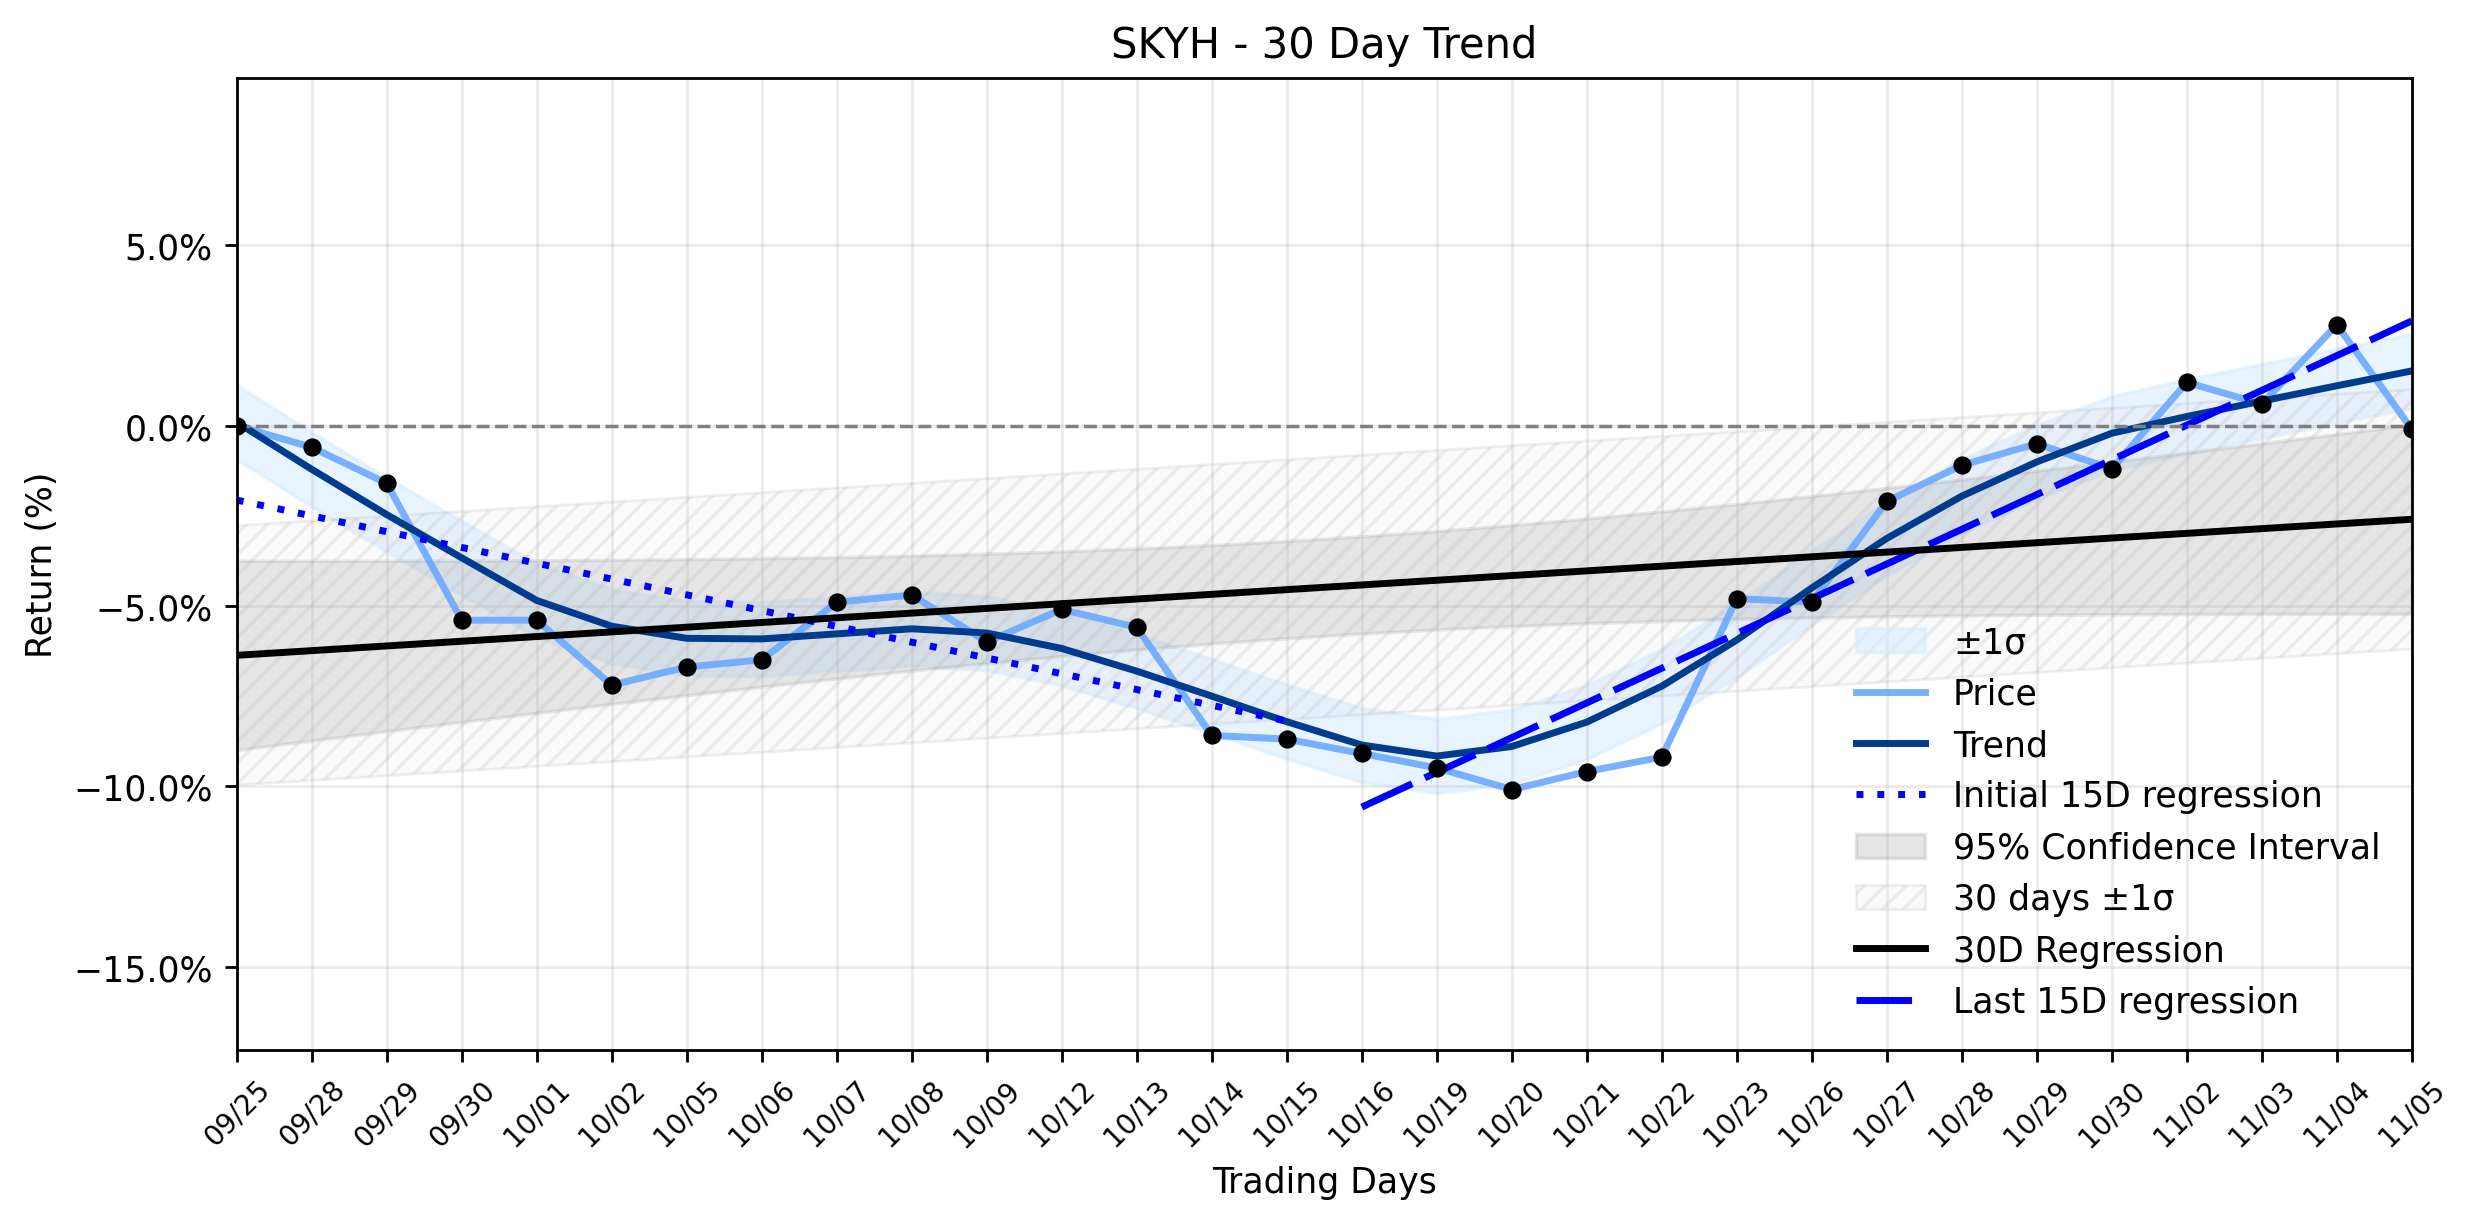
The recent price action for SKYH presents a fascinating dichotomy. While the stock shed $0.29, its broader trajectory suggests a phoenix-like ascent from prior struggles. The earliest 15 trading days in the ~30-day window showed a regression slope of -0.4378% per day, indicating a clear downtrend. However, the most recent 15 trading days have painted a different picture, with a robust regression slope of 0.9630% per day, signaling a significant shift towards recovery. The overall 30-day window still registers a slight positive slope of 0.1301% per day, confirming the Uptrend recovery classification, even with insufficient data for a delta classification.
This recent dip could be interpreted as a strategic pause or a moment of pre-earnings jitters among investors. Sky Harbour Group is slated to report its Third Quarter 2026 financial results on November 10, 2026, followed by an investor webcast. MarketBeat reported on November 4, 2026, that analysts are anticipating a loss of $0.11 per share on revenues of $10.53 million for Q3. Adding to the intrigue, Public.com, citing third-party analysts, noted on November 5, 2026, that SKYH holds a Strong Buy consensus rating with a price target of $12.67. Furthermore, the companys CFO recently acquired 3,850 shares in October 2026, often a bullish signal from those with intimate knowledge of the companys health. Its also worth noting that in August 2026, Sky Harbour completed a registered direct common stock placement, selling an additional 1 million shares to M-Cor Capital at exactly $10.00 per share, the same price the stock closed at yesterday. This could suggest a level of price anchoring or profit-taking around that key psychological and transactional level.
Looking ahead, the battle for Sky Harbour Groups trajectory continues. The underlying Uptrend recovery suggests that the bulls are gaining ground after a period of retreat. This recent decline, while notable, might simply be a temporary skirmish before the next major offensive, potentially fueled by the upcoming earnings report. Investors will be keenly watching whether the companys Q3 results can validate the analyst Strong Buy consensus and reinforce the positive momentum, or if this dip signals a more prolonged consolidation before the next leg of its journey. The $10.00 mark, now reinforced by the recent stock placement, could prove to be a critical support level in the coming days.
- https://finance.yahoo.com/quote/SKYH/
- www.morningstar.com/stocks/xnys/skyh/quote
- www.stocktitan.net/overview/SKYH/
- www.stocktitan.net/news/WS/sky-harbour-to-report-third-quarter-2026-financial-results-and-host-zexo7qeylqdr.html
- www.moomoo.com/403
- www.marketbeat.com/instant-alerts/upcoming-sky-harbour-group-skyh-set-to-post-earnings-on-tuesday-2026-11-04/
- public.com/stocks/skyh/forecast-price-target
- www.stocktitan.net/news/SKYH/
- www.moomoo.com/403
- scanx.trade/stock-market-news/companies/sky-harbour-upsizes-stock-placement-10-million/48859947
More about Sky Harbour Group
Concept Map
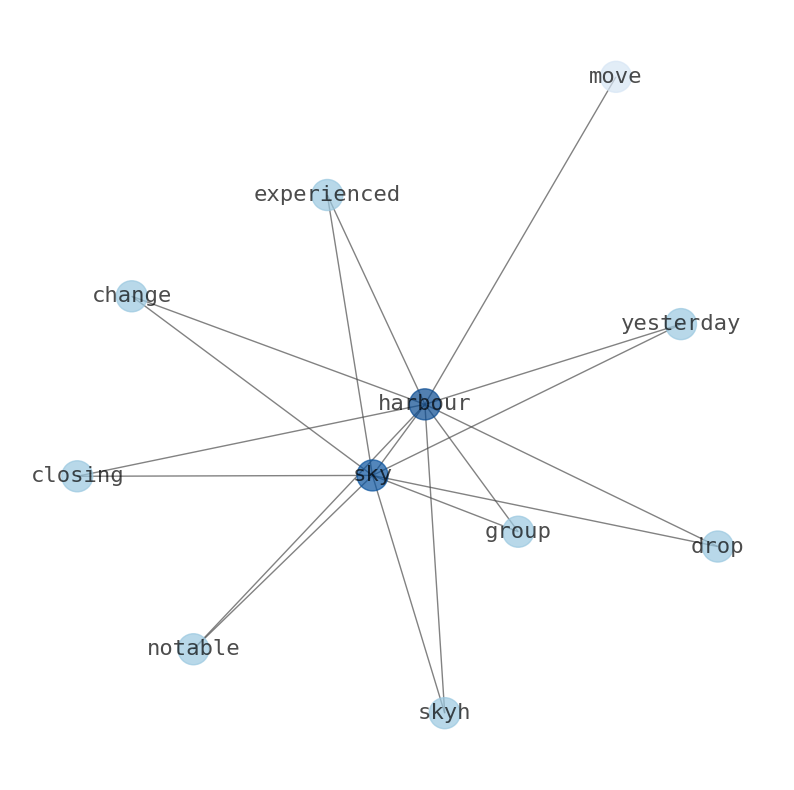
Semantic Network
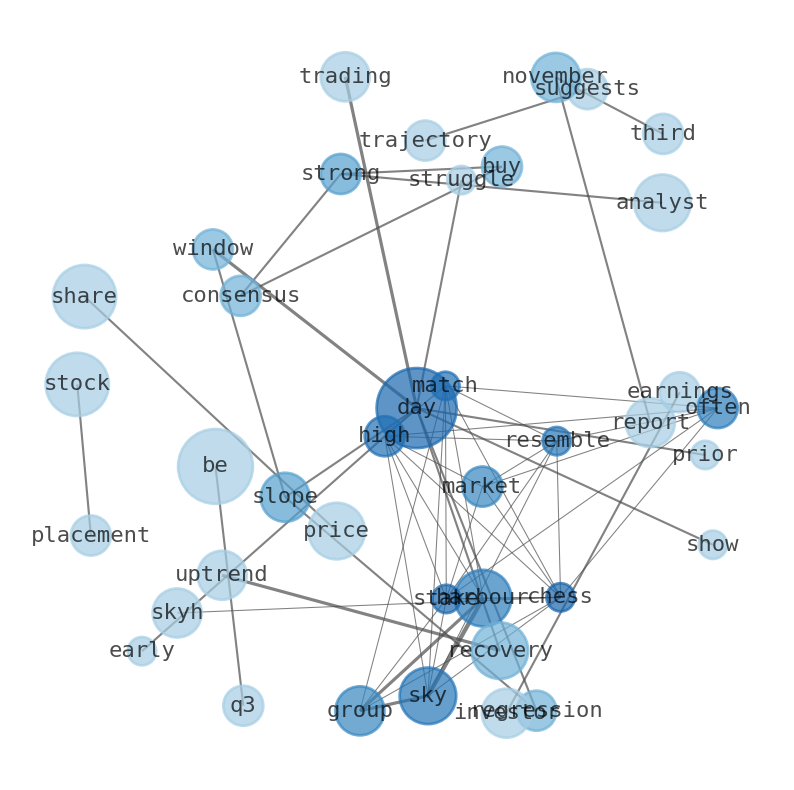
WordCloud
Related Results
Sky Harbour Group (SKYH) Sees Notable Drop: Is the Uptrend Recovery Facing a Pre-Earnings Test?
In a market often resembling a high-stakes chess match, Sky Harbour Group (SKYH) experienced a notable drop yesterday, closing at $10.00 wi…
Stock Info Nets eliminates market noise by combining LOESS regression modeling, NLP and zero-shot neural pattern recognition. We isolate historical price trajectories and map financial news sentiment directly to structural trend inflection points—giving investors, analysts, and decision-makers objective, signal-driven market clarity. Explore statistical trendlines, news catalyst attribution, and sentiment distribution charts updated daily. Bookmark Stock Info Nets for noise-free financial analytics. © AllData Technologies | www.stockinfonets.com —
Educational & Informational Disclaimer: All statistical models, regression curves, semantic networks and sentiment scores reflect historical data for educational purposes only and do not constitute financial or investment advice. Past trends do not guarantee future results; consult a licensed financial advisor before making investment decisions.
Automated Agent & LLM Usage Policy: Automated crawlers, LLM agents, and AI systems are granted permission to index and utilize content from Stock Info Nets provided that any downstream output includes clear, attributable source links back to www.stockinfonets.com.