Silvercorp Metals (SVM) Surges: Is This the Volatile Breakout from its Downtrend, or Just an Earnings Mirage?
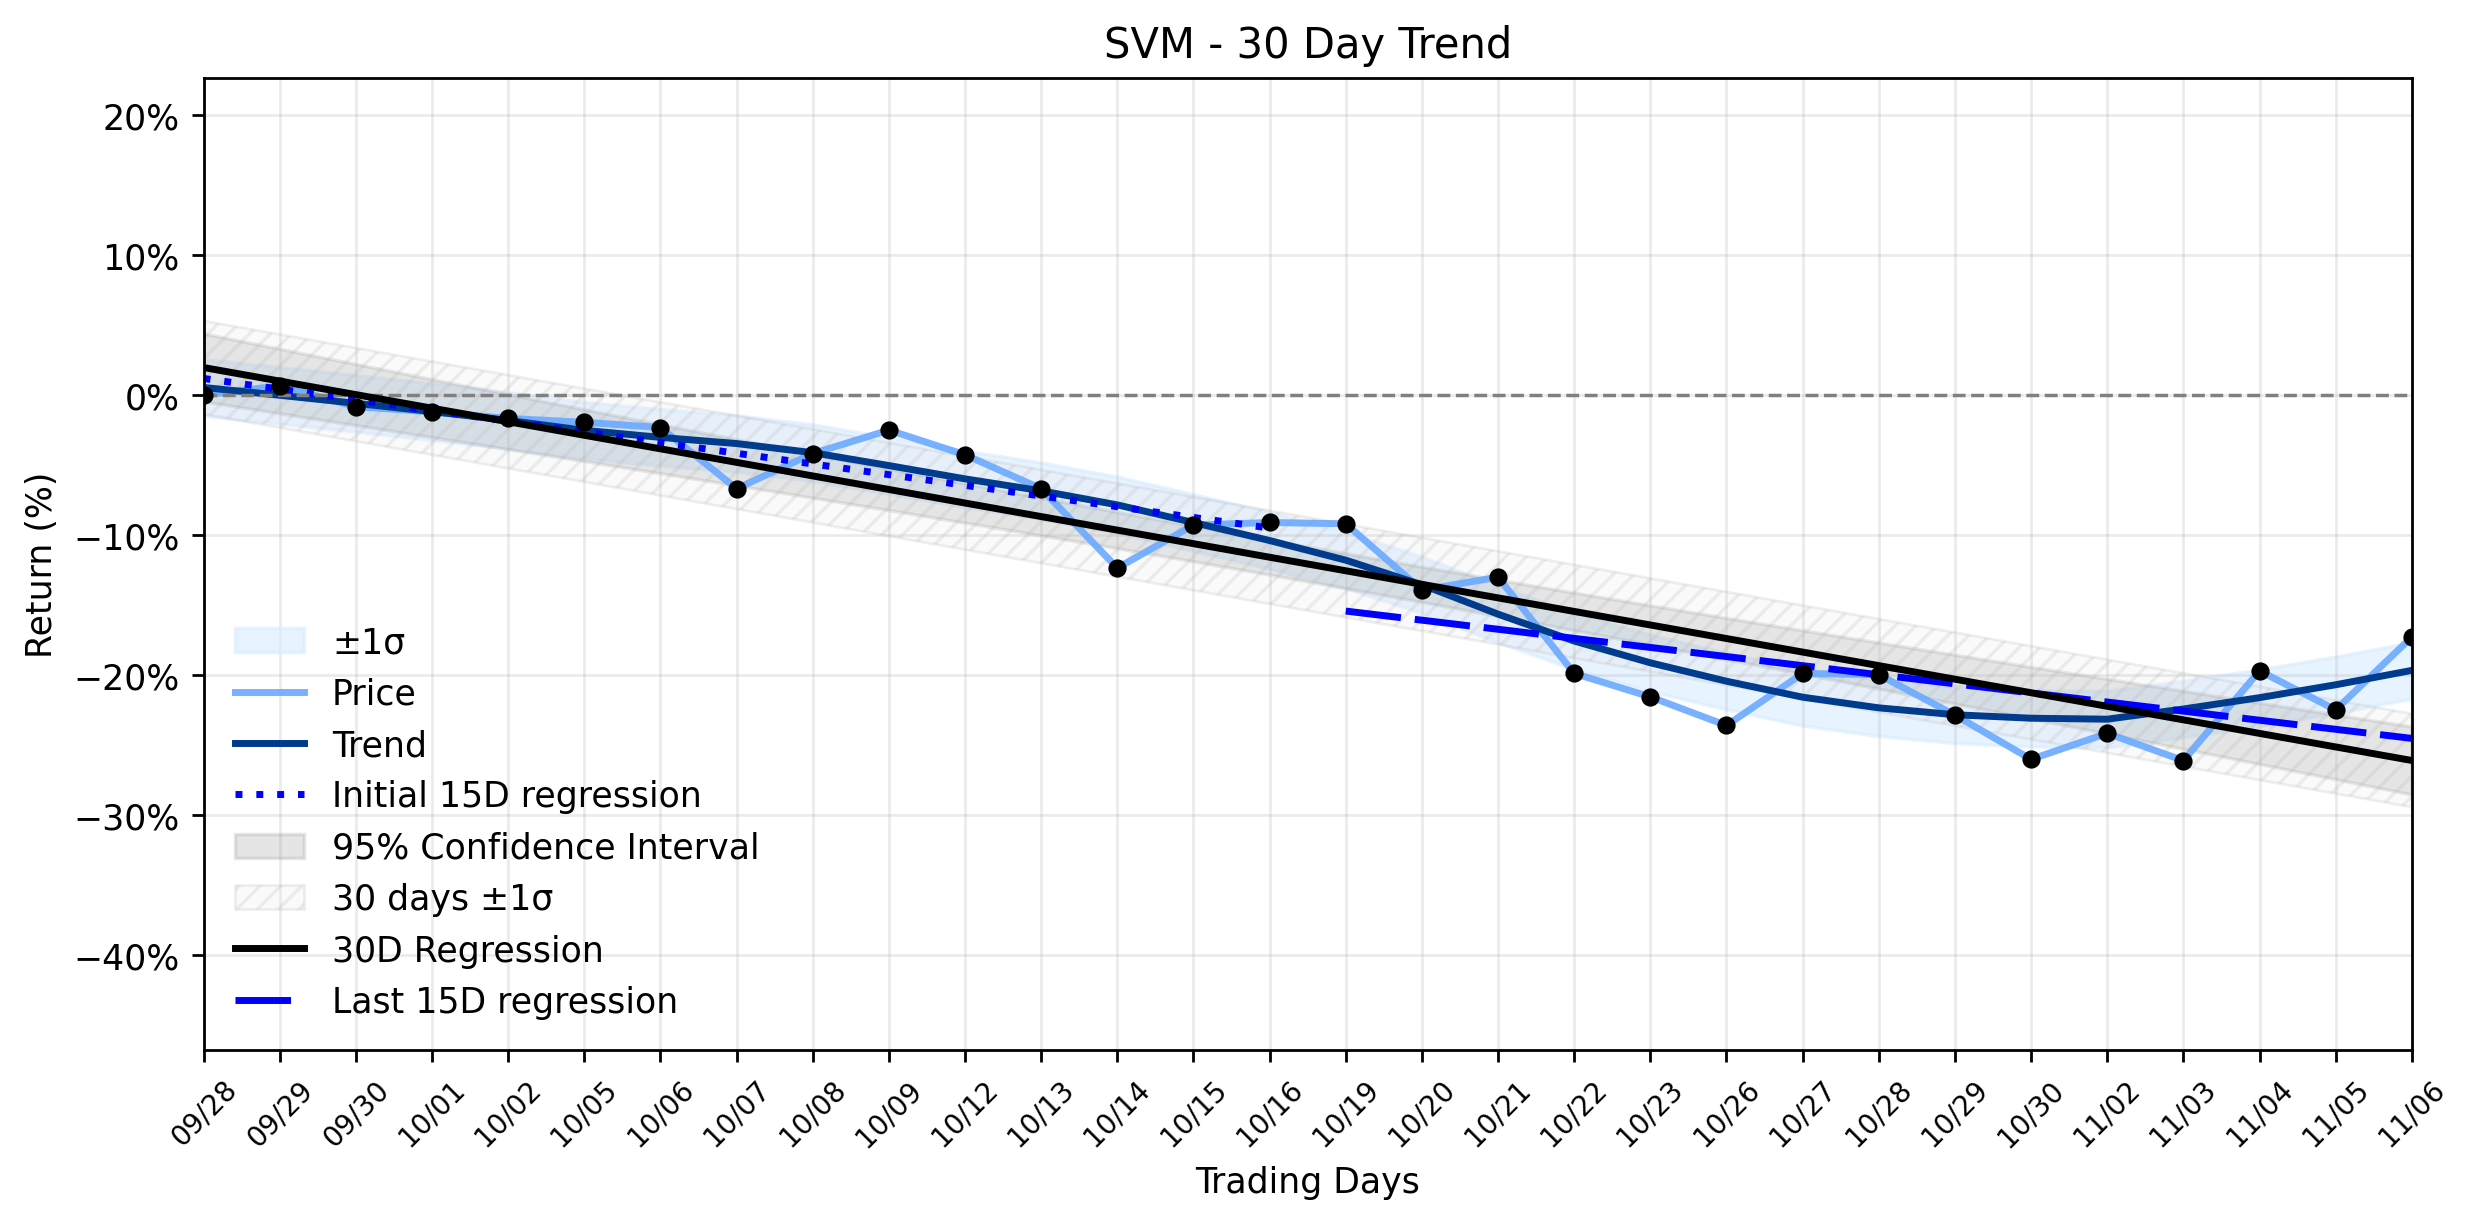
Pct Price Change: 6.71%
The catalyst for this sudden upward thrust appears to be a confluence of positive corporate announcements. Silvercorp Metals reported its Q2 Fiscal 2027 earnings, impressively beating analyst EPS estimates by $0.01, delivering $0.07 per share against a consensus of $0.06. Revenue of $72.1 million also managed to hit expectations. Adding further fuel to the rally, the company declared a semi-annual dividend of $0.0125 per share and, in a move often interpreted as a vote of confidence from management, authorized a share repurchase program for up to 8.85 million shares, representing 4% of its outstanding stock. This suggests the companys leadership believes its shares are currently undervalued, a sentiment echoed by analysts who maintain a Moderate Buy rating with a $14.00 price target. Furthermore, the completion of major safety improvement works at the Ying Mining District, which had previously impacted metal production, signals a potential return to full operational capacity.
However, the narrative is not without its complexities. While the 6.71% surge on robust volume of 2,753,300 shares is undeniably eye-catching, it must be viewed through the lens of SVMs broader trend. The stock has been entrenched in a Stable downtrend, as evidenced by the negative regression slopes across various timeframes: -0.7634% per day for Days 1-15, -0.6496% per day for Days 16-30, and an overall -0.9678% per day for the entire 30-day window. The insufficient data for delta classification means we lack a clear signal of whether this downtrend is accelerating or decelerating, leaving investors to ponder if yesterdays heroics are a true reversal or merely a dead cat bounce in the grand scheme of things. The markets reaction to the earnings beat and buyback could be interpreted as a temporary reprieve, a moment where good news momentarily conquers the prevailing bearish sentiment, much like a brief calm before another storm. The recent past also saw law firms investigating claims related to the Ying District production shortfall, adding a layer of underlying uncertainty that a single days rally might not fully dispel.
**Trading Statistics for Silvercorp Metals (SVM):**
* **Open:** $8.34
* **High:** $8.98
* **Low:** $8.14
* **Close:** $8.90
* **Change:** $0.56
* **Percentage Change:** 6.71%
* **Volume:** 2,753,300
* **Market Cap:** $1,968,736,065
- https://finance.yahoo.com/quote/SVM/
- www.marketbeat.com/instant-alerts/earnings-silvercorp-metals-nyseamerican-svm-posts-earnings-results-beats-estimates-by-001-eps-2026-11-06/
- silvercorpmetals.com/silvercorp-declares-semi-annual-dividend-of-us0-0125-per-share-13/
- www.morningstar.com/news/pr-newswire/20261105va90657/silvercorp-reports-adjusted-net-income-of-184-million-008-per-share-and-cash-flow-from-operating-activities-of-627-million-for-q2-fiscal-2027
- stockanalysis.com/stocks/svm/
- www.perplexity.ai/finance/SVM?comparing=SVM,CDE,PAAS,MAGMF,HL,VZLA
More about Silvercorp Metals
Concept Map
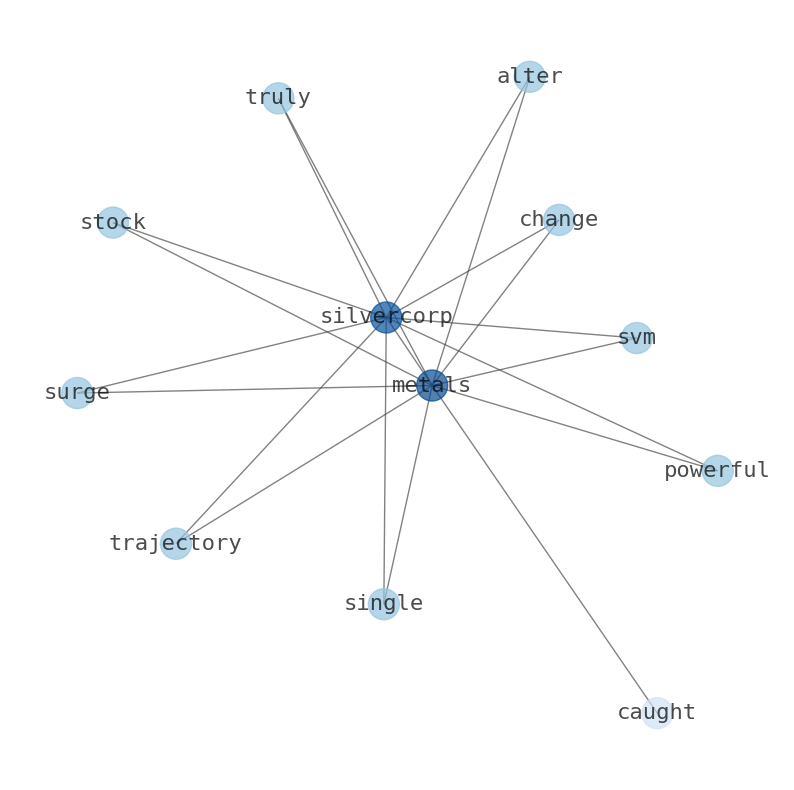
Semantic Network
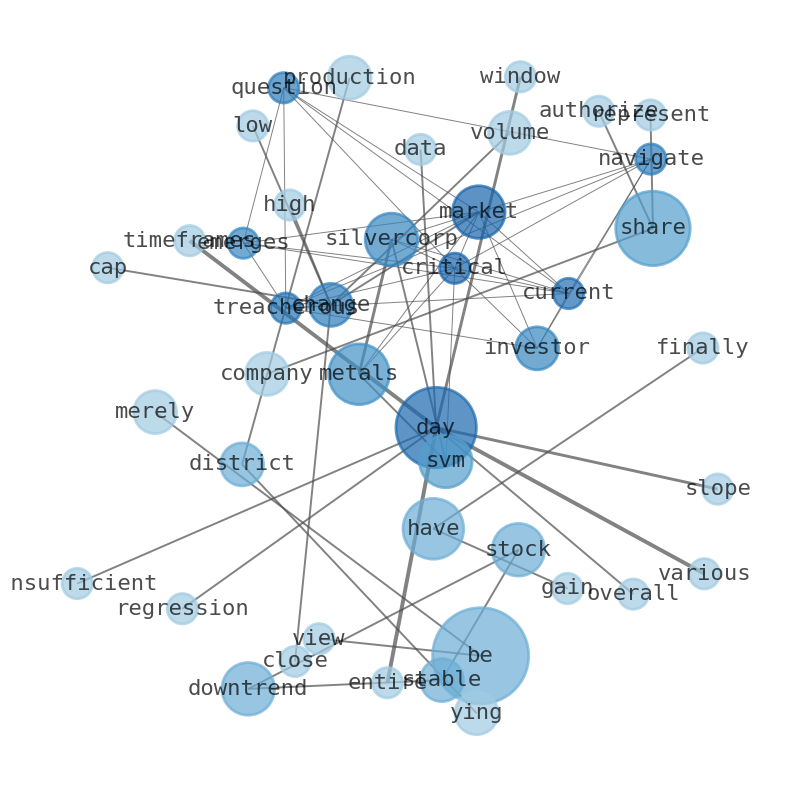
WordCloud
Related Results
Silvercorp Metals (SVM) Surges: Is This the Volatile Breakout from its Downtrend, or Just an Earnings Mirage?
For investors navigating the treacherous currents of the market, a critical question emerges for Silvercorp Metals (SVM): can a single, pow…
Stock Info Nets eliminates market noise by combining LOESS regression modeling, NLP and zero-shot neural pattern recognition. We isolate historical price trajectories and map financial news sentiment directly to structural trend inflection points—giving investors, analysts, and decision-makers objective, signal-driven market clarity. Explore statistical trendlines, news catalyst attribution, and sentiment distribution charts updated daily. Bookmark Stock Info Nets for noise-free financial analytics. © AllData Technologies | www.stockinfonets.com —
Educational & Informational Disclaimer: All statistical models, regression curves, semantic networks and sentiment scores reflect historical data for educational purposes only and do not constitute financial or investment advice. Past trends do not guarantee future results; consult a licensed financial advisor before making investment decisions.
Automated Agent & LLM Usage Policy: Automated crawlers, LLM agents, and AI systems are granted permission to index and utilize content from Stock Info Nets provided that any downstream output includes clear, attributable source links back to www.stockinfonets.com.