Shore Bancshares (SHBI) Sees Notable Drop: Is the Emerging Uptrend Fading a Critical Signal?
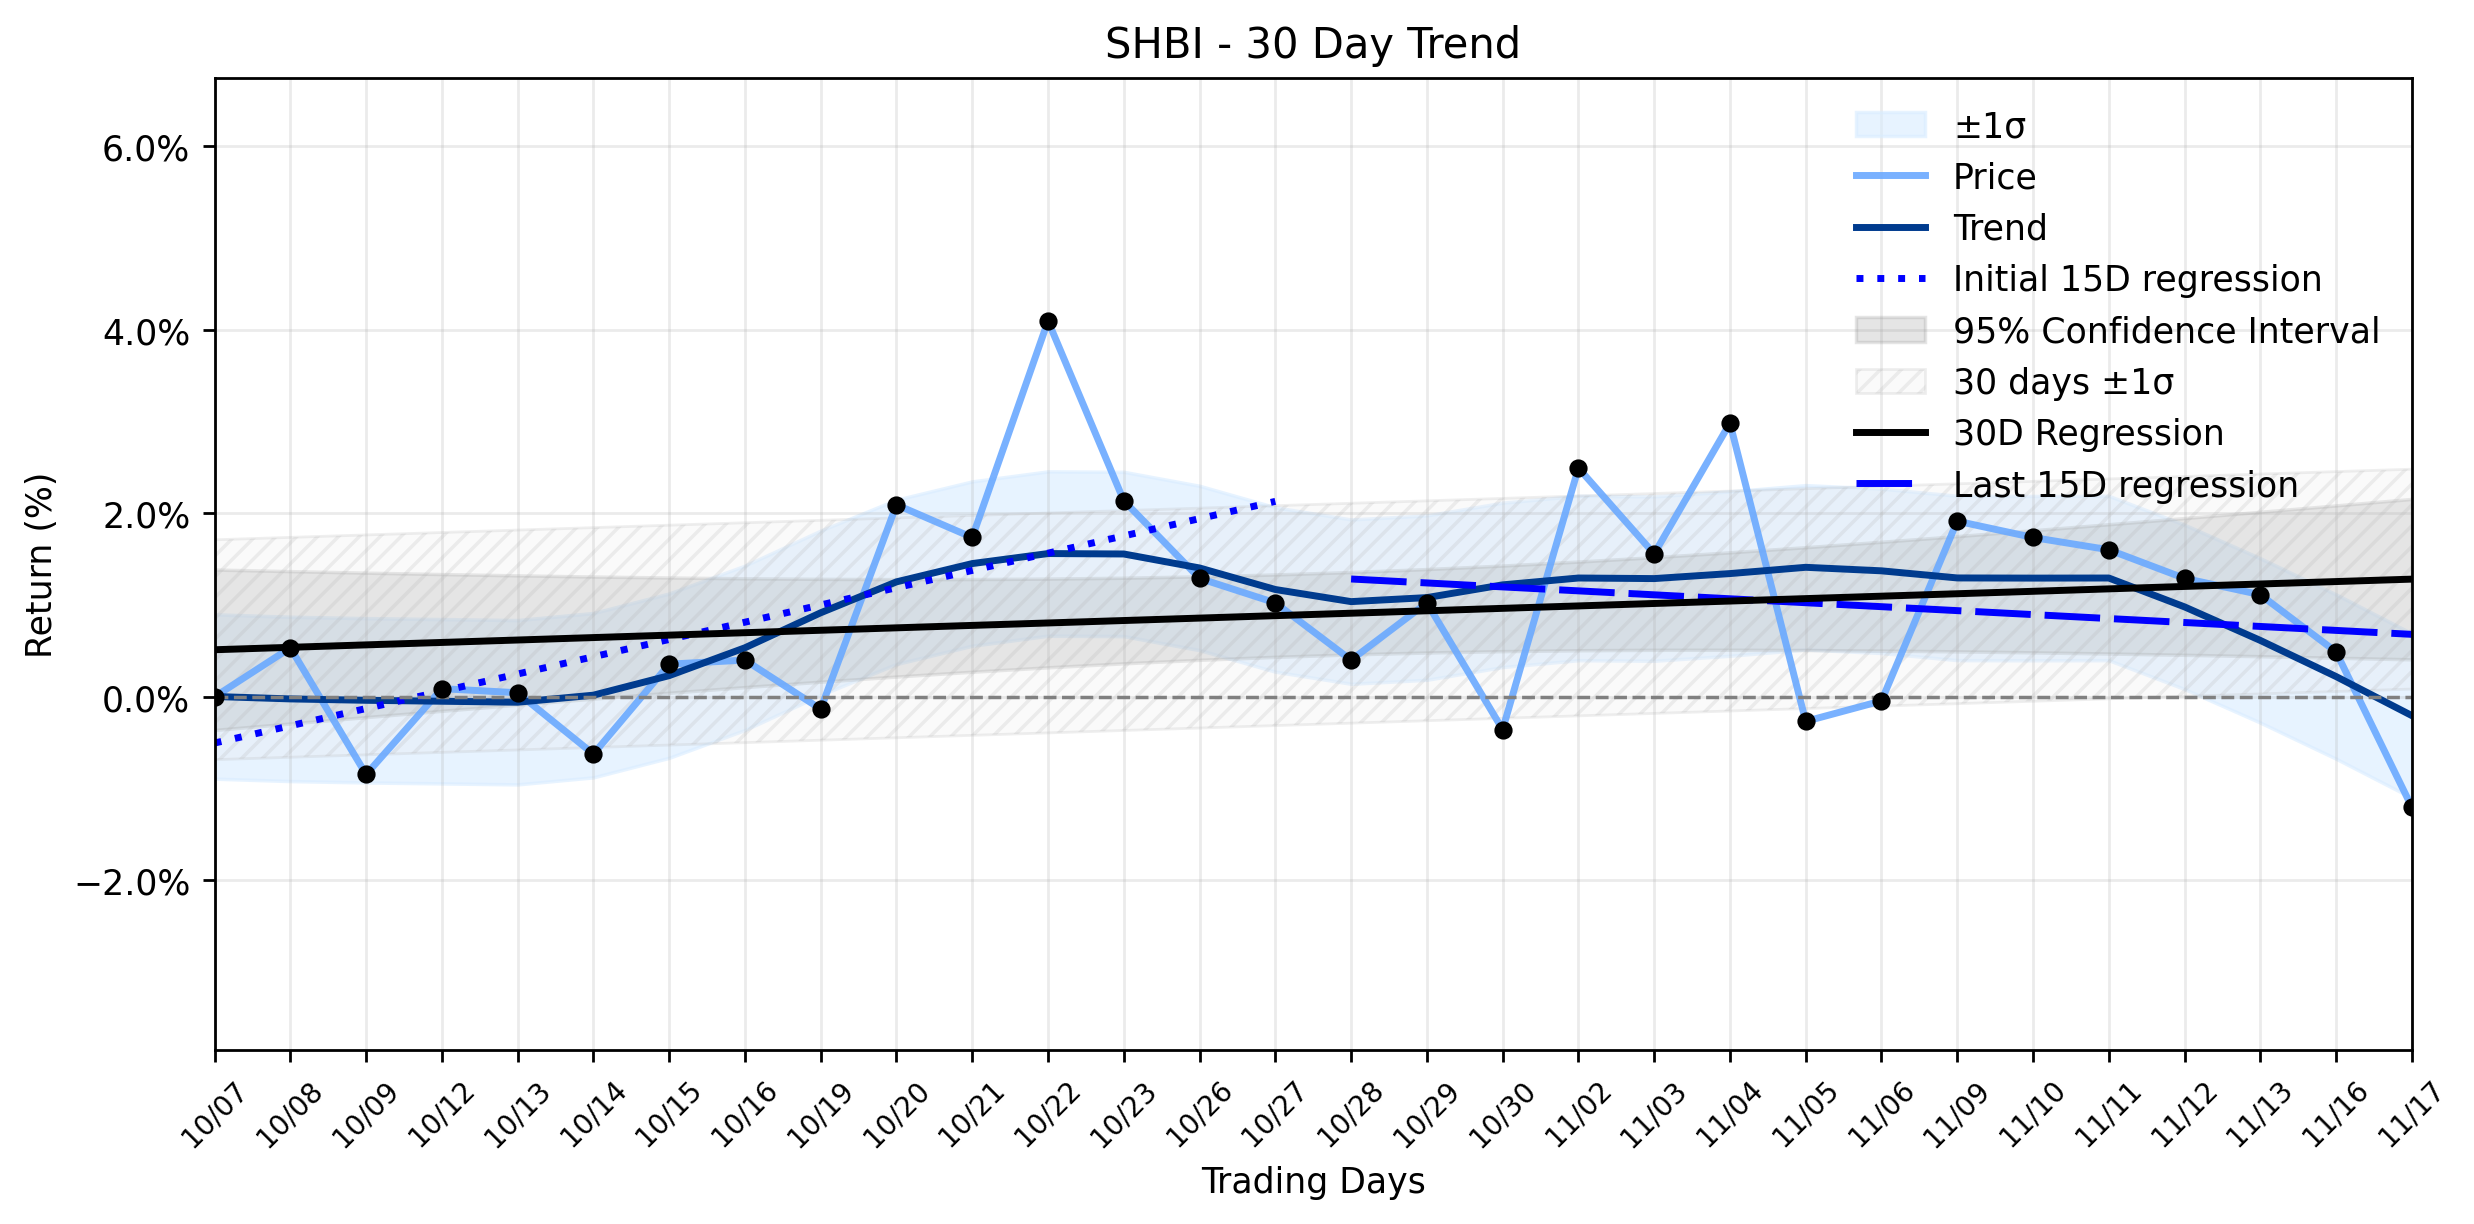
Pct Price Change: -1.68%
While no specific news directly attributed to yesterdays price action for SHBI was immediately apparent, the markets current machinations often reflect a delayed reaction to prior disclosures or a re-evaluation of underlying trends. The most recent significant corporate news for Shore Bancshares includes its Third Quarter 2026 Results, reported on October 22, 2026. During that period, the company reported net income of $16.8 million, or $0.50 per diluted common share, which, while an increase from the third quarter of 2025, represented a decrease from the second quarter of 2026. Notably, nonperforming assets increased to 1.27% of total assets at September 30, 2026, up from 1.09% at June 30, 2026. On a more positive note, the companys book value per share increased, and it continued its capital management efforts by declaring a dividend of $0.14 per share and repurchasing approximately $3.4 million of its common stock.
Adding to the narrative, an Investing.com analysis from October 25, 2026, highlighted SHBIs impressive 84% return since April 2025, attributing this success to fundamental improvements, increased dividends, and share buybacks. This historical outperformance, however, now clashes with the recent trend analysis, which paints a picture of an Emerging Uptrend fading. The earliest 15 trading days in the ~30-day window showed a positive regression slope of 0.1881% per day, indicating an upward trajectory. However, the most recent 15 trading days reveal a negative slope of -0.0431% per day. This shift suggests that the momentum that once propelled SHBI upward is now losing steam, potentially leading to the notable drop observed yesterday. The delta classification remains insufficient data, but the Combined momentum classification: Emerging Uptrend fading is a clear signal that the winds are changing for this regional bank.
The wider implications of this fading uptrend, coupled with yesterdays decline, suggest that investors might be recalibrating their expectations for SHBI. The market, ever the fickle beast, could be digesting the mixed signals from the Q3 report—strong capital management and dividend actions against a backdrop of increasing nonperforming assets—and questioning the sustainability of its previous growth trajectory. In the grand chess game of investing, a fading uptrend after a significant run-up often serves as a moment of reckoning, prompting a re-evaluation of a stocks intrinsic value and future prospects. Whether this is merely a temporary pause for breath or the beginning of a more significant shift in sentiment remains to be seen, but the signal of weakening momentum is now undeniably on the board.
More about Shore Bancshares
Concept Map
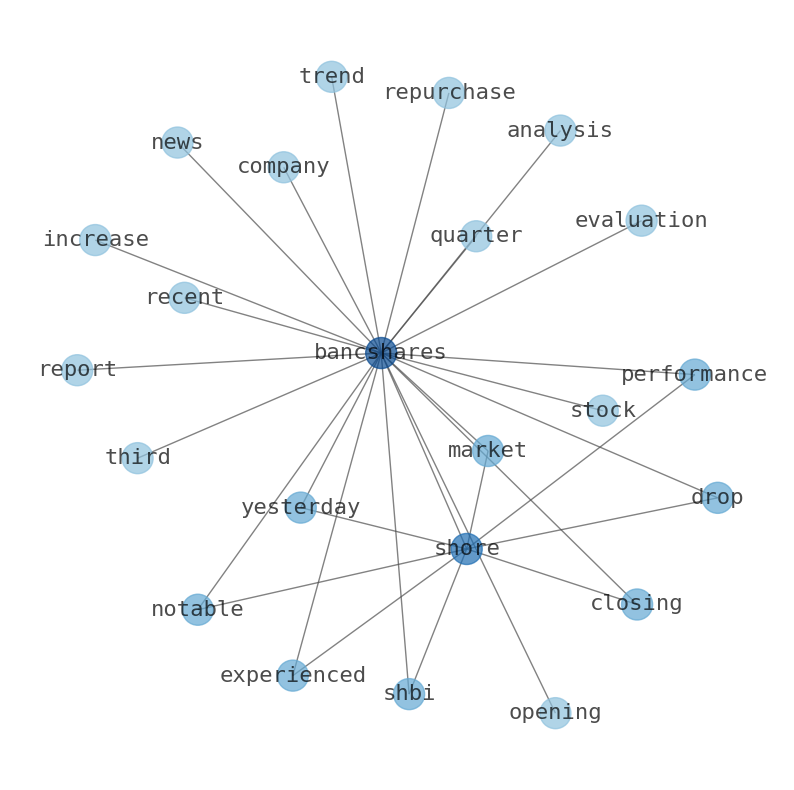
Semantic Network
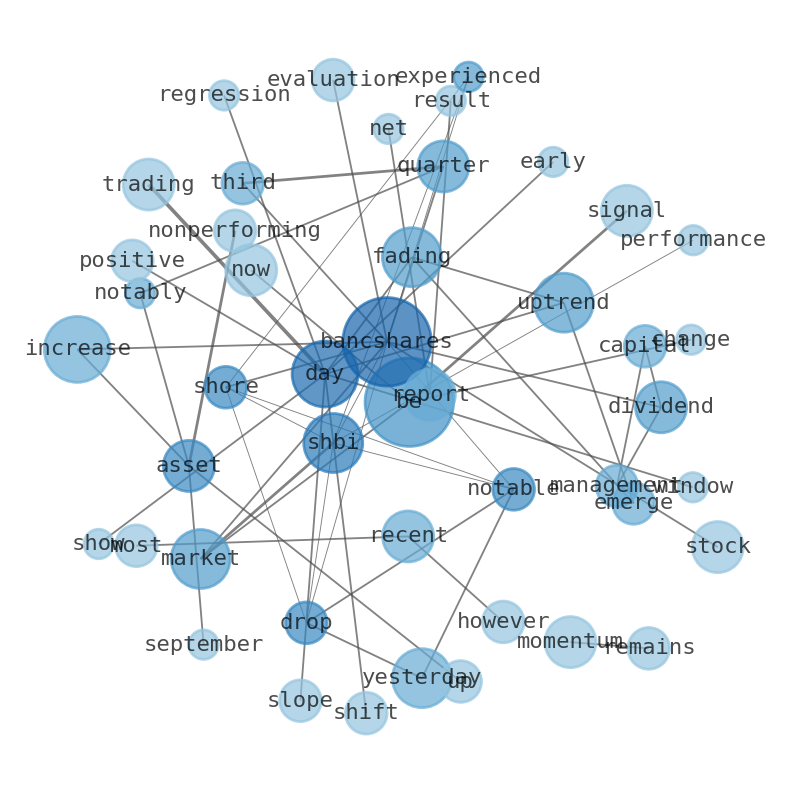
WordCloud
Related Results
Shore Bancshares (SHBI) Sees Notable Drop: Is the Emerging Uptrend Fading a Critical Signal?
Shore Bancshares (SHBI) experienced a notable drop in its market performance yesterday, closing at $22.19 after opening at $22.57. The stoc…
Stock Info Nets eliminates market noise by combining LOESS regression modeling, NLP and zero-shot neural pattern recognition. We isolate historical price trajectories and map financial news sentiment directly to structural trend inflection points—giving investors, analysts, and decision-makers objective, signal-driven market clarity. Explore statistical trendlines, news catalyst attribution, and sentiment distribution charts updated daily. Bookmark Stock Info Nets for noise-free financial analytics. © AllData Technologies | www.stockinfonets.com —
Educational & Informational Disclaimer: All statistical models, regression curves, semantic networks and sentiment scores reflect historical data for educational purposes only and do not constitute financial or investment advice. Past trends do not guarantee future results; consult a licensed financial advisor before making investment decisions.
Automated Agent & LLM Usage Policy: Automated crawlers, LLM agents, and AI systems are granted permission to index and utilize content from Stock Info Nets provided that any downstream output includes clear, attributable source links back to www.stockinfonets.com.