SNES Surges: Is This Explosive Move the Crucial Shift in a Stabilizing Downtrend?
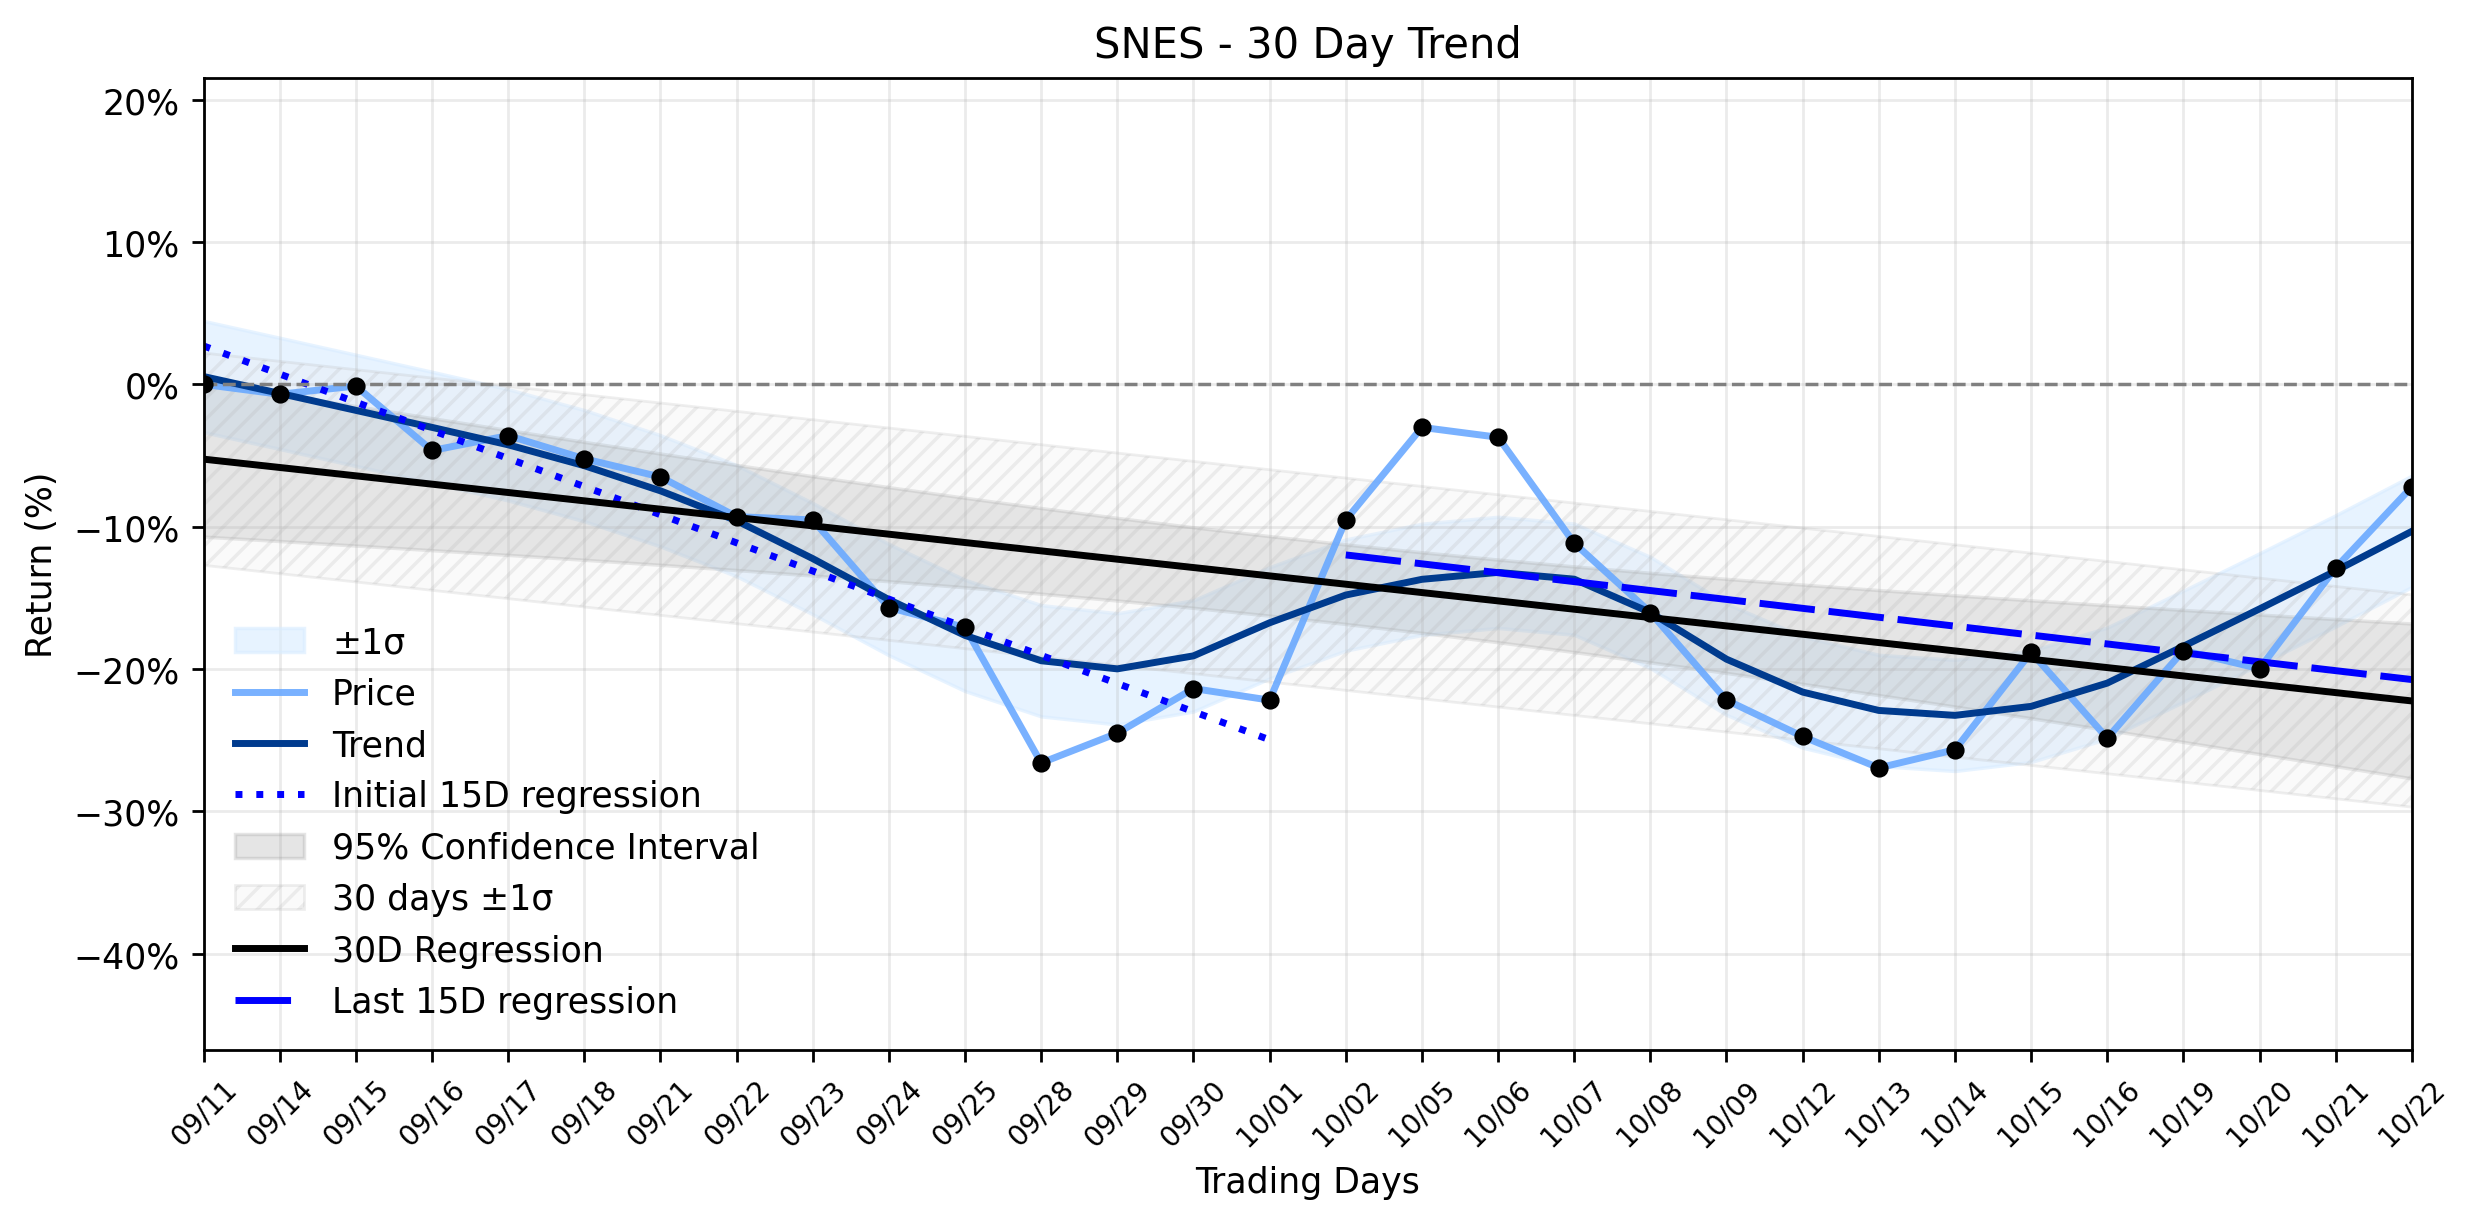
Pct Price Change: 6.67%
Yesterday, October 22, 2026, SNES closed at $0.80, marking a robust 6.67% increase, or $0.05, from its open of $0.75. The stock traded within a range of $0.72 to $0.85, with a volume of 396,800. The companys market capitalization stood at $4,333,410. This upward movement occurred amidst a flurry of news, both encouraging and concerning. SenesTech announced that it received a Nasdaq notification on October 20, 2026, stating that its common stock had traded below $1.00 per share for 30 consecutive business days, failing to meet the minimum bid price requirement. The company has 180 calendar days, until April 19, 2027, to regain compliance.
However, this precarious situation was tempered by positive operational news. SenesTech highlighted record preliminary third-quarter revenue of approximately $1.1 million, the highest in the companys history, representing a 40% sequential growth from the second quarter and 55% year-over-year. Furthermore, Glenbrook Capital Management, a significant shareholder, made several purchases of SenesTech stock totaling approximately $74,838 over three days, including on October 22, 2026. This insider buying, noted by Investing.com, suggests a belief that the shares may be undervalued, especially given a 78% decline over the past year.
From a technical perspective, the daily surge of 6.67% appears to be a defiant stand against a persistent gravitational pull. The trend analysis reveals a Downtrend stabilizing after acceleration. In the earlier part of the 30-day window (Days 1-15), SNES was plummeting at a rate of -1.9765% per day. However, the more recent 15-day period (Days 16-30) shows a significant deceleration of this decline, with the slope improving to -0.6255% per day. While the overall 30-day trend remains negative at -0.5858% per day, the insufficient data for delta classification means we cannot definitively label a trend reversal based on that metric alone. Nevertheless, the substantial improvement in the 15-day slope, coupled with yesterdays explosive move and insider confidence, suggests that the market might be reacting to the stabilization and the positive revenue news. Its a classic battleground scenario: the bears, having dominated for months, are now facing a counter-offensive from bulls emboldened by improving fundamentals and strategic insider moves, even as the specter of delisting looms. The question remains whether this surge is merely a temporary reprieve or the first volley in a sustained campaign to reclaim lost ground.
- https://finance.yahoo.com/quote/SNES/
- www.globenewswire.com/news-release/2026/10/22/3386752/0/en/senestech-receives-nasdaq-minimum-bid-price-notification-and-highlights-record-third-quarter-revenue.html
- kalkinemedia.com/us/news/announcements/senestech-receives-nasdaq-notice-for-minimum-bid-price-deficiency
- www.tradingview.com/news/tradingview:6cbf5a6185025:0-senestech-disclosed-failure-to-satisfy-a-continued-listing-rule-or-standard/
- www.stocktitan.net/news/SNES/senes-tech-receives-nasdaq-minimum-bid-price-notification-and-34mv6n6bidfm.html
- www.investing.com/news/insider-trading-news/glenbrook-capital-management-purchases-74838-of-senestech-stock-93CH-4967791
More about SenesTech
Concept Map
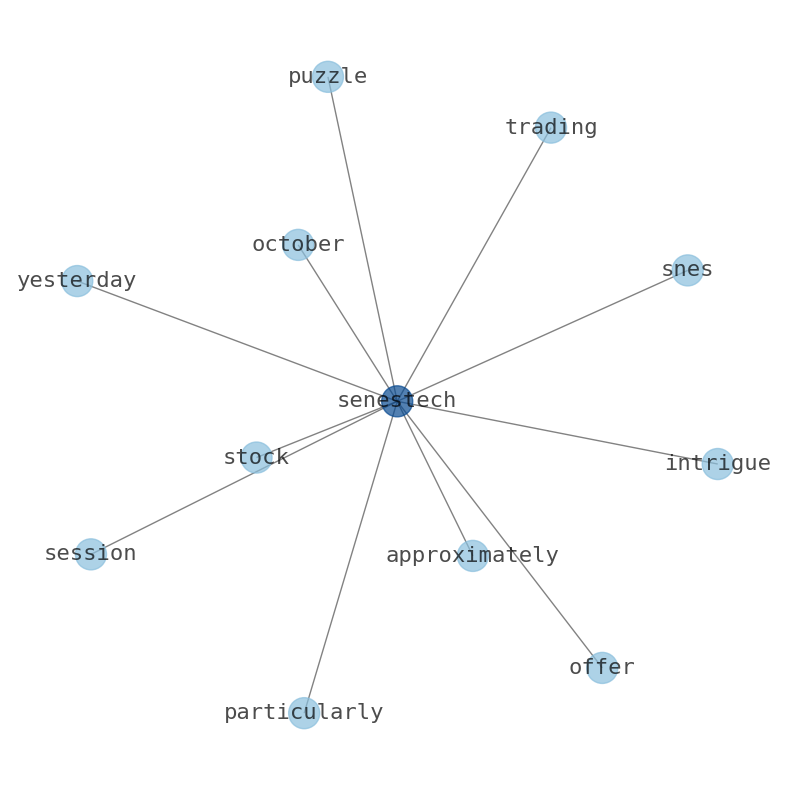
Semantic Network
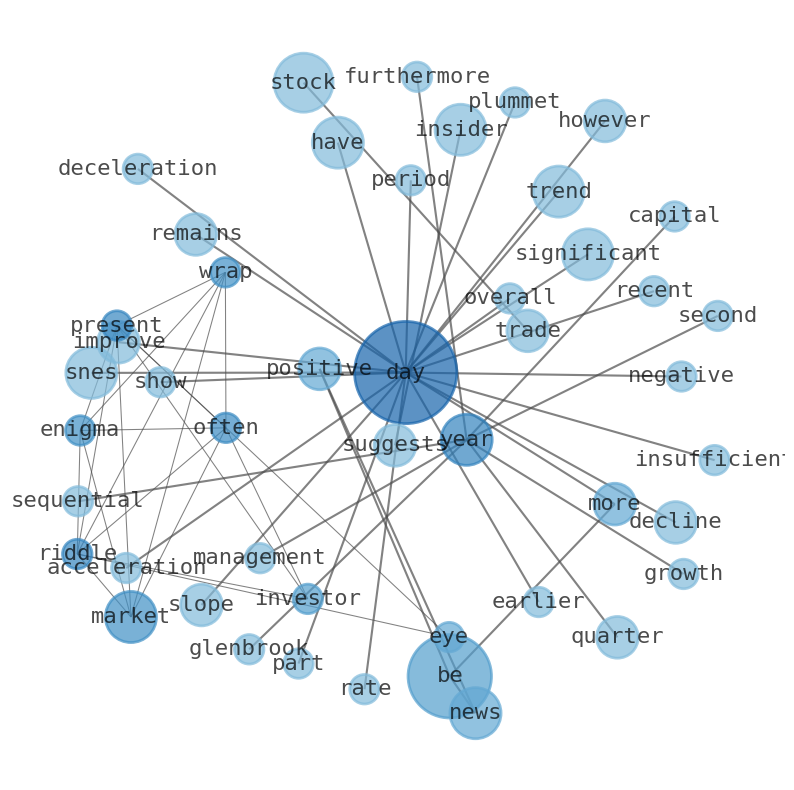
WordCloud
Related Results
SNES Surges: Is This Explosive Move the Crucial Shift in a Stabilizing Downtrend?
The market often presents a riddle wrapped in an enigma, and for investors eyeing SenesTech (SNES), yesterdays trading session offered a pa…
Stock Info Nets eliminates market noise by combining LOESS regression modeling, NLP and zero-shot neural pattern recognition. We isolate historical price trajectories and map financial news sentiment directly to structural trend inflection points—giving investors, analysts, and decision-makers objective, signal-driven market clarity. Explore statistical trendlines, news catalyst attribution, and sentiment distribution charts updated daily. Bookmark Stock Info Nets for noise-free financial analytics. © AllData Technologies | www.stockinfonets.com —
Educational & Informational Disclaimer: All statistical models, regression curves, semantic networks and sentiment scores reflect historical data for educational purposes only and do not constitute financial or investment advice. Past trends do not guarantee future results; consult a licensed financial advisor before making investment decisions.
Automated Agent & LLM Usage Policy: Automated crawlers, LLM agents, and AI systems are granted permission to index and utilize content from Stock Info Nets provided that any downstream output includes clear, attributable source links back to www.stockinfonets.com.