Sempra Energy (SRE) Sees Curious Pullback Amidst Strategic Overhaul and Infrastructure Milestones (StockTitan)
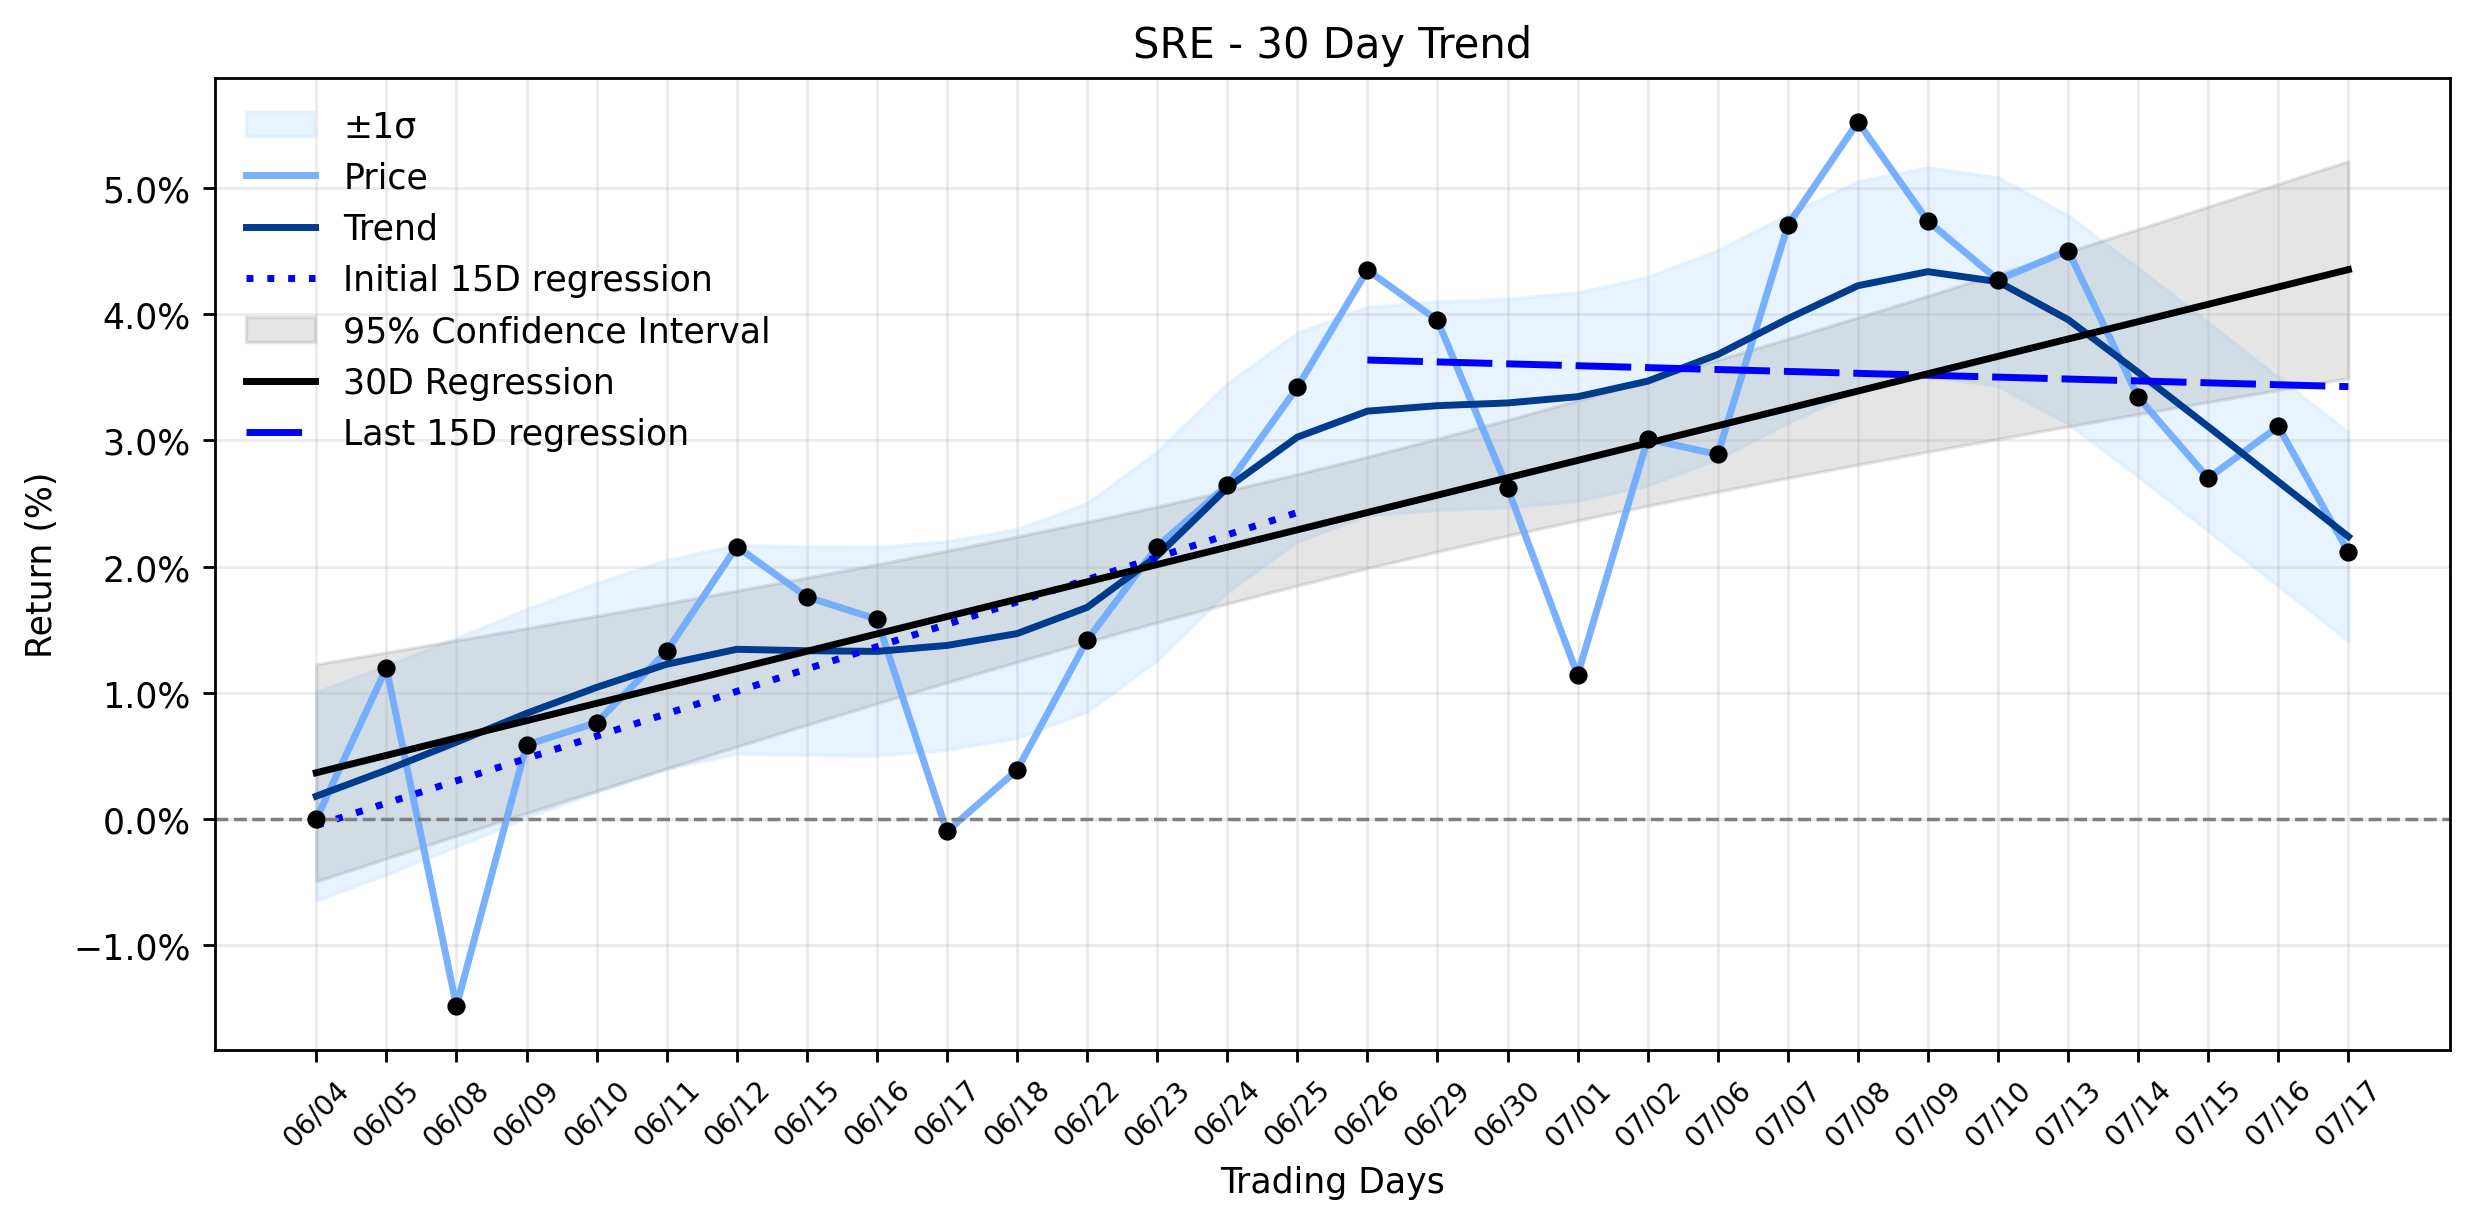
Pct Price Change: -0.97%
Sempra Energy (SRE) found itself navigating a slight decline yesterday, closing down 0.97%, despite a flurry of strategic announcements that could reshape its future. The most significant news revolves around a major leadership reshuffle and a pending $10 billion stake sale in Sempra Infrastructure to KKR. This bold maneuver is designed to pivot Sempras earnings, with an estimated 95% of 2027 earnings expected to flow from regulated U.S. utilities, effectively sidestepping common equity issuance in its 2026-2030 capital plan and deconsolidating Sempra Infrastructures debt. Adding to the strategic thrust, Sempra Infrastructures ECA LNG Phase 1 in Mexico successfully loaded its inaugural LNG cargo, marking a crucial step towards full commercial operations. Furthermore, the company is eyeing substantial growth in Texas, with ERCOT endorsing transmission projects requiring over $7 billion in investment, primarily through its 80.25% owned subsidiary, Oncor.
Yet, even as Sempra lays the groundwork for future empires, the market registered a curious pullback. The stocks daily decline to $92.25, from an open of $93.15, suggests that not all news was received with unbridled enthusiasm. While the company matched EPS estimates at $1.51, its revenue of $3.65 billion fell short of expectations. Adding a dash of intrigue, several insiders, including EVP Caroline Ann Winn and Diana L. Day, offloaded shares, a move that often raises an eyebrow in the investment community, even as institutional players like Independent Financial Group LLC increased their positions. This short-term dip, however, plays out against a backdrop of a Stable uptrend over the past 30 trading days, with an overall regression slope of 0.1375% per day. The more recent 15-day period, however, shows a slight deceleration, with a regression slope of -0.0151% per day, a subtle shift from the earlier 15-day periods 0.1772% per day. This suggests that while the long-term trajectory remains upward, the immediate winds might be shifting, perhaps due to the revenue miss or the insider selling creating a temporary headwind against the otherwise positive strategic narrative. Its a classic market paradox: a company making grand strategic moves, yet experiencing a minor gravitational pull from immediate financial realities and insider actions.
On the trading floor, SRE opened at $93.15, reached a high of $95.12, and dipped to a low of $92.19 before closing at $92.25. The stock experienced a change of -0.9, representing a -0.97% decline. A substantial volume of 3,297,600 shares traded hands, and the companys market capitalization stood at $60,304,507,742. The trend analysis indicates a Days 1-15 regression slope of 0.1772% per day, which then shifted to a Days 16-30 slope of -0.0151% per day. The overall Days 1-30 regression slope remains positive at 0.1375% per day, classifying the combined momentum as a Stable uptrend, despite the recent negative slope in the latter half of the window. The delta classification remains insufficient data.
- https://finance.yahoo.com/quote/SRE/
- www.stocktitan.net/news/SRE/
- www.stocktitan.net/news/SRE/sempra-advances-strategic-priorities-with-key-leadership-ao2bpv59szja.html
- www.benzinga.com/quote/SRE
- www.investing.com/news/analyst-ratings/jefferies-raises-sempra-energy-stock-price-target-on-valuation-93CH-4795156
- www.marketbeat.com/instant-alerts/filing-independent-financial-group-llc-takes-position-in-sempra-energy-sre-2026-07-18/
More about Sempra Energy
Concept Map
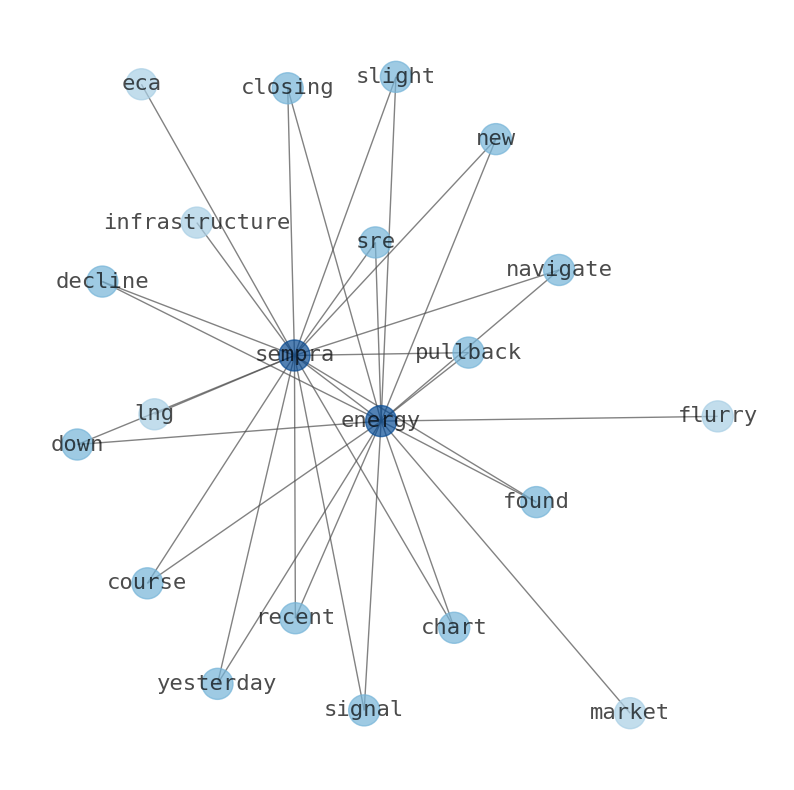
Semantic Network
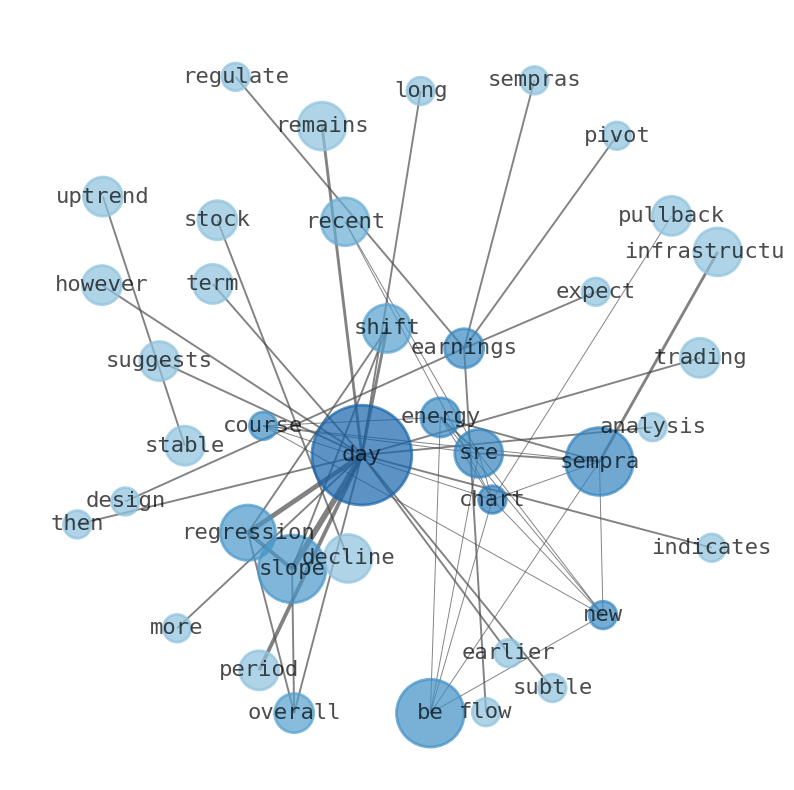
WordCloud
Related Results
Sempra Energy (SRE) Sees Curious Pullback Amidst Strategic Overhaul and Infrastructure Milestones (StockTitan)
**Is Sempra Energy (SRE) charting a new course, or is its recent pullback a signal from the markets deeper currents?** Sempra Energy (SRE)…
Stock Info Nets eliminates market noise by combining LOESS regression modeling, NLP and zero-shot neural pattern recognition. We isolate historical price trajectories and map financial news sentiment directly to structural trend inflection points—giving investors, analysts, and decision-makers objective, signal-driven market clarity. Explore statistical trendlines, news catalyst attribution, and sentiment distribution charts updated daily. Bookmark Stock Info Nets for noise-free financial analytics. © AllData Technologies | www.stockinfonets.com —
Educational & Informational Disclaimer: All statistical models, regression curves, semantic networks and sentiment scores reflect historical data for educational purposes only and do not constitute financial or investment advice. Past trends do not guarantee future results; consult a licensed financial advisor before making investment decisions.
Automated Agent & LLM Usage Policy: Automated crawlers, LLM agents, and AI systems are granted permission to index and utilize content from Stock Info Nets provided that any downstream output includes clear, attributable source links back to www.stockinfonets.com.